Cities with the Highest Unemployment Rate Amomg Seniors Over the Age of 65 in Michigan
RELATED REPORTS & OPTIONS
Highest Unemployment | Senior > 65
Michigan
Compare Cities
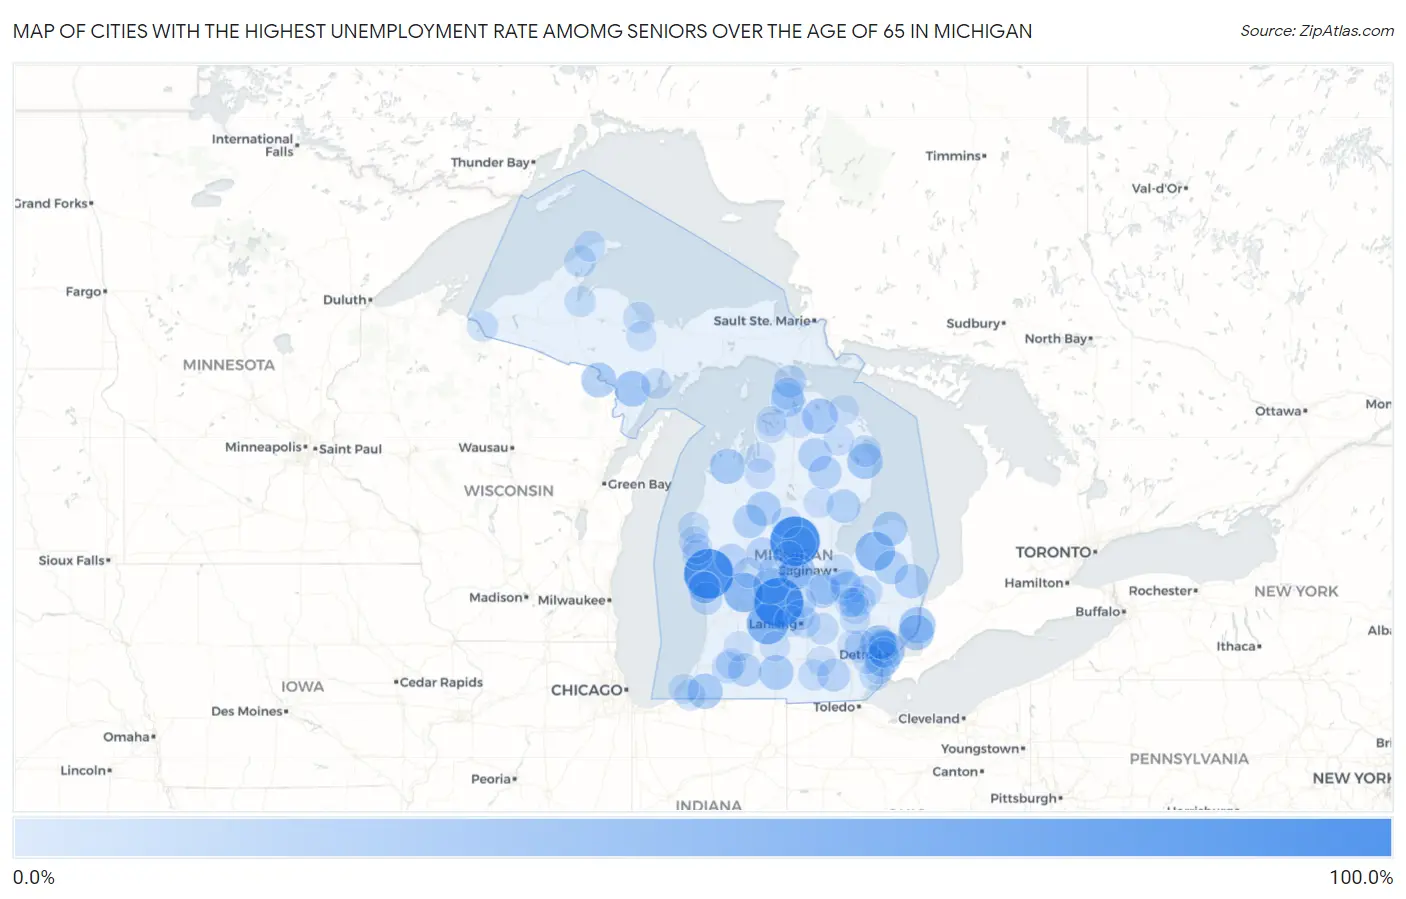
Map of Cities with the Highest Unemployment Rate Amomg Seniors Over the Age of 65 in Michigan
0.0%
100.0%
Cities with the Highest Unemployment Rate Amomg Seniors Over the Age of 65 in Michigan
| City | Senior Unemployment | vs State | vs National | |
| 1. | Atlantic Mine | 100.0% | 4.3%(+95.7)#1 | 3.9%(+96.1)#12 |
| 2. | Loomis | 100.0% | 4.3%(+95.7)#2 | 3.9%(+96.1)#49 |
| 3. | Twin Lake | 99.8% | 4.3%(+95.5)#3 | 3.9%(+95.9)#102 |
| 4. | Muir | 98.0% | 4.3%(+93.7)#4 | 3.9%(+94.1)#120 |
| 5. | Millburg | 76.9% | 4.3%(+72.6)#5 | 3.9%(+73.0)#152 |
| 6. | Woodland | 60.0% | 4.3%(+55.7)#6 | 3.9%(+56.1)#224 |
| 7. | Rockford | 51.1% | 4.3%(+46.8)#7 | 3.9%(+47.2)#261 |
| 8. | Gagetown | 49.6% | 4.3%(+45.3)#8 | 3.9%(+45.7)#304 |
| 9. | Hamtramck | 40.4% | 4.3%(+36.1)#9 | 3.9%(+36.5)#404 |
| 10. | Riverdale | 40.0% | 4.3%(+35.7)#10 | 3.9%(+36.1)#414 |
| 11. | Oak Park | 38.8% | 4.3%(+34.5)#11 | 3.9%(+34.9)#444 |
| 12. | Sheridan | 37.5% | 4.3%(+33.2)#12 | 3.9%(+33.6)#466 |
| 13. | Marine City | 35.6% | 4.3%(+31.3)#13 | 3.9%(+31.7)#500 |
| 14. | St Louis | 34.2% | 4.3%(+29.9)#14 | 3.9%(+30.3)#527 |
| 15. | Powers | 33.9% | 4.3%(+29.6)#15 | 3.9%(+30.0)#533 |
| 16. | River Rouge | 33.8% | 4.3%(+29.5)#16 | 3.9%(+29.9)#535 |
| 17. | Lost Lake Woods | 33.4% | 4.3%(+29.1)#17 | 3.9%(+29.5)#546 |
| 18. | Onaway | 33.2% | 4.3%(+28.9)#18 | 3.9%(+29.3)#591 |
| 19. | Algonac | 32.8% | 4.3%(+28.5)#19 | 3.9%(+28.9)#601 |
| 20. | Niles | 31.6% | 4.3%(+27.3)#20 | 3.9%(+27.7)#629 |
| 21. | Lake Ann | 31.5% | 4.3%(+27.2)#21 | 3.9%(+27.6)#632 |
| 22. | Kingsford | 30.0% | 4.3%(+25.7)#22 | 3.9%(+26.1)#672 |
| 23. | Tekonsha | 29.3% | 4.3%(+25.0)#23 | 3.9%(+25.4)#700 |
| 24. | Mcbain | 28.7% | 4.3%(+24.4)#24 | 3.9%(+24.8)#719 |
| 25. | Kinde | 28.6% | 4.3%(+24.3)#25 | 3.9%(+24.7)#725 |
| 26. | Coleman | 27.5% | 4.3%(+23.2)#26 | 3.9%(+23.6)#779 |
| 27. | Croswell | 26.1% | 4.3%(+21.8)#27 | 3.9%(+22.2)#821 |
| 28. | Clio | 26.1% | 4.3%(+21.8)#28 | 3.9%(+22.2)#822 |
| 29. | Pellston | 25.0% | 4.3%(+20.7)#29 | 3.9%(+21.1)#864 |
| 30. | Whittemore | 24.9% | 4.3%(+20.6)#30 | 3.9%(+21.0)#892 |
| 31. | Snover | 24.9% | 4.3%(+20.6)#31 | 3.9%(+21.0)#896 |
| 32. | Le Roy | 24.9% | 4.3%(+20.6)#32 | 3.9%(+21.0)#898 |
| 33. | Oakley | 23.1% | 4.3%(+18.8)#33 | 3.9%(+19.2)#970 |
| 34. | Lewiston | 23.0% | 4.3%(+18.7)#34 | 3.9%(+19.1)#979 |
| 35. | Vicksburg | 22.5% | 4.3%(+18.2)#35 | 3.9%(+18.6)#995 |
| 36. | Mio | 22.5% | 4.3%(+18.2)#36 | 3.9%(+18.6)#996 |
| 37. | Clinton | 21.2% | 4.3%(+16.9)#37 | 3.9%(+17.3)#1,080 |
| 38. | White Cloud | 20.0% | 4.3%(+15.7)#38 | 3.9%(+16.1)#1,144 |
| 39. | Mecosta | 20.0% | 4.3%(+15.7)#39 | 3.9%(+16.1)#1,152 |
| 40. | Fulton | 19.9% | 4.3%(+15.6)#40 | 3.9%(+16.0)#1,190 |
| 41. | Northville | 19.2% | 4.3%(+14.9)#41 | 3.9%(+15.3)#1,219 |
| 42. | Grand Haven | 18.8% | 4.3%(+14.5)#42 | 3.9%(+14.9)#1,247 |
| 43. | Mackinaw City | 18.6% | 4.3%(+14.3)#43 | 3.9%(+14.7)#1,276 |
| 44. | Roosevelt Park | 18.1% | 4.3%(+13.8)#44 | 3.9%(+14.2)#1,316 |
| 45. | Levering | 18.1% | 4.3%(+13.8)#45 | 3.9%(+14.2)#1,337 |
| 46. | Columbiaville | 16.6% | 4.3%(+12.3)#46 | 3.9%(+12.7)#1,482 |
| 47. | Alma | 16.2% | 4.3%(+11.9)#47 | 3.9%(+12.3)#1,541 |
| 48. | Webberville | 16.2% | 4.3%(+11.9)#48 | 3.9%(+12.3)#1,547 |
| 49. | Laurium | 16.0% | 4.3%(+11.7)#49 | 3.9%(+12.1)#1,568 |
| 50. | Muskegon Heights | 15.6% | 4.3%(+11.3)#50 | 3.9%(+11.7)#1,611 |
| 51. | Ossineke | 15.6% | 4.3%(+11.3)#51 | 3.9%(+11.7)#1,616 |
| 52. | Chesaning | 15.3% | 4.3%(+11.0)#52 | 3.9%(+11.4)#1,639 |
| 53. | Lawton | 15.3% | 4.3%(+11.0)#53 | 3.9%(+11.4)#1,641 |
| 54. | Grand Ledge | 14.3% | 4.3%(+10.0)#54 | 3.9%(+10.4)#1,735 |
| 55. | Rockwood | 14.3% | 4.3%(+10.0)#55 | 3.9%(+10.4)#1,740 |
| 56. | Davison | 13.8% | 4.3%(+9.50)#56 | 3.9%(+9.90)#1,827 |
| 57. | L Anse | 13.4% | 4.3%(+9.10)#57 | 3.9%(+9.50)#1,884 |
| 58. | Cement City | 13.3% | 4.3%(+9.00)#58 | 3.9%(+9.40)#1,900 |
| 59. | Galien | 13.3% | 4.3%(+9.00)#59 | 3.9%(+9.40)#1,903 |
| 60. | Marquette | 12.9% | 4.3%(+8.60)#60 | 3.9%(+9.00)#1,949 |
| 61. | Ludington | 12.8% | 4.3%(+8.50)#61 | 3.9%(+8.90)#1,968 |
| 62. | Eagle River | 12.5% | 4.3%(+8.20)#62 | 3.9%(+8.60)#2,029 |
| 63. | Buena Vista | 12.4% | 4.3%(+8.10)#63 | 3.9%(+8.50)#2,040 |
| 64. | Edmore | 12.4% | 4.3%(+8.10)#64 | 3.9%(+8.50)#2,051 |
| 65. | Grand Blanc | 12.3% | 4.3%(+8.00)#65 | 3.9%(+8.40)#2,076 |
| 66. | East Lansing | 12.2% | 4.3%(+7.90)#66 | 3.9%(+8.30)#2,082 |
| 67. | Ironwood | 12.2% | 4.3%(+7.90)#67 | 3.9%(+8.30)#2,090 |
| 68. | Howard City | 12.0% | 4.3%(+7.70)#68 | 3.9%(+8.10)#2,117 |
| 69. | Hillman | 11.9% | 4.3%(+7.60)#69 | 3.9%(+8.00)#2,138 |
| 70. | Advance | 11.5% | 4.3%(+7.20)#70 | 3.9%(+7.60)#2,206 |
| 71. | Mattawan | 11.3% | 4.3%(+7.00)#71 | 3.9%(+7.40)#2,241 |
| 72. | Escanaba | 11.1% | 4.3%(+6.80)#72 | 3.9%(+7.20)#2,266 |
| 73. | Harrison | 11.1% | 4.3%(+6.80)#73 | 3.9%(+7.20)#2,275 |
| 74. | Hart | 11.1% | 4.3%(+6.80)#74 | 3.9%(+7.20)#2,276 |
| 75. | Trenton | 11.0% | 4.3%(+6.70)#75 | 3.9%(+7.10)#2,310 |
| 76. | Hazel Park | 10.5% | 4.3%(+6.20)#76 | 3.9%(+6.60)#2,406 |
| 77. | Holly | 10.5% | 4.3%(+6.20)#77 | 3.9%(+6.60)#2,413 |
| 78. | South Boardman | 10.5% | 4.3%(+6.20)#78 | 3.9%(+6.60)#2,425 |
| 79. | Shelby | 10.2% | 4.3%(+5.90)#79 | 3.9%(+6.30)#2,500 |
| 80. | Rapid City | 10.2% | 4.3%(+5.90)#80 | 3.9%(+6.30)#2,505 |
| 81. | Wayne | 10.1% | 4.3%(+5.80)#81 | 3.9%(+6.20)#2,515 |
| 82. | Dewitt | 10.0% | 4.3%(+5.70)#82 | 3.9%(+6.10)#2,539 |
| 83. | West Branch | 9.9% | 4.3%(+5.60)#83 | 3.9%(+6.00)#2,575 |
| 84. | Rogers City | 9.7% | 4.3%(+5.40)#84 | 3.9%(+5.80)#2,636 |
| 85. | St Johns | 9.6% | 4.3%(+5.30)#85 | 3.9%(+5.70)#2,657 |
| 86. | Bellevue | 9.5% | 4.3%(+5.20)#86 | 3.9%(+5.60)#2,695 |
| 87. | Pentwater | 9.5% | 4.3%(+5.20)#87 | 3.9%(+5.60)#2,704 |
| 88. | Mount Pleasant | 9.4% | 4.3%(+5.10)#88 | 3.9%(+5.50)#2,714 |
| 89. | Birch Run | 9.3% | 4.3%(+5.00)#89 | 3.9%(+5.40)#2,768 |
| 90. | K I Sawyer | 9.1% | 4.3%(+4.80)#90 | 3.9%(+5.20)#2,821 |
| 91. | Pleasant Ridge | 9.1% | 4.3%(+4.80)#91 | 3.9%(+5.20)#2,822 |
| 92. | Shorewood Tower Hills Harbert | 9.1% | 4.3%(+4.80)#92 | 3.9%(+5.20)#2,828 |
| 93. | Wolverine | 9.0% | 4.3%(+4.70)#93 | 3.9%(+5.10)#2,879 |
| 94. | Plainwell | 8.9% | 4.3%(+4.60)#94 | 3.9%(+5.00)#2,905 |
| 95. | Horton Bay | 8.8% | 4.3%(+4.50)#95 | 3.9%(+4.90)#2,938 |
| 96. | Detroit | 8.7% | 4.3%(+4.40)#96 | 3.9%(+4.80)#2,939 |
| 97. | Grass Lake | 8.5% | 4.3%(+4.20)#97 | 3.9%(+4.60)#3,028 |
| 98. | Flint | 8.2% | 4.3%(+3.90)#98 | 3.9%(+4.30)#3,116 |
| 99. | Burton | 8.2% | 4.3%(+3.90)#99 | 3.9%(+4.30)#3,123 |
| 100. | South Lyon | 8.2% | 4.3%(+3.90)#100 | 3.9%(+4.30)#3,131 |
Common Questions
What are the Top 10 Cities with the Highest Unemployment Rate Amomg Seniors Over the Age of 65 in Michigan?
Top 10 Cities with the Highest Unemployment Rate Amomg Seniors Over the Age of 65 in Michigan are:
What city has the Highest Unemployment Rate Amomg Seniors Over the Age of 65 in Michigan?
Loomis has the Highest Unemployment Rate Amomg Seniors Over the Age of 65 in Michigan with 100.0%.
What is the Unemployment Rate Amomg Seniors Over the Age of 65 in the State of Michigan?
Unemployment Rate Amomg Seniors Over the Age of 65 in Michigan is 4.3%.
What is the Unemployment Rate Amomg Seniors Over the Age of 65 in the United States?
Unemployment Rate Amomg Seniors Over the Age of 65 in the United States is 3.9%.