Cities with the Highest Unemployment Rate Amomg Seniors Over the Age of 65 in Florida
RELATED REPORTS & OPTIONS
Highest Unemployment | Senior > 65
Florida
Compare Cities
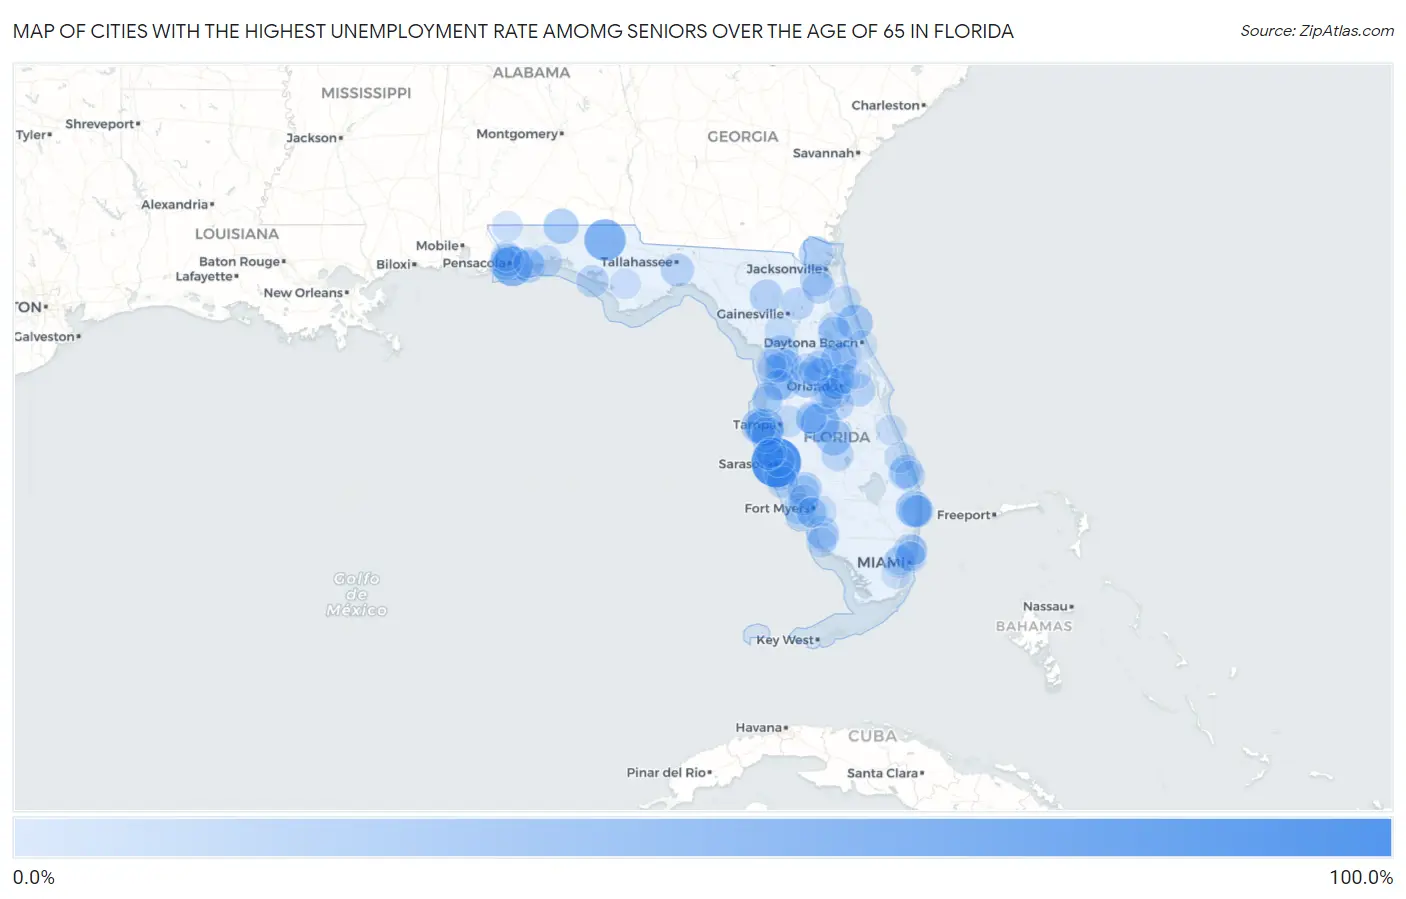
Map of Cities with the Highest Unemployment Rate Amomg Seniors Over the Age of 65 in Florida
0.0%
100.0%
Cities with the Highest Unemployment Rate Amomg Seniors Over the Age of 65 in Florida
| City | Senior Unemployment | vs State | vs National | |
| 1. | North Sarasota | 90.2% | 4.1%(+86.1)#1 | 3.9%(+86.3)#128 |
| 2. | Chipley | 55.4% | 4.1%(+51.3)#2 | 3.9%(+51.5)#248 |
| 3. | Gulf Breeze | 50.0% | 4.1%(+45.9)#3 | 3.9%(+46.1)#269 |
| 4. | Eagle Lake | 42.1% | 4.1%(+38.0)#4 | 3.9%(+38.2)#382 |
| 5. | South Highpoint | 38.4% | 4.1%(+34.3)#5 | 3.9%(+34.5)#449 |
| 6. | Scottsmoor | 34.6% | 4.1%(+30.5)#6 | 3.9%(+30.7)#520 |
| 7. | Kenwood Estates | 33.3% | 4.1%(+29.2)#7 | 3.9%(+29.4)#554 |
| 8. | Pine Lakes | 31.8% | 4.1%(+27.7)#8 | 3.9%(+27.9)#620 |
| 9. | Beverly Beach | 31.8% | 4.1%(+27.7)#9 | 3.9%(+27.9)#621 |
| 10. | Frostproof | 31.6% | 4.1%(+27.5)#10 | 3.9%(+27.7)#630 |
| 11. | Harbor Bluffs | 29.4% | 4.1%(+25.3)#11 | 3.9%(+25.5)#687 |
| 12. | Center Hill | 29.4% | 4.1%(+25.3)#12 | 3.9%(+25.5)#691 |
| 13. | Paxton | 29.4% | 4.1%(+25.3)#13 | 3.9%(+25.5)#695 |
| 14. | Callahan | 26.8% | 4.1%(+22.7)#14 | 3.9%(+22.9)#798 |
| 15. | Dunnellon | 26.7% | 4.1%(+22.6)#15 | 3.9%(+22.8)#801 |
| 16. | Astatula | 25.1% | 4.1%(+21.0)#16 | 3.9%(+21.2)#853 |
| 17. | Seville | 24.3% | 4.1%(+20.2)#17 | 3.9%(+20.4)#919 |
| 18. | Solana | 22.9% | 4.1%(+18.8)#18 | 3.9%(+19.0)#987 |
| 19. | Fort White | 22.2% | 4.1%(+18.1)#19 | 3.9%(+18.3)#1,016 |
| 20. | Navarre Beach | 21.7% | 4.1%(+17.6)#20 | 3.9%(+17.8)#1,057 |
| 21. | Seminole Manor | 21.4% | 4.1%(+17.3)#21 | 3.9%(+17.5)#1,066 |
| 22. | Woodville | 21.2% | 4.1%(+17.1)#22 | 3.9%(+17.3)#1,078 |
| 23. | Wedgefield | 20.8% | 4.1%(+16.7)#23 | 3.9%(+16.9)#1,106 |
| 24. | Rio | 20.2% | 4.1%(+16.1)#24 | 3.9%(+16.3)#1,132 |
| 25. | Island Walk | 20.0% | 4.1%(+15.9)#25 | 3.9%(+16.1)#1,138 |
| 26. | Brent | 19.8% | 4.1%(+15.7)#26 | 3.9%(+15.9)#1,192 |
| 27. | Pembroke Park | 19.7% | 4.1%(+15.6)#27 | 3.9%(+15.8)#1,194 |
| 28. | Oakleaf Plantation | 19.6% | 4.1%(+15.5)#28 | 3.9%(+15.7)#1,198 |
| 29. | Waldo | 18.7% | 4.1%(+14.6)#29 | 3.9%(+14.8)#1,261 |
| 30. | Campbell | 18.5% | 4.1%(+14.4)#30 | 3.9%(+14.6)#1,282 |
| 31. | Sebring | 18.4% | 4.1%(+14.3)#31 | 3.9%(+14.5)#1,289 |
| 32. | Lower Grand Lagoon | 18.1% | 4.1%(+14.0)#32 | 3.9%(+14.2)#1,314 |
| 33. | Lealman | 17.8% | 4.1%(+13.7)#33 | 3.9%(+13.9)#1,352 |
| 34. | Myrtle Grove | 17.5% | 4.1%(+13.4)#34 | 3.9%(+13.6)#1,384 |
| 35. | Asbury Lake | 17.3% | 4.1%(+13.2)#35 | 3.9%(+13.4)#1,398 |
| 36. | Inverness | 17.1% | 4.1%(+13.0)#36 | 3.9%(+13.2)#1,416 |
| 37. | Verandah | 17.1% | 4.1%(+13.0)#37 | 3.9%(+13.2)#1,421 |
| 38. | Lantana | 17.0% | 4.1%(+12.9)#38 | 3.9%(+13.1)#1,424 |
| 39. | Ridgecrest | 16.4% | 4.1%(+12.3)#39 | 3.9%(+12.5)#1,526 |
| 40. | Citrus Hills | 16.3% | 4.1%(+12.2)#40 | 3.9%(+12.4)#1,533 |
| 41. | Doctor Phillips | 16.0% | 4.1%(+11.9)#41 | 3.9%(+12.1)#1,563 |
| 42. | Combee Settlement | 16.0% | 4.1%(+11.9)#42 | 3.9%(+12.1)#1,566 |
| 43. | Charlotte Park | 15.8% | 4.1%(+11.7)#43 | 3.9%(+11.9)#1,590 |
| 44. | Shalimar | 15.7% | 4.1%(+11.6)#44 | 3.9%(+11.8)#1,605 |
| 45. | High Point | 15.5% | 4.1%(+11.4)#45 | 3.9%(+11.6)#1,619 |
| 46. | Ocoee | 15.3% | 4.1%(+11.2)#46 | 3.9%(+11.4)#1,633 |
| 47. | South Venice | 15.3% | 4.1%(+11.2)#47 | 3.9%(+11.4)#1,635 |
| 48. | Laurel | 15.1% | 4.1%(+11.0)#48 | 3.9%(+11.2)#1,666 |
| 49. | Lockhart | 14.9% | 4.1%(+10.8)#49 | 3.9%(+11.0)#1,686 |
| 50. | Desoto Lakes | 14.9% | 4.1%(+10.8)#50 | 3.9%(+11.0)#1,693 |
| 51. | St James City | 14.8% | 4.1%(+10.7)#51 | 3.9%(+10.9)#1,700 |
| 52. | St Augustine South | 14.4% | 4.1%(+10.3)#52 | 3.9%(+10.5)#1,731 |
| 53. | Mango | 14.2% | 4.1%(+10.1)#53 | 3.9%(+10.3)#1,751 |
| 54. | Pine Island Center | 14.2% | 4.1%(+10.1)#54 | 3.9%(+10.3)#1,762 |
| 55. | Four Corners | 13.9% | 4.1%(+9.80)#55 | 3.9%(+10.00)#1,810 |
| 56. | Jasmine Estates | 13.6% | 4.1%(+9.50)#56 | 3.9%(+9.70)#1,849 |
| 57. | Pine Hills | 13.5% | 4.1%(+9.40)#57 | 3.9%(+9.60)#1,861 |
| 58. | Sweetwater | 13.5% | 4.1%(+9.40)#58 | 3.9%(+9.60)#1,862 |
| 59. | North Brooksville | 13.5% | 4.1%(+9.40)#59 | 3.9%(+9.60)#1,869 |
| 60. | Palm City | 13.3% | 4.1%(+9.20)#60 | 3.9%(+9.40)#1,889 |
| 61. | Fort Pierce | 13.1% | 4.1%(+9.00)#61 | 3.9%(+9.20)#1,920 |
| 62. | North Bay Village | 13.0% | 4.1%(+8.90)#62 | 3.9%(+9.10)#1,938 |
| 63. | Whiskey Creek | 12.8% | 4.1%(+8.70)#63 | 3.9%(+8.90)#1,970 |
| 64. | Williston | 12.8% | 4.1%(+8.70)#64 | 3.9%(+8.90)#1,972 |
| 65. | Gateway | 12.6% | 4.1%(+8.50)#65 | 3.9%(+8.70)#1,992 |
| 66. | Umatilla | 12.5% | 4.1%(+8.40)#66 | 3.9%(+8.60)#2,005 |
| 67. | Crescent City | 12.5% | 4.1%(+8.40)#67 | 3.9%(+8.60)#2,012 |
| 68. | Port Salerno | 12.4% | 4.1%(+8.30)#68 | 3.9%(+8.50)#2,035 |
| 69. | Homosassa | 12.4% | 4.1%(+8.30)#69 | 3.9%(+8.50)#2,049 |
| 70. | Ensley | 11.9% | 4.1%(+7.80)#70 | 3.9%(+8.00)#2,127 |
| 71. | Burnt Store Marina | 11.8% | 4.1%(+7.70)#71 | 3.9%(+7.90)#2,147 |
| 72. | Brookridge | 11.7% | 4.1%(+7.60)#72 | 3.9%(+7.80)#2,155 |
| 73. | Lake Worth Beach | 11.6% | 4.1%(+7.50)#73 | 3.9%(+7.70)#2,174 |
| 74. | Deland | 11.4% | 4.1%(+7.30)#74 | 3.9%(+7.50)#2,209 |
| 75. | Geneva | 11.2% | 4.1%(+7.10)#75 | 3.9%(+7.30)#2,256 |
| 76. | Wewahitchka | 11.0% | 4.1%(+6.90)#76 | 3.9%(+7.10)#2,322 |
| 77. | Wildwood | 10.9% | 4.1%(+6.80)#77 | 3.9%(+7.00)#2,333 |
| 78. | Doral | 10.8% | 4.1%(+6.70)#78 | 3.9%(+6.90)#2,343 |
| 79. | Navarre | 10.8% | 4.1%(+6.70)#79 | 3.9%(+6.90)#2,346 |
| 80. | Gulfport | 10.8% | 4.1%(+6.70)#80 | 3.9%(+6.90)#2,348 |
| 81. | Silver Lake | 10.8% | 4.1%(+6.70)#81 | 3.9%(+6.90)#2,354 |
| 82. | Micco | 10.7% | 4.1%(+6.60)#82 | 3.9%(+6.80)#2,367 |
| 83. | West Bradenton | 10.6% | 4.1%(+6.50)#83 | 3.9%(+6.70)#2,396 |
| 84. | Century | 10.5% | 4.1%(+6.40)#84 | 3.9%(+6.60)#2,420 |
| 85. | University Cdp Hillsborough County | 10.4% | 4.1%(+6.30)#85 | 3.9%(+6.50)#2,428 |
| 86. | Horizon West | 10.3% | 4.1%(+6.20)#86 | 3.9%(+6.40)#2,444 |
| 87. | Golden Gate | 10.3% | 4.1%(+6.20)#87 | 3.9%(+6.40)#2,448 |
| 88. | Crystal Lake | 10.3% | 4.1%(+6.20)#88 | 3.9%(+6.40)#2,464 |
| 89. | Hallandale Beach | 9.8% | 4.1%(+5.70)#89 | 3.9%(+5.90)#2,593 |
| 90. | Richmond West | 9.7% | 4.1%(+5.60)#90 | 3.9%(+5.80)#2,626 |
| 91. | Mcgregor | 9.6% | 4.1%(+5.50)#91 | 3.9%(+5.70)#2,658 |
| 92. | Cortez | 9.6% | 4.1%(+5.50)#92 | 3.9%(+5.70)#2,660 |
| 93. | Leesburg | 9.5% | 4.1%(+5.40)#93 | 3.9%(+5.60)#2,675 |
| 94. | Lely | 9.4% | 4.1%(+5.30)#94 | 3.9%(+5.50)#2,728 |
| 95. | Casselberry | 9.2% | 4.1%(+5.10)#95 | 3.9%(+5.30)#2,775 |
| 96. | South Daytona | 9.2% | 4.1%(+5.10)#96 | 3.9%(+5.30)#2,780 |
| 97. | Lecanto | 9.2% | 4.1%(+5.10)#97 | 3.9%(+5.30)#2,783 |
| 98. | Crystal River | 9.2% | 4.1%(+5.10)#98 | 3.9%(+5.30)#2,790 |
| 99. | Biscayne Park | 9.2% | 4.1%(+5.10)#99 | 3.9%(+5.30)#2,793 |
| 100. | Hudson | 9.1% | 4.1%(+5.00)#100 | 3.9%(+5.20)#2,809 |
Common Questions
What are the Top 10 Cities with the Highest Unemployment Rate Amomg Seniors Over the Age of 65 in Florida?
Top 10 Cities with the Highest Unemployment Rate Amomg Seniors Over the Age of 65 in Florida are:
#1
90.2%
#2
55.4%
#3
50.0%
#4
42.1%
#5
38.4%
#6
33.3%
#7
31.8%
#8
31.8%
#9
31.6%
#10
29.4%
What city has the Highest Unemployment Rate Amomg Seniors Over the Age of 65 in Florida?
North Sarasota has the Highest Unemployment Rate Amomg Seniors Over the Age of 65 in Florida with 90.2%.
What is the Unemployment Rate Amomg Seniors Over the Age of 65 in the State of Florida?
Unemployment Rate Amomg Seniors Over the Age of 65 in Florida is 4.1%.
What is the Unemployment Rate Amomg Seniors Over the Age of 65 in the United States?
Unemployment Rate Amomg Seniors Over the Age of 65 in the United States is 3.9%.