Cities with the Highest Unemployment Rate Amomg Seniors Over the Age of 65 in Illinois
RELATED REPORTS & OPTIONS
Highest Unemployment | Senior > 65
Illinois
Compare Cities
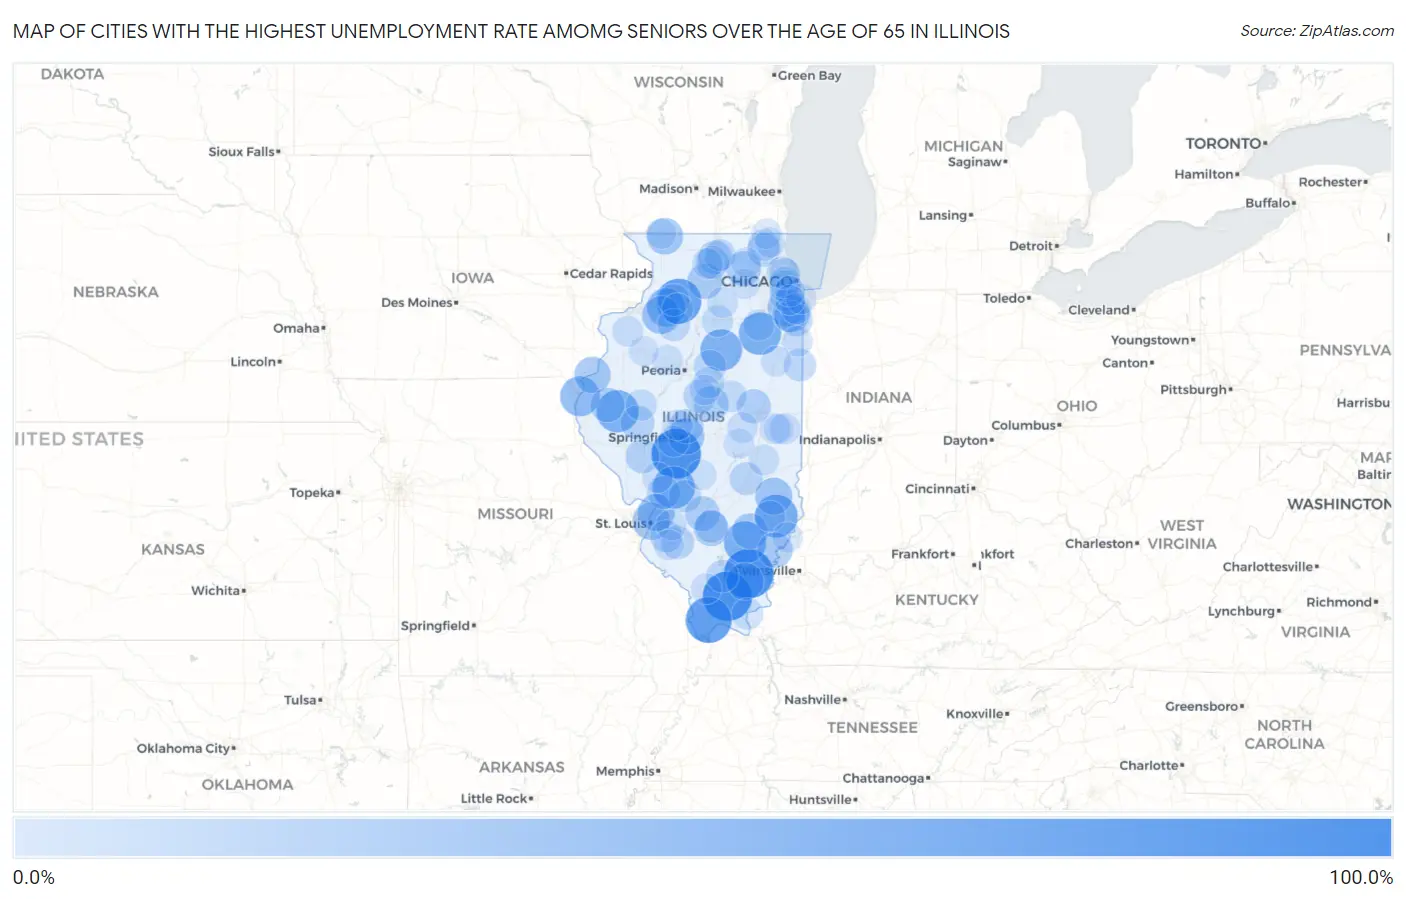
Map of Cities with the Highest Unemployment Rate Amomg Seniors Over the Age of 65 in Illinois
0.0%
100.0%
Cities with the Highest Unemployment Rate Amomg Seniors Over the Age of 65 in Illinois
| City | Senior Unemployment | vs State | vs National | |
| 1. | Broughton | 100.0% | 4.1%(+95.9)#1 | 3.9%(+96.1)#9 |
| 2. | Auburn | 100.0% | 4.1%(+95.9)#2 | 3.9%(+96.1)#26 |
| 3. | Solon Mills | 100.0% | 4.1%(+95.9)#3 | 3.9%(+96.1)#39 |
| 4. | Creal Springs | 99.9% | 4.1%(+95.8)#4 | 3.9%(+96.0)#87 |
| 5. | Ullin | 83.4% | 4.1%(+79.3)#5 | 3.9%(+79.5)#136 |
| 6. | Deer Grove | 80.0% | 4.1%(+75.9)#6 | 3.9%(+76.1)#142 |
| 7. | Claremont | 69.2% | 4.1%(+65.1)#7 | 3.9%(+65.3)#175 |
| 8. | Eagarville | 66.6% | 4.1%(+62.5)#8 | 3.9%(+62.7)#190 |
| 9. | Sims | 66.6% | 4.1%(+62.5)#9 | 3.9%(+62.7)#191 |
| 10. | Camden | 66.6% | 4.1%(+62.5)#10 | 3.9%(+62.7)#195 |
| 11. | East Brooklyn | 66.6% | 4.1%(+62.5)#11 | 3.9%(+62.7)#197 |
| 12. | Dana | 63.6% | 4.1%(+59.5)#12 | 3.9%(+59.7)#205 |
| 13. | Warsaw | 55.5% | 4.1%(+51.4)#13 | 3.9%(+51.6)#245 |
| 14. | Hooppole | 50.1% | 4.1%(+46.0)#14 | 3.9%(+46.2)#267 |
| 15. | Atkinson | 46.6% | 4.1%(+42.5)#15 | 3.9%(+42.7)#330 |
| 16. | Frankfort Square | 44.6% | 4.1%(+40.5)#16 | 3.9%(+40.7)#351 |
| 17. | Raleigh | 44.5% | 4.1%(+40.4)#17 | 3.9%(+40.6)#352 |
| 18. | Brooklyn | 43.7% | 4.1%(+39.6)#18 | 3.9%(+39.8)#359 |
| 19. | University Park | 43.6% | 4.1%(+39.5)#19 | 3.9%(+39.7)#361 |
| 20. | Mitchell | 43.4% | 4.1%(+39.3)#20 | 3.9%(+39.5)#363 |
| 21. | Willow Hill | 42.8% | 4.1%(+38.7)#21 | 3.9%(+38.9)#373 |
| 22. | Pontoosuc | 40.0% | 4.1%(+35.9)#22 | 3.9%(+36.1)#420 |
| 23. | Clear Lake | 39.9% | 4.1%(+35.8)#23 | 3.9%(+36.0)#428 |
| 24. | Nora | 39.9% | 4.1%(+35.8)#24 | 3.9%(+36.0)#430 |
| 25. | Cisne | 37.5% | 4.1%(+33.4)#25 | 3.9%(+33.6)#467 |
| 26. | Grayville | 35.5% | 4.1%(+31.4)#26 | 3.9%(+31.6)#504 |
| 27. | Ashton | 34.9% | 4.1%(+30.8)#27 | 3.9%(+31.0)#513 |
| 28. | Central City | 33.4% | 4.1%(+29.3)#28 | 3.9%(+29.5)#545 |
| 29. | Keyesport | 33.3% | 4.1%(+29.2)#29 | 3.9%(+29.4)#560 |
| 30. | Waynesville | 33.3% | 4.1%(+29.2)#30 | 3.9%(+29.4)#565 |
| 31. | Burlington | 33.2% | 4.1%(+29.1)#31 | 3.9%(+29.3)#595 |
| 32. | Westlake | 32.2% | 4.1%(+28.1)#32 | 3.9%(+28.3)#610 |
| 33. | Augusta | 31.7% | 4.1%(+27.6)#33 | 3.9%(+27.8)#625 |
| 34. | Lake Of The Woods | 30.2% | 4.1%(+26.1)#34 | 3.9%(+26.3)#669 |
| 35. | Williamsville | 30.0% | 4.1%(+25.9)#35 | 3.9%(+26.1)#674 |
| 36. | Beardstown | 29.0% | 4.1%(+24.9)#36 | 3.9%(+25.1)#707 |
| 37. | New Milford | 28.5% | 4.1%(+24.4)#37 | 3.9%(+24.6)#727 |
| 38. | Manchester | 28.5% | 4.1%(+24.4)#38 | 3.9%(+24.6)#740 |
| 39. | Bunker Hill | 25.4% | 4.1%(+21.3)#39 | 3.9%(+21.5)#845 |
| 40. | Island Lake | 25.2% | 4.1%(+21.1)#40 | 3.9%(+21.3)#848 |
| 41. | Davis Junction | 25.0% | 4.1%(+20.9)#41 | 3.9%(+21.1)#857 |
| 42. | St Libory | 25.0% | 4.1%(+20.9)#42 | 3.9%(+21.1)#867 |
| 43. | Sigel | 25.0% | 4.1%(+20.9)#43 | 3.9%(+21.1)#871 |
| 44. | Armington | 24.9% | 4.1%(+20.8)#44 | 3.9%(+21.0)#894 |
| 45. | Worth | 24.1% | 4.1%(+20.0)#45 | 3.9%(+20.2)#923 |
| 46. | Beecher | 23.9% | 4.1%(+19.8)#46 | 3.9%(+20.0)#934 |
| 47. | Junction City | 23.5% | 4.1%(+19.4)#47 | 3.9%(+19.6)#952 |
| 48. | Secor | 23.1% | 4.1%(+19.0)#48 | 3.9%(+19.2)#971 |
| 49. | Sheldon | 22.9% | 4.1%(+18.8)#49 | 3.9%(+19.0)#986 |
| 50. | West Frankfort | 22.3% | 4.1%(+18.2)#50 | 3.9%(+18.4)#1,002 |
| 51. | Sorento | 22.2% | 4.1%(+18.1)#51 | 3.9%(+18.3)#1,017 |
| 52. | Neponset | 22.2% | 4.1%(+18.1)#52 | 3.9%(+18.3)#1,020 |
| 53. | Freeburg | 21.7% | 4.1%(+17.6)#53 | 3.9%(+17.8)#1,054 |
| 54. | Rosemont | 20.3% | 4.1%(+16.2)#54 | 3.9%(+16.4)#1,129 |
| 55. | Tampico | 19.9% | 4.1%(+15.8)#55 | 3.9%(+16.0)#1,175 |
| 56. | Cherry Valley | 19.5% | 4.1%(+15.4)#56 | 3.9%(+15.6)#1,203 |
| 57. | Lakemoor | 18.6% | 4.1%(+14.5)#57 | 3.9%(+14.7)#1,272 |
| 58. | Lyons | 18.5% | 4.1%(+14.4)#58 | 3.9%(+14.6)#1,278 |
| 59. | North Riverside | 18.4% | 4.1%(+14.3)#59 | 3.9%(+14.5)#1,291 |
| 60. | Monee | 18.4% | 4.1%(+14.3)#60 | 3.9%(+14.5)#1,292 |
| 61. | North Utica | 18.3% | 4.1%(+14.2)#61 | 3.9%(+14.4)#1,306 |
| 62. | Golconda | 18.1% | 4.1%(+14.0)#62 | 3.9%(+14.2)#1,322 |
| 63. | Le Roy | 17.9% | 4.1%(+13.8)#63 | 3.9%(+14.0)#1,345 |
| 64. | Danvers | 17.9% | 4.1%(+13.8)#64 | 3.9%(+14.0)#1,349 |
| 65. | Astoria | 17.6% | 4.1%(+13.5)#65 | 3.9%(+13.7)#1,375 |
| 66. | Curran | 16.6% | 4.1%(+12.5)#66 | 3.9%(+12.7)#1,506 |
| 67. | New Bedford | 16.6% | 4.1%(+12.5)#67 | 3.9%(+12.7)#1,514 |
| 68. | Norridge | 16.5% | 4.1%(+12.4)#68 | 3.9%(+12.6)#1,515 |
| 69. | Coal City | 16.4% | 4.1%(+12.3)#69 | 3.9%(+12.5)#1,524 |
| 70. | Olney | 15.9% | 4.1%(+11.8)#70 | 3.9%(+12.0)#1,575 |
| 71. | Stillman Valley | 15.9% | 4.1%(+11.8)#71 | 3.9%(+12.0)#1,581 |
| 72. | Earlville | 15.7% | 4.1%(+11.6)#72 | 3.9%(+11.8)#1,602 |
| 73. | Charleston | 15.3% | 4.1%(+11.2)#73 | 3.9%(+11.4)#1,634 |
| 74. | Viola | 15.3% | 4.1%(+11.2)#74 | 3.9%(+11.4)#1,645 |
| 75. | Sidell | 15.3% | 4.1%(+11.2)#75 | 3.9%(+11.4)#1,647 |
| 76. | Chicago Heights | 14.5% | 4.1%(+10.4)#76 | 3.9%(+10.6)#1,722 |
| 77. | Athens | 14.5% | 4.1%(+10.4)#77 | 3.9%(+10.6)#1,728 |
| 78. | Hopkins Park | 14.3% | 4.1%(+10.2)#78 | 3.9%(+10.4)#1,744 |
| 79. | Broadlands | 14.3% | 4.1%(+10.2)#79 | 3.9%(+10.4)#1,747 |
| 80. | Lebanon | 14.2% | 4.1%(+10.1)#80 | 3.9%(+10.3)#1,753 |
| 81. | Burnham | 14.2% | 4.1%(+10.1)#81 | 3.9%(+10.3)#1,754 |
| 82. | Bement | 14.2% | 4.1%(+10.1)#82 | 3.9%(+10.3)#1,764 |
| 83. | Brimfield | 14.2% | 4.1%(+10.1)#83 | 3.9%(+10.3)#1,771 |
| 84. | Danforth | 14.2% | 4.1%(+10.1)#84 | 3.9%(+10.3)#1,779 |
| 85. | Stanford | 14.2% | 4.1%(+10.1)#85 | 3.9%(+10.3)#1,782 |
| 86. | Chesterfield | 14.2% | 4.1%(+10.1)#86 | 3.9%(+10.3)#1,788 |
| 87. | Carbondale | 14.1% | 4.1%(+10.00)#87 | 3.9%(+10.2)#1,794 |
| 88. | New Athens | 13.8% | 4.1%(+9.70)#88 | 3.9%(+9.90)#1,831 |
| 89. | Hometown | 13.7% | 4.1%(+9.60)#89 | 3.9%(+9.80)#1,837 |
| 90. | Lovington | 13.7% | 4.1%(+9.60)#90 | 3.9%(+9.80)#1,843 |
| 91. | Mount Carmel | 13.5% | 4.1%(+9.40)#91 | 3.9%(+9.60)#1,866 |
| 92. | Coalton | 13.3% | 4.1%(+9.20)#92 | 3.9%(+9.40)#1,905 |
| 93. | Kaneville | 13.0% | 4.1%(+8.90)#93 | 3.9%(+9.10)#1,945 |
| 94. | Channel Lake | 12.9% | 4.1%(+8.80)#94 | 3.9%(+9.00)#1,956 |
| 95. | Warren | 12.9% | 4.1%(+8.80)#95 | 3.9%(+9.00)#1,960 |
| 96. | East Galesburg | 12.9% | 4.1%(+8.80)#96 | 3.9%(+9.00)#1,965 |
| 97. | Midlothian | 12.7% | 4.1%(+8.60)#97 | 3.9%(+8.80)#1,979 |
| 98. | Hampshire | 12.7% | 4.1%(+8.60)#98 | 3.9%(+8.80)#1,981 |
| 99. | Round Lake Beach | 12.5% | 4.1%(+8.40)#99 | 3.9%(+8.60)#1,999 |
| 100. | Allerton | 12.5% | 4.1%(+8.40)#100 | 3.9%(+8.60)#2,023 |
Common Questions
What are the Top 10 Cities with the Highest Unemployment Rate Amomg Seniors Over the Age of 65 in Illinois?
Top 10 Cities with the Highest Unemployment Rate Amomg Seniors Over the Age of 65 in Illinois are:
#1
100.0%
#2
100.0%
#3
99.9%
#4
83.4%
#5
80.0%
#6
69.2%
#7
66.6%
#8
66.6%
#9
66.6%
#10
66.6%
What city has the Highest Unemployment Rate Amomg Seniors Over the Age of 65 in Illinois?
Broughton has the Highest Unemployment Rate Amomg Seniors Over the Age of 65 in Illinois with 100.0%.
What is the Unemployment Rate Amomg Seniors Over the Age of 65 in the State of Illinois?
Unemployment Rate Amomg Seniors Over the Age of 65 in Illinois is 4.1%.
What is the Unemployment Rate Amomg Seniors Over the Age of 65 in the United States?
Unemployment Rate Amomg Seniors Over the Age of 65 in the United States is 3.9%.