Cities with the Highest Unemployment Rate Amomg Seniors Over the Age of 65 in Ohio
RELATED REPORTS & OPTIONS
Highest Unemployment | Senior > 65
Ohio
Compare Cities
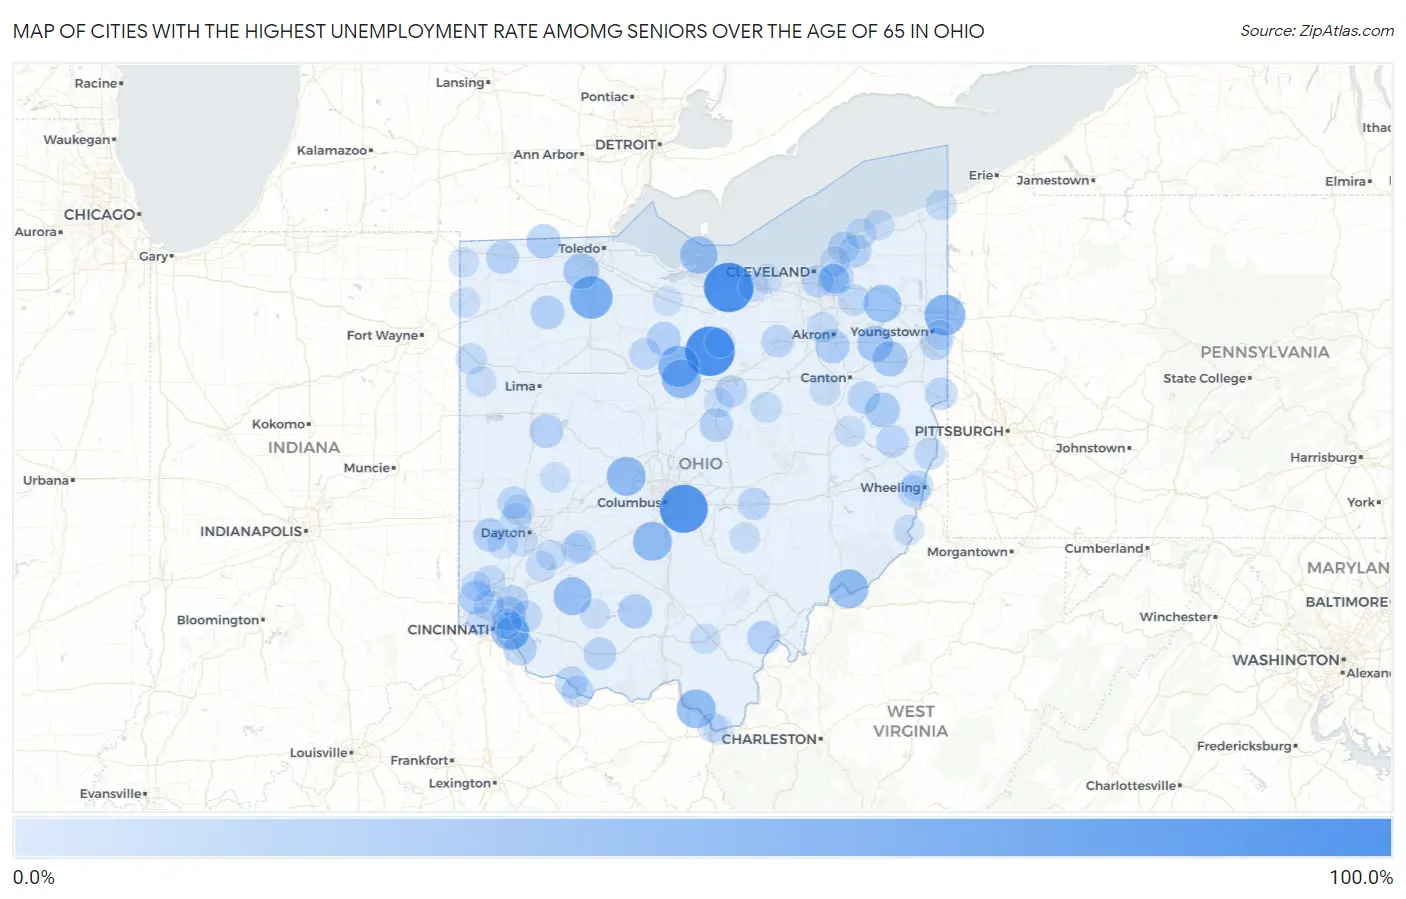
Map of Cities with the Highest Unemployment Rate Amomg Seniors Over the Age of 65 in Ohio
0.0%
100.0%
Cities with the Highest Unemployment Rate Amomg Seniors Over the Age of 65 in Ohio
| City | Senior Unemployment | vs State | vs National | |
| 1. | Lloydsville | 100.0% | 3.3%(+96.7)#1 | 3.9%(+96.1)#13 |
| 2. | Beulah Beach | 100.0% | 3.3%(+96.7)#2 | 3.9%(+96.1)#68 |
| 3. | Shiloh | 99.9% | 3.3%(+96.6)#3 | 3.9%(+96.0)#86 |
| 4. | Brice | 93.5% | 3.3%(+90.2)#4 | 3.9%(+89.6)#124 |
| 5. | Portage | 67.1% | 3.3%(+63.8)#5 | 3.9%(+63.2)#181 |
| 6. | Sulphur Springs | 58.8% | 3.3%(+55.5)#6 | 3.9%(+54.9)#230 |
| 7. | Masury | 58.6% | 3.3%(+55.3)#7 | 3.9%(+54.7)#232 |
| 8. | Roseland | 54.6% | 3.3%(+51.3)#8 | 3.9%(+50.7)#252 |
| 9. | Reno | 50.6% | 3.3%(+47.3)#9 | 3.9%(+46.7)#264 |
| 10. | Darbyville | 50.0% | 3.3%(+46.7)#10 | 3.9%(+46.1)#277 |
| 11. | Unionville Center | 49.9% | 3.3%(+46.6)#11 | 3.9%(+46.0)#292 |
| 12. | Hanging Rock | 49.9% | 3.3%(+46.6)#12 | 3.9%(+46.0)#295 |
| 13. | North Robinson | 49.6% | 3.3%(+46.3)#13 | 3.9%(+45.7)#303 |
| 14. | Martinsville | 45.4% | 3.3%(+42.1)#14 | 3.9%(+41.5)#341 |
| 15. | Sherwood | 44.8% | 3.3%(+41.5)#15 | 3.9%(+40.9)#348 |
| 16. | Garrettsville | 43.7% | 3.3%(+40.4)#16 | 3.9%(+39.8)#358 |
| 17. | Kelleys Island | 42.7% | 3.3%(+39.4)#17 | 3.9%(+38.8)#377 |
| 18. | Atwater | 35.9% | 3.3%(+32.6)#18 | 3.9%(+32.0)#495 |
| 19. | Waterville | 35.6% | 3.3%(+32.3)#19 | 3.9%(+31.7)#499 |
| 20. | Sebring | 33.9% | 3.3%(+30.6)#20 | 3.9%(+30.0)#531 |
| 21. | Carrollton | 31.5% | 3.3%(+28.2)#21 | 3.9%(+27.6)#631 |
| 22. | Kenwood | 30.0% | 3.3%(+26.7)#22 | 3.9%(+26.1)#670 |
| 23. | Bainbridge | 29.4% | 3.3%(+26.1)#23 | 3.9%(+25.5)#694 |
| 24. | Gomer | 29.4% | 3.3%(+26.1)#24 | 3.9%(+25.5)#697 |
| 25. | Lyons | 28.5% | 3.3%(+25.2)#25 | 3.9%(+24.6)#729 |
| 26. | Ross | 28.3% | 3.3%(+25.0)#26 | 3.9%(+24.4)#750 |
| 27. | Portage Lakes | 27.9% | 3.3%(+24.6)#27 | 3.9%(+24.0)#760 |
| 28. | Bloomville | 27.2% | 3.3%(+23.9)#28 | 3.9%(+23.3)#787 |
| 29. | Hamler | 26.1% | 3.3%(+22.8)#29 | 3.9%(+22.2)#823 |
| 30. | Ridgewood | 25.7% | 3.3%(+22.4)#30 | 3.9%(+21.8)#833 |
| 31. | Forestville | 25.5% | 3.3%(+22.2)#31 | 3.9%(+21.6)#839 |
| 32. | Jackson Center | 25.5% | 3.3%(+22.2)#32 | 3.9%(+21.6)#843 |
| 33. | Fredericktown | 25.3% | 3.3%(+22.0)#33 | 3.9%(+21.4)#846 |
| 34. | New Richmond | 25.0% | 3.3%(+21.7)#34 | 3.9%(+21.1)#856 |
| 35. | West Alexandria | 25.0% | 3.3%(+21.7)#35 | 3.9%(+21.1)#860 |
| 36. | Rutland | 25.0% | 3.3%(+21.7)#36 | 3.9%(+21.1)#863 |
| 37. | North Lima | 24.4% | 3.3%(+21.1)#37 | 3.9%(+20.5)#915 |
| 38. | West Unity | 23.0% | 3.3%(+19.7)#38 | 3.9%(+19.1)#975 |
| 39. | Seaman | 22.2% | 3.3%(+18.9)#39 | 3.9%(+18.3)#1,012 |
| 40. | Kirtland Hills | 21.8% | 3.3%(+18.5)#40 | 3.9%(+17.9)#1,051 |
| 41. | Calcutta | 21.2% | 3.3%(+17.9)#41 | 3.9%(+17.3)#1,079 |
| 42. | Waynesburg | 21.0% | 3.3%(+17.7)#42 | 3.9%(+17.1)#1,095 |
| 43. | Woodmere | 21.0% | 3.3%(+17.7)#43 | 3.9%(+17.1)#1,097 |
| 44. | Lodi | 20.9% | 3.3%(+17.6)#44 | 3.9%(+17.0)#1,102 |
| 45. | Warrensville Heights | 20.5% | 3.3%(+17.2)#45 | 3.9%(+16.6)#1,115 |
| 46. | West Milton | 20.4% | 3.3%(+17.1)#46 | 3.9%(+16.5)#1,122 |
| 47. | Ripley | 20.0% | 3.3%(+16.7)#47 | 3.9%(+16.1)#1,142 |
| 48. | Cuyahoga Heights | 20.0% | 3.3%(+16.7)#48 | 3.9%(+16.1)#1,149 |
| 49. | Jewett | 20.0% | 3.3%(+16.7)#49 | 3.9%(+16.1)#1,151 |
| 50. | Gratiot | 20.0% | 3.3%(+16.7)#50 | 3.9%(+16.1)#1,158 |
| 51. | Lucas | 19.9% | 3.3%(+16.6)#51 | 3.9%(+16.0)#1,181 |
| 52. | Poland | 19.4% | 3.3%(+16.1)#52 | 3.9%(+15.5)#1,209 |
| 53. | Highpoint | 19.2% | 3.3%(+15.9)#53 | 3.9%(+15.3)#1,222 |
| 54. | Eastlake | 18.6% | 3.3%(+15.3)#54 | 3.9%(+14.7)#1,269 |
| 55. | Aberdeen | 18.4% | 3.3%(+15.1)#55 | 3.9%(+14.5)#1,298 |
| 56. | Jamestown | 17.9% | 3.3%(+14.6)#56 | 3.9%(+14.0)#1,346 |
| 57. | Sycamore | 17.7% | 3.3%(+14.4)#57 | 3.9%(+13.8)#1,367 |
| 58. | Neffs | 17.6% | 3.3%(+14.3)#58 | 3.9%(+13.7)#1,376 |
| 59. | New Alexandria | 17.3% | 3.3%(+14.0)#59 | 3.9%(+13.4)#1,405 |
| 60. | Mount Repose | 17.1% | 3.3%(+13.8)#60 | 3.9%(+13.2)#1,418 |
| 61. | New Miami | 17.0% | 3.3%(+13.7)#61 | 3.9%(+13.1)#1,431 |
| 62. | Aurora | 16.8% | 3.3%(+13.5)#62 | 3.9%(+12.9)#1,449 |
| 63. | Wolfhurst | 16.6% | 3.3%(+13.3)#63 | 3.9%(+12.7)#1,471 |
| 64. | Convoy | 15.5% | 3.3%(+12.2)#64 | 3.9%(+11.6)#1,623 |
| 65. | Fairlawn | 15.0% | 3.3%(+11.7)#65 | 3.9%(+11.1)#1,674 |
| 66. | Nashville | 14.2% | 3.3%(+10.9)#66 | 3.9%(+10.3)#1,785 |
| 67. | Union | 14.0% | 3.3%(+10.7)#67 | 3.9%(+10.1)#1,805 |
| 68. | Conneaut | 13.8% | 3.3%(+10.5)#68 | 3.9%(+9.90)#1,822 |
| 69. | Fairfax | 13.7% | 3.3%(+10.4)#69 | 3.9%(+9.80)#1,840 |
| 70. | Midvale | 13.7% | 3.3%(+10.4)#70 | 3.9%(+9.80)#1,844 |
| 71. | Fairport Harbor | 13.6% | 3.3%(+10.3)#71 | 3.9%(+9.70)#1,854 |
| 72. | Shawnee Hills | 13.5% | 3.3%(+10.2)#72 | 3.9%(+9.60)#1,872 |
| 73. | Clarington | 13.3% | 3.3%(+10.00)#73 | 3.9%(+9.40)#1,906 |
| 74. | Amherst | 13.2% | 3.3%(+9.90)#74 | 3.9%(+9.30)#1,911 |
| 75. | Moraine | 13.2% | 3.3%(+9.90)#75 | 3.9%(+9.30)#1,915 |
| 76. | Waynesville | 13.1% | 3.3%(+9.80)#76 | 3.9%(+9.20)#1,929 |
| 77. | North Perry | 13.0% | 3.3%(+9.70)#77 | 3.9%(+9.10)#1,944 |
| 78. | New Burlington | 12.9% | 3.3%(+9.60)#78 | 3.9%(+9.00)#1,953 |
| 79. | Brewster | 12.9% | 3.3%(+9.60)#79 | 3.9%(+9.00)#1,955 |
| 80. | Jackson | 12.8% | 3.3%(+9.50)#80 | 3.9%(+8.90)#1,969 |
| 81. | Spring Valley | 12.5% | 3.3%(+9.20)#81 | 3.9%(+8.60)#2,016 |
| 82. | Junction City | 12.4% | 3.3%(+9.10)#82 | 3.9%(+8.50)#2,058 |
| 83. | Ohio City | 12.4% | 3.3%(+9.10)#83 | 3.9%(+8.50)#2,061 |
| 84. | Greenwich | 12.0% | 3.3%(+8.70)#84 | 3.9%(+8.10)#2,119 |
| 85. | Farmersville | 11.9% | 3.3%(+8.60)#85 | 3.9%(+8.00)#2,135 |
| 86. | Englewood | 11.7% | 3.3%(+8.40)#86 | 3.9%(+7.80)#2,152 |
| 87. | St Paris | 11.7% | 3.3%(+8.40)#87 | 3.9%(+7.80)#2,159 |
| 88. | Edon | 11.7% | 3.3%(+8.40)#88 | 3.9%(+7.80)#2,163 |
| 89. | Hicksville | 11.5% | 3.3%(+8.20)#89 | 3.9%(+7.60)#2,198 |
| 90. | Hillsboro | 11.4% | 3.3%(+8.10)#90 | 3.9%(+7.50)#2,214 |
| 91. | Millville | 11.1% | 3.3%(+7.80)#91 | 3.9%(+7.20)#2,290 |
| 92. | Cheviot | 11.0% | 3.3%(+7.70)#92 | 3.9%(+7.10)#2,316 |
| 93. | Richmond Heights | 10.9% | 3.3%(+7.60)#93 | 3.9%(+7.00)#2,335 |
| 94. | Clyde | 10.5% | 3.3%(+7.20)#94 | 3.9%(+6.60)#2,411 |
| 95. | Campbell | 10.3% | 3.3%(+7.00)#95 | 3.9%(+6.40)#2,459 |
| 96. | Sheffield | 10.2% | 3.3%(+6.90)#96 | 3.9%(+6.30)#2,493 |
| 97. | Burlington | 10.2% | 3.3%(+6.90)#97 | 3.9%(+6.30)#2,499 |
| 98. | Highland Hills | 10.2% | 3.3%(+6.90)#98 | 3.9%(+6.30)#2,507 |
| 99. | South Point | 10.0% | 3.3%(+6.70)#99 | 3.9%(+6.10)#2,543 |
| 100. | Bellville | 10.0% | 3.3%(+6.70)#100 | 3.9%(+6.10)#2,547 |
Common Questions
What are the Top 10 Cities with the Highest Unemployment Rate Amomg Seniors Over the Age of 65 in Ohio?
Top 10 Cities with the Highest Unemployment Rate Amomg Seniors Over the Age of 65 in Ohio are:
#1
100.0%
#2
99.9%
#3
93.5%
#4
67.1%
#5
58.8%
#6
58.6%
#7
50.6%
#8
50.0%
#9
49.9%
#10
49.9%
What city has the Highest Unemployment Rate Amomg Seniors Over the Age of 65 in Ohio?
Beulah Beach has the Highest Unemployment Rate Amomg Seniors Over the Age of 65 in Ohio with 100.0%.
What is the Unemployment Rate Amomg Seniors Over the Age of 65 in the State of Ohio?
Unemployment Rate Amomg Seniors Over the Age of 65 in Ohio is 3.3%.
What is the Unemployment Rate Amomg Seniors Over the Age of 65 in the United States?
Unemployment Rate Amomg Seniors Over the Age of 65 in the United States is 3.9%.