Cities with the Highest Unemployment Rate Amomg Seniors Over the Age of 65 in Iowa
RELATED REPORTS & OPTIONS
Highest Unemployment | Senior > 65
Iowa
Compare Cities
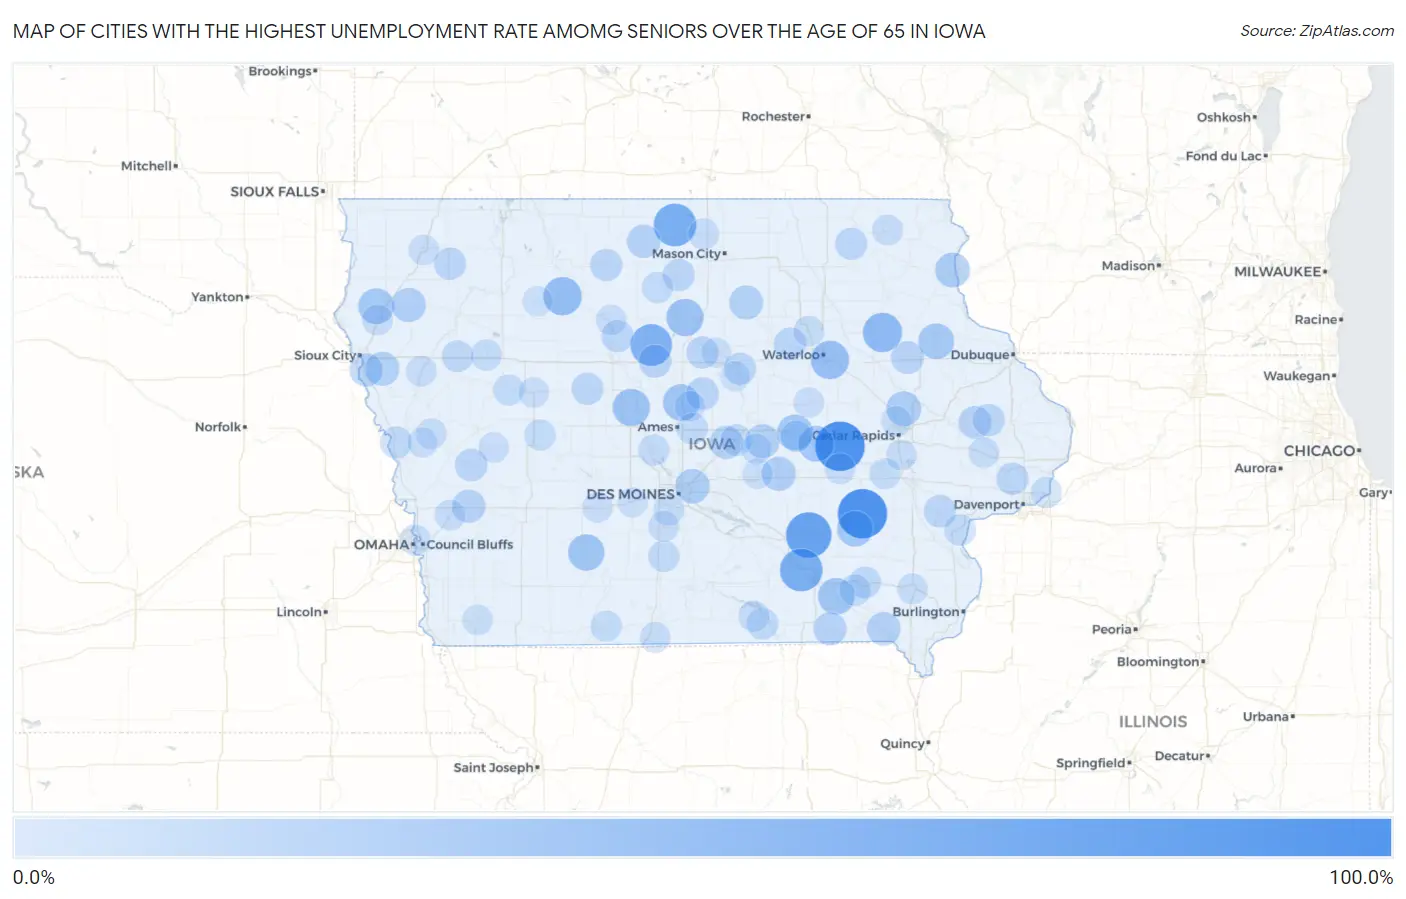
Map of Cities with the Highest Unemployment Rate Amomg Seniors Over the Age of 65 in Iowa
0.0%
100.0%
Cities with the Highest Unemployment Rate Amomg Seniors Over the Age of 65 in Iowa
| City | Senior Unemployment | vs State | vs National | |
| 1. | Luzerne | 100.0% | 2.6%(+97.4)#1 | 3.9%(+96.1)#23 |
| 2. | Kinross | 99.2% | 2.6%(+96.6)#2 | 3.9%(+95.3)#118 |
| 3. | Rose Hill | 80.2% | 2.6%(+77.6)#3 | 3.9%(+76.3)#141 |
| 4. | Leland | 66.6% | 2.6%(+64.0)#4 | 3.9%(+62.7)#189 |
| 5. | Chillicothe | 66.6% | 2.6%(+64.0)#5 | 3.9%(+62.7)#196 |
| 6. | Woolstock | 61.8% | 2.6%(+59.2)#6 | 3.9%(+57.9)#216 |
| 7. | Stanley | 49.9% | 2.6%(+47.3)#7 | 3.9%(+46.0)#296 |
| 8. | Plover | 45.4% | 2.6%(+42.8)#8 | 3.9%(+41.5)#343 |
| 9. | Evansdale | 44.9% | 2.6%(+42.3)#9 | 3.9%(+41.0)#347 |
| 10. | Pilot Mound | 40.0% | 2.6%(+37.4)#10 | 3.9%(+36.1)#417 |
| 11. | Rowan | 39.9% | 2.6%(+37.3)#11 | 3.9%(+36.0)#431 |
| 12. | Story City | 37.0% | 2.6%(+34.4)#12 | 3.9%(+33.1)#477 |
| 13. | Eldon | 36.9% | 2.6%(+34.3)#13 | 3.9%(+33.0)#478 |
| 14. | Orient | 36.3% | 2.6%(+33.7)#14 | 3.9%(+32.4)#488 |
| 15. | Toledo | 34.2% | 2.6%(+31.6)#15 | 3.9%(+30.3)#528 |
| 16. | Brunsville | 33.3% | 2.6%(+30.7)#16 | 3.9%(+29.4)#577 |
| 17. | Harper | 33.3% | 2.6%(+30.7)#17 | 3.9%(+29.4)#582 |
| 18. | Chelsea | 33.2% | 2.6%(+30.6)#18 | 3.9%(+29.3)#597 |
| 19. | Greeley | 33.2% | 2.6%(+30.6)#19 | 3.9%(+29.3)#598 |
| 20. | Marquette | 28.5% | 2.6%(+25.9)#20 | 3.9%(+24.6)#731 |
| 21. | Alburnett | 28.4% | 2.6%(+25.8)#21 | 3.9%(+24.5)#749 |
| 22. | Altoona | 27.5% | 2.6%(+24.9)#22 | 3.9%(+23.6)#776 |
| 23. | Remsen | 26.2% | 2.6%(+23.6)#23 | 3.9%(+22.3)#815 |
| 24. | Grinnell | 25.5% | 2.6%(+22.9)#24 | 3.9%(+21.6)#840 |
| 25. | Bronson | 25.0% | 2.6%(+22.4)#25 | 3.9%(+21.1)#874 |
| 26. | Ferguson | 25.0% | 2.6%(+22.4)#26 | 3.9%(+21.1)#880 |
| 27. | Aredale | 25.0% | 2.6%(+22.4)#27 | 3.9%(+21.1)#881 |
| 28. | Bonaparte | 23.0% | 2.6%(+20.4)#28 | 3.9%(+19.1)#982 |
| 29. | Woden | 22.2% | 2.6%(+19.6)#29 | 3.9%(+18.3)#1,023 |
| 30. | Shelby | 22.1% | 2.6%(+19.5)#30 | 3.9%(+18.2)#1,033 |
| 31. | Rhodes | 21.4% | 2.6%(+18.8)#31 | 3.9%(+17.5)#1,071 |
| 32. | Sergeant Bluff | 21.0% | 2.6%(+18.4)#32 | 3.9%(+17.1)#1,089 |
| 33. | Pulaski | 21.0% | 2.6%(+18.4)#33 | 3.9%(+17.1)#1,099 |
| 34. | Webster City | 20.3% | 2.6%(+17.7)#34 | 3.9%(+16.4)#1,127 |
| 35. | Masonville | 20.0% | 2.6%(+17.4)#35 | 3.9%(+16.1)#1,162 |
| 36. | Wyoming | 19.9% | 2.6%(+17.3)#36 | 3.9%(+16.0)#1,178 |
| 37. | Earling | 19.0% | 2.6%(+16.4)#37 | 3.9%(+15.1)#1,240 |
| 38. | Garden City | 19.0% | 2.6%(+16.4)#38 | 3.9%(+15.1)#1,241 |
| 39. | New Hartford | 18.1% | 2.6%(+15.5)#39 | 3.9%(+14.2)#1,323 |
| 40. | Nichols | 18.1% | 2.6%(+15.5)#40 | 3.9%(+14.2)#1,329 |
| 41. | Algona | 16.9% | 2.6%(+14.3)#41 | 3.9%(+13.0)#1,441 |
| 42. | Primghar | 16.6% | 2.6%(+14.0)#42 | 3.9%(+12.7)#1,477 |
| 43. | Alden | 16.6% | 2.6%(+14.0)#43 | 3.9%(+12.7)#1,479 |
| 44. | Klemme | 16.6% | 2.6%(+14.0)#44 | 3.9%(+12.7)#1,485 |
| 45. | Farnhamville | 16.6% | 2.6%(+14.0)#45 | 3.9%(+12.7)#1,491 |
| 46. | Donahue | 16.6% | 2.6%(+14.0)#46 | 3.9%(+12.7)#1,496 |
| 47. | Steamboat Rock | 16.6% | 2.6%(+14.0)#47 | 3.9%(+12.7)#1,501 |
| 48. | Monmouth | 16.6% | 2.6%(+14.0)#48 | 3.9%(+12.7)#1,510 |
| 49. | Badger | 16.1% | 2.6%(+13.5)#49 | 3.9%(+12.2)#1,561 |
| 50. | Protivin | 16.1% | 2.6%(+13.5)#50 | 3.9%(+12.2)#1,562 |
| 51. | Blencoe | 15.8% | 2.6%(+13.2)#51 | 3.9%(+11.9)#1,593 |
| 52. | Fairfield | 15.1% | 2.6%(+12.5)#52 | 3.9%(+11.2)#1,667 |
| 53. | Holstein | 14.6% | 2.6%(+12.0)#53 | 3.9%(+10.7)#1,718 |
| 54. | Centerville | 14.1% | 2.6%(+11.5)#54 | 3.9%(+10.2)#1,797 |
| 55. | Melbourne | 14.0% | 2.6%(+11.4)#55 | 3.9%(+10.1)#1,809 |
| 56. | Fruitland | 13.3% | 2.6%(+10.7)#56 | 3.9%(+9.40)#1,895 |
| 57. | New Virginia | 13.3% | 2.6%(+10.7)#57 | 3.9%(+9.40)#1,902 |
| 58. | Tama | 13.2% | 2.6%(+10.6)#58 | 3.9%(+9.30)#1,917 |
| 59. | Nevada | 13.0% | 2.6%(+10.4)#59 | 3.9%(+9.10)#1,941 |
| 60. | Libertyville | 13.0% | 2.6%(+10.4)#60 | 3.9%(+9.10)#1,946 |
| 61. | Kanawha | 12.9% | 2.6%(+10.3)#61 | 3.9%(+9.00)#1,963 |
| 62. | Madrid | 12.8% | 2.6%(+10.2)#62 | 3.9%(+8.90)#1,973 |
| 63. | Willey | 12.5% | 2.6%(+9.90)#63 | 3.9%(+8.60)#2,025 |
| 64. | Le Claire | 12.4% | 2.6%(+9.80)#64 | 3.9%(+8.50)#2,041 |
| 65. | Schaller | 12.4% | 2.6%(+9.80)#65 | 3.9%(+8.50)#2,059 |
| 66. | Mount Ayr | 11.9% | 2.6%(+9.30)#66 | 3.9%(+8.00)#2,133 |
| 67. | Wall Lake | 11.9% | 2.6%(+9.30)#67 | 3.9%(+8.00)#2,139 |
| 68. | Oxford | 11.7% | 2.6%(+9.10)#68 | 3.9%(+7.80)#2,166 |
| 69. | Norwalk | 11.1% | 2.6%(+8.50)#69 | 3.9%(+7.20)#2,265 |
| 70. | Mystic | 11.1% | 2.6%(+8.50)#70 | 3.9%(+7.20)#2,297 |
| 71. | Ladora | 11.1% | 2.6%(+8.50)#71 | 3.9%(+7.20)#2,301 |
| 72. | Hanlontown | 11.1% | 2.6%(+8.50)#72 | 3.9%(+7.20)#2,304 |
| 73. | Martensdale | 11.0% | 2.6%(+8.40)#73 | 3.9%(+7.10)#2,328 |
| 74. | Carter Lake | 10.9% | 2.6%(+8.30)#74 | 3.9%(+7.00)#2,337 |
| 75. | Janesville | 10.7% | 2.6%(+8.10)#75 | 3.9%(+6.80)#2,382 |
| 76. | Anthon | 10.7% | 2.6%(+8.10)#76 | 3.9%(+6.80)#2,383 |
| 77. | Decorah | 10.6% | 2.6%(+8.00)#77 | 3.9%(+6.70)#2,389 |
| 78. | Merrill | 10.5% | 2.6%(+7.90)#78 | 3.9%(+6.60)#2,423 |
| 79. | Mount Pleasant | 10.0% | 2.6%(+7.40)#79 | 3.9%(+6.10)#2,535 |
| 80. | Shueyville | 10.0% | 2.6%(+7.40)#80 | 3.9%(+6.10)#2,553 |
| 81. | Lowden | 10.0% | 2.6%(+7.40)#81 | 3.9%(+6.10)#2,554 |
| 82. | Neola | 9.9% | 2.6%(+7.30)#82 | 3.9%(+6.00)#2,581 |
| 83. | Davis City | 9.9% | 2.6%(+7.30)#83 | 3.9%(+6.00)#2,588 |
| 84. | Soldier | 9.9% | 2.6%(+7.30)#84 | 3.9%(+6.00)#2,589 |
| 85. | Sheldon | 9.7% | 2.6%(+7.10)#85 | 3.9%(+5.80)#2,631 |
| 86. | Shenandoah | 9.7% | 2.6%(+7.10)#86 | 3.9%(+5.80)#2,632 |
| 87. | Dakota City | 9.5% | 2.6%(+6.90)#87 | 3.9%(+5.60)#2,700 |
| 88. | Stuart | 9.2% | 2.6%(+6.60)#88 | 3.9%(+5.30)#2,799 |
| 89. | Auburn | 9.0% | 2.6%(+6.40)#89 | 3.9%(+5.10)#2,881 |
| 90. | Traer | 8.8% | 2.6%(+6.20)#90 | 3.9%(+4.90)#2,932 |
| 91. | Hiawatha | 8.6% | 2.6%(+6.00)#91 | 3.9%(+4.70)#2,976 |
| 92. | Manilla | 8.6% | 2.6%(+6.00)#92 | 3.9%(+4.70)#2,994 |
| 93. | Roland | 8.5% | 2.6%(+5.90)#93 | 3.9%(+4.60)#3,027 |
| 94. | Kellogg | 8.3% | 2.6%(+5.70)#94 | 3.9%(+4.40)#3,099 |
| 95. | Laurel | 8.3% | 2.6%(+5.70)#95 | 3.9%(+4.40)#3,112 |
| 96. | Laurens | 8.0% | 2.6%(+5.40)#96 | 3.9%(+4.10)#3,205 |
| 97. | Eldora | 7.9% | 2.6%(+5.30)#97 | 3.9%(+4.00)#3,237 |
| 98. | De Soto | 7.6% | 2.6%(+5.00)#98 | 3.9%(+3.70)#3,355 |
| 99. | Moorhead | 7.6% | 2.6%(+5.00)#99 | 3.9%(+3.70)#3,365 |
| 100. | Iowa Falls | 7.5% | 2.6%(+4.90)#100 | 3.9%(+3.60)#3,388 |
Common Questions
What are the Top 10 Cities with the Highest Unemployment Rate Amomg Seniors Over the Age of 65 in Iowa?
Top 10 Cities with the Highest Unemployment Rate Amomg Seniors Over the Age of 65 in Iowa are:
#1
100.0%
#2
99.2%
#3
80.2%
#4
66.6%
#5
66.6%
#6
61.8%
#7
49.9%
#8
45.4%
#9
44.9%
#10
40.0%
What city has the Highest Unemployment Rate Amomg Seniors Over the Age of 65 in Iowa?
Luzerne has the Highest Unemployment Rate Amomg Seniors Over the Age of 65 in Iowa with 100.0%.
What is the Unemployment Rate Amomg Seniors Over the Age of 65 in the State of Iowa?
Unemployment Rate Amomg Seniors Over the Age of 65 in Iowa is 2.6%.
What is the Unemployment Rate Amomg Seniors Over the Age of 65 in the United States?
Unemployment Rate Amomg Seniors Over the Age of 65 in the United States is 3.9%.