Cities with the Highest Unemployment Rate Amomg Seniors Over the Age of 65 in South Carolina
RELATED REPORTS & OPTIONS
Highest Unemployment | Senior > 65
South Carolina
Compare Cities
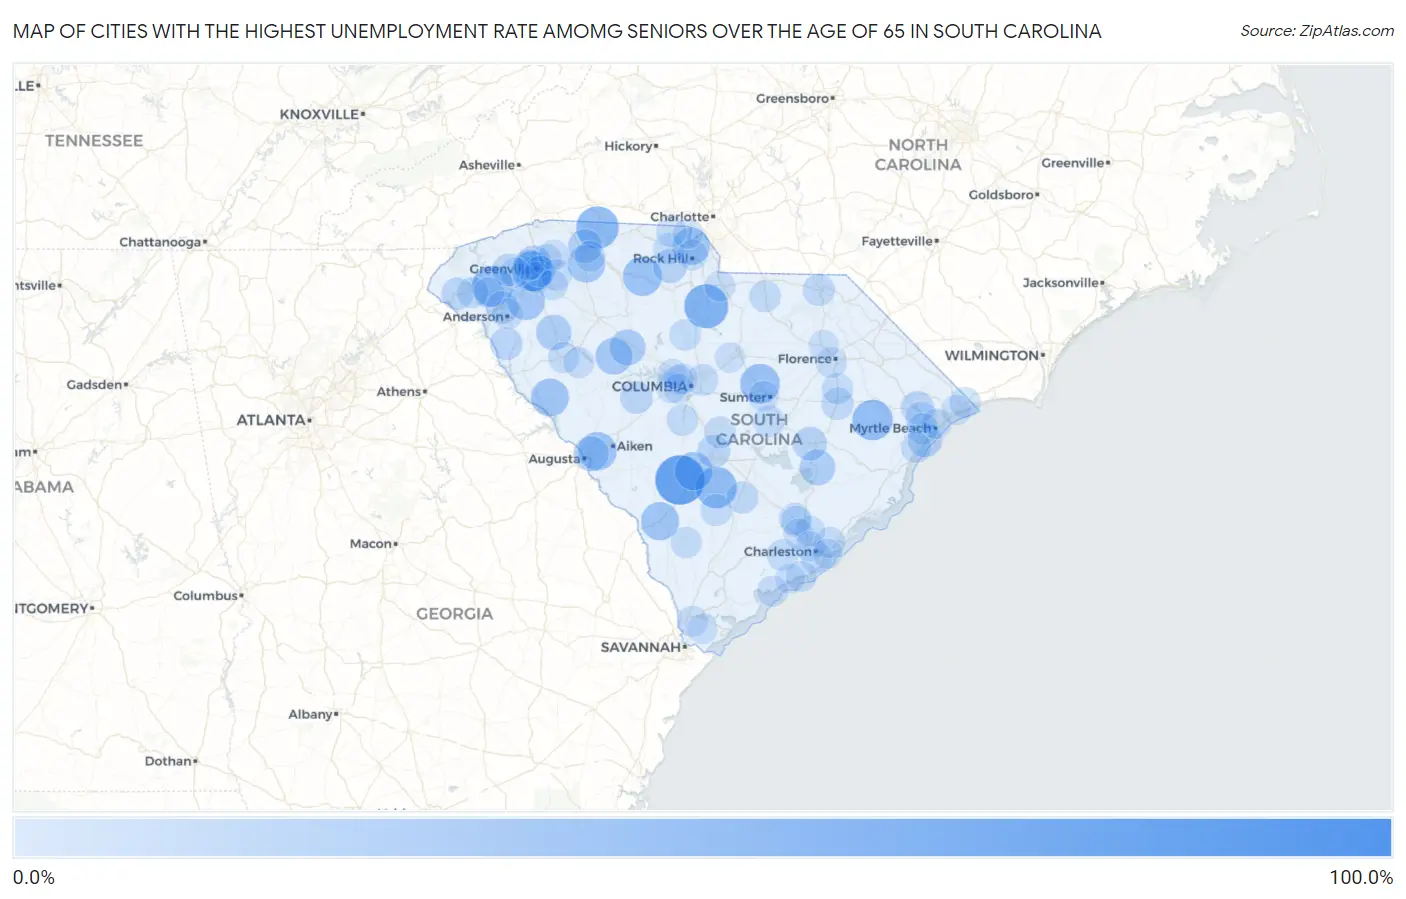
Map of Cities with the Highest Unemployment Rate Amomg Seniors Over the Age of 65 in South Carolina
0.0%
100.0%
Cities with the Highest Unemployment Rate Amomg Seniors Over the Age of 65 in South Carolina
| City | Senior Unemployment | vs State | vs National | |
| 1. | Grover | 100.0% | 3.3%(+96.7)#1 | 3.9%(+96.1)#38 |
| 2. | Denmark | 79.3% | 3.3%(+76.0)#2 | 3.9%(+75.4)#144 |
| 3. | White Knoll | 75.3% | 3.3%(+72.0)#3 | 3.9%(+71.4)#157 |
| 4. | Great Falls | 56.7% | 3.3%(+53.4)#4 | 3.9%(+52.8)#240 |
| 5. | Chesnee | 50.0% | 3.3%(+46.7)#5 | 3.9%(+46.1)#272 |
| 6. | Branchville | 45.9% | 3.3%(+42.6)#6 | 3.9%(+42.0)#337 |
| 7. | Central | 44.0% | 3.3%(+40.7)#7 | 3.9%(+40.1)#356 |
| 8. | Hemingway | 42.7% | 3.3%(+39.4)#8 | 3.9%(+38.8)#376 |
| 9. | Judson | 41.7% | 3.3%(+38.4)#9 | 3.9%(+37.8)#386 |
| 10. | Dalzell | 39.3% | 3.3%(+36.0)#10 | 3.9%(+35.4)#437 |
| 11. | Lockhart | 37.3% | 3.3%(+34.0)#11 | 3.9%(+33.4)#471 |
| 12. | Beech Island | 36.6% | 3.3%(+33.3)#12 | 3.9%(+32.7)#484 |
| 13. | Burnettown | 34.5% | 3.3%(+31.2)#13 | 3.9%(+30.6)#522 |
| 14. | Allendale | 33.7% | 3.3%(+30.4)#14 | 3.9%(+29.8)#539 |
| 15. | Cope | 33.3% | 3.3%(+30.0)#15 | 3.9%(+29.4)#589 |
| 16. | Mccormick | 32.3% | 3.3%(+29.0)#16 | 3.9%(+28.4)#607 |
| 17. | Roebuck | 31.4% | 3.3%(+28.1)#17 | 3.9%(+27.5)#635 |
| 18. | Williamston | 30.6% | 3.3%(+27.3)#18 | 3.9%(+26.7)#660 |
| 19. | India Hook | 30.2% | 3.3%(+26.9)#19 | 3.9%(+26.3)#667 |
| 20. | Silverstreet | 27.2% | 3.3%(+23.9)#20 | 3.9%(+23.3)#790 |
| 21. | Newberry | 24.7% | 3.3%(+21.4)#21 | 3.9%(+20.8)#903 |
| 22. | St Stephen | 23.0% | 3.3%(+19.7)#22 | 3.9%(+19.1)#977 |
| 23. | Ware Shoals | 22.2% | 3.3%(+18.9)#23 | 3.9%(+18.3)#1,010 |
| 24. | Clearwater | 21.3% | 3.3%(+18.0)#24 | 3.9%(+17.4)#1,075 |
| 25. | Dunean | 21.1% | 3.3%(+17.8)#25 | 3.9%(+17.2)#1,085 |
| 26. | Surfside Beach | 18.8% | 3.3%(+15.5)#26 | 3.9%(+14.9)#1,251 |
| 27. | Carolina Forest | 17.7% | 3.3%(+14.4)#27 | 3.9%(+13.8)#1,361 |
| 28. | Sans Souci | 17.4% | 3.3%(+14.1)#28 | 3.9%(+13.5)#1,388 |
| 29. | Valley Falls | 17.2% | 3.3%(+13.9)#29 | 3.9%(+13.3)#1,409 |
| 30. | Greeleyville | 16.6% | 3.3%(+13.3)#30 | 3.9%(+12.7)#1,493 |
| 31. | Mcconnells | 16.0% | 3.3%(+12.7)#31 | 3.9%(+12.1)#1,572 |
| 32. | Hilltop | 14.2% | 3.3%(+10.9)#32 | 3.9%(+10.3)#1,756 |
| 33. | Conway | 13.2% | 3.3%(+9.90)#33 | 3.9%(+9.30)#1,909 |
| 34. | Brookdale | 12.6% | 3.3%(+9.30)#34 | 3.9%(+8.70)#1,994 |
| 35. | Arial | 12.4% | 3.3%(+9.10)#35 | 3.9%(+8.50)#2,050 |
| 36. | Iva | 12.0% | 3.3%(+8.70)#36 | 3.9%(+8.10)#2,122 |
| 37. | Northlake | 11.5% | 3.3%(+8.20)#37 | 3.9%(+7.60)#2,195 |
| 38. | Batesburg Leesville | 10.7% | 3.3%(+7.40)#38 | 3.9%(+6.80)#2,368 |
| 39. | Westminster | 10.5% | 3.3%(+7.20)#39 | 3.9%(+6.60)#2,419 |
| 40. | Lake City | 10.3% | 3.3%(+7.00)#40 | 3.9%(+6.40)#2,463 |
| 41. | Cheraw | 8.9% | 3.3%(+5.60)#41 | 3.9%(+5.00)#2,902 |
| 42. | St George | 8.9% | 3.3%(+5.60)#42 | 3.9%(+5.00)#2,910 |
| 43. | Paxville | 8.6% | 3.3%(+5.30)#43 | 3.9%(+4.70)#2,998 |
| 44. | Sangaree | 8.5% | 3.3%(+5.20)#44 | 3.9%(+4.60)#3,011 |
| 45. | Jefferson | 8.5% | 3.3%(+5.20)#45 | 3.9%(+4.60)#3,030 |
| 46. | St Matthews | 8.3% | 3.3%(+5.00)#46 | 3.9%(+4.40)#3,088 |
| 47. | Smoaks | 8.3% | 3.3%(+5.00)#47 | 3.9%(+4.40)#3,113 |
| 48. | Red Hill | 7.9% | 3.3%(+4.60)#48 | 3.9%(+4.00)#3,218 |
| 49. | James Island | 7.7% | 3.3%(+4.40)#49 | 3.9%(+3.80)#3,308 |
| 50. | Columbia | 7.6% | 3.3%(+4.30)#50 | 3.9%(+3.70)#3,324 |
| 51. | Hollywood | 7.4% | 3.3%(+4.10)#51 | 3.9%(+3.50)#3,421 |
| 52. | Swansea | 7.4% | 3.3%(+4.10)#52 | 3.9%(+3.50)#3,436 |
| 53. | Winnsboro | 7.1% | 3.3%(+3.80)#53 | 3.9%(+3.20)#3,535 |
| 54. | Coward | 7.1% | 3.3%(+3.80)#54 | 3.9%(+3.20)#3,551 |
| 55. | Seneca | 6.9% | 3.3%(+3.60)#55 | 3.9%(+3.00)#3,610 |
| 56. | Socastee | 6.8% | 3.3%(+3.50)#56 | 3.9%(+2.90)#3,653 |
| 57. | York | 6.8% | 3.3%(+3.50)#57 | 3.9%(+2.90)#3,664 |
| 58. | Taylors | 6.6% | 3.3%(+3.30)#58 | 3.9%(+2.70)#3,735 |
| 59. | Five Forks | 6.5% | 3.3%(+3.20)#59 | 3.9%(+2.60)#3,807 |
| 60. | Greenwood | 6.2% | 3.3%(+2.90)#60 | 3.9%(+2.30)#3,959 |
| 61. | Varnville | 6.2% | 3.3%(+2.90)#61 | 3.9%(+2.30)#3,989 |
| 62. | Mount Pleasant | 6.0% | 3.3%(+2.70)#62 | 3.9%(+2.10)#4,061 |
| 63. | Gantt | 5.9% | 3.3%(+2.60)#63 | 3.9%(+2.00)#4,134 |
| 64. | Little River | 5.7% | 3.3%(+2.40)#64 | 3.9%(+1.80)#4,243 |
| 65. | Greenville | 5.3% | 3.3%(+2.00)#65 | 3.9%(+1.40)#4,432 |
| 66. | Anderson | 5.3% | 3.3%(+2.00)#66 | 3.9%(+1.40)#4,448 |
| 67. | Florence | 5.1% | 3.3%(+1.80)#67 | 3.9%(+1.20)#4,567 |
| 68. | Berea | 5.1% | 3.3%(+1.80)#68 | 3.9%(+1.20)#4,582 |
| 69. | Ninety Six | 5.1% | 3.3%(+1.80)#69 | 3.9%(+1.20)#4,607 |
| 70. | Clover | 4.8% | 3.3%(+1.50)#70 | 3.9%(+0.900)#4,776 |
| 71. | Edisto Beach | 4.7% | 3.3%(+1.40)#71 | 3.9%(+0.800)#4,869 |
| 72. | Lexington | 4.6% | 3.3%(+1.30)#72 | 3.9%(+0.700)#4,905 |
| 73. | Spartanburg | 4.5% | 3.3%(+1.20)#73 | 3.9%(+0.600)#4,978 |
| 74. | Hanahan | 4.4% | 3.3%(+1.10)#74 | 3.9%(+0.500)#5,062 |
| 75. | Ladson | 4.4% | 3.3%(+1.10)#75 | 3.9%(+0.500)#5,065 |
| 76. | Hardeeville | 4.4% | 3.3%(+1.10)#76 | 3.9%(+0.500)#5,086 |
| 77. | Kiawah Island | 4.4% | 3.3%(+1.10)#77 | 3.9%(+0.500)#5,105 |
| 78. | Lancaster | 4.3% | 3.3%(+1.000)#78 | 3.9%(+0.400)#5,154 |
| 79. | Rock Hill | 4.1% | 3.3%(+0.800)#79 | 3.9%(+0.200)#5,265 |
| 80. | Clemson | 4.1% | 3.3%(+0.800)#80 | 3.9%(+0.200)#5,285 |
| 81. | Murrells Inlet | 4.0% | 3.3%(+0.700)#81 | 3.9%(+0.100)#5,381 |
| 82. | North Charleston | 3.8% | 3.3%(+0.500)#82 | 3.9%(-0.100)#5,503 |
| 83. | Simpsonville | 3.7% | 3.3%(+0.400)#83 | 3.9%(-0.200)#5,602 |
| 84. | Sumter | 3.3% | 3.3%(=0.000)#84 | 3.9%(-0.600)#5,877 |
| 85. | Wyboo | 3.2% | 3.3%(-0.100)#85 | 3.9%(-0.700)#6,009 |
| 86. | Greer | 3.1% | 3.3%(-0.200)#86 | 3.9%(-0.800)#6,051 |
| 87. | St Andrews | 3.1% | 3.3%(-0.200)#87 | 3.9%(-0.800)#6,061 |
| 88. | Lugoff | 3.0% | 3.3%(-0.300)#88 | 3.9%(-0.900)#6,168 |
| 89. | Myrtle Beach | 2.7% | 3.3%(-0.600)#89 | 3.9%(-1.20)#6,375 |
| 90. | Lake Wylie | 2.5% | 3.3%(-0.800)#90 | 3.9%(-1.40)#6,534 |
| 91. | Seven Oaks | 2.4% | 3.3%(-0.900)#91 | 3.9%(-1.50)#6,617 |
| 92. | Darlington | 2.4% | 3.3%(-0.900)#92 | 3.9%(-1.50)#6,641 |
| 93. | Bluffton | 2.3% | 3.3%(-1.00)#93 | 3.9%(-1.60)#6,672 |
| 94. | Charleston | 2.2% | 3.3%(-1.10)#94 | 3.9%(-1.70)#6,718 |
| 95. | North Myrtle Beach | 2.2% | 3.3%(-1.10)#95 | 3.9%(-1.70)#6,755 |
| 96. | Oak Grove | 2.0% | 3.3%(-1.30)#96 | 3.9%(-1.90)#6,897 |
| 97. | Irmo | 1.9% | 3.3%(-1.40)#97 | 3.9%(-2.00)#6,951 |
| 98. | Sullivan S Island | 1.9% | 3.3%(-1.40)#98 | 3.9%(-2.00)#6,972 |
| 99. | Seabrook Island | 1.7% | 3.3%(-1.60)#99 | 3.9%(-2.20)#7,096 |
| 100. | Easley | 1.4% | 3.3%(-1.90)#100 | 3.9%(-2.50)#7,226 |
Common Questions
What are the Top 10 Cities with the Highest Unemployment Rate Amomg Seniors Over the Age of 65 in South Carolina?
Top 10 Cities with the Highest Unemployment Rate Amomg Seniors Over the Age of 65 in South Carolina are:
#1
79.3%
#2
56.7%
#3
50.0%
#4
45.9%
#5
44.0%
#6
42.7%
#7
41.7%
#8
39.3%
#9
37.3%
#10
34.5%
What city has the Highest Unemployment Rate Amomg Seniors Over the Age of 65 in South Carolina?
Denmark has the Highest Unemployment Rate Amomg Seniors Over the Age of 65 in South Carolina with 79.3%.
What is the Unemployment Rate Amomg Seniors Over the Age of 65 in the State of South Carolina?
Unemployment Rate Amomg Seniors Over the Age of 65 in South Carolina is 3.3%.
What is the Unemployment Rate Amomg Seniors Over the Age of 65 in the United States?
Unemployment Rate Amomg Seniors Over the Age of 65 in the United States is 3.9%.