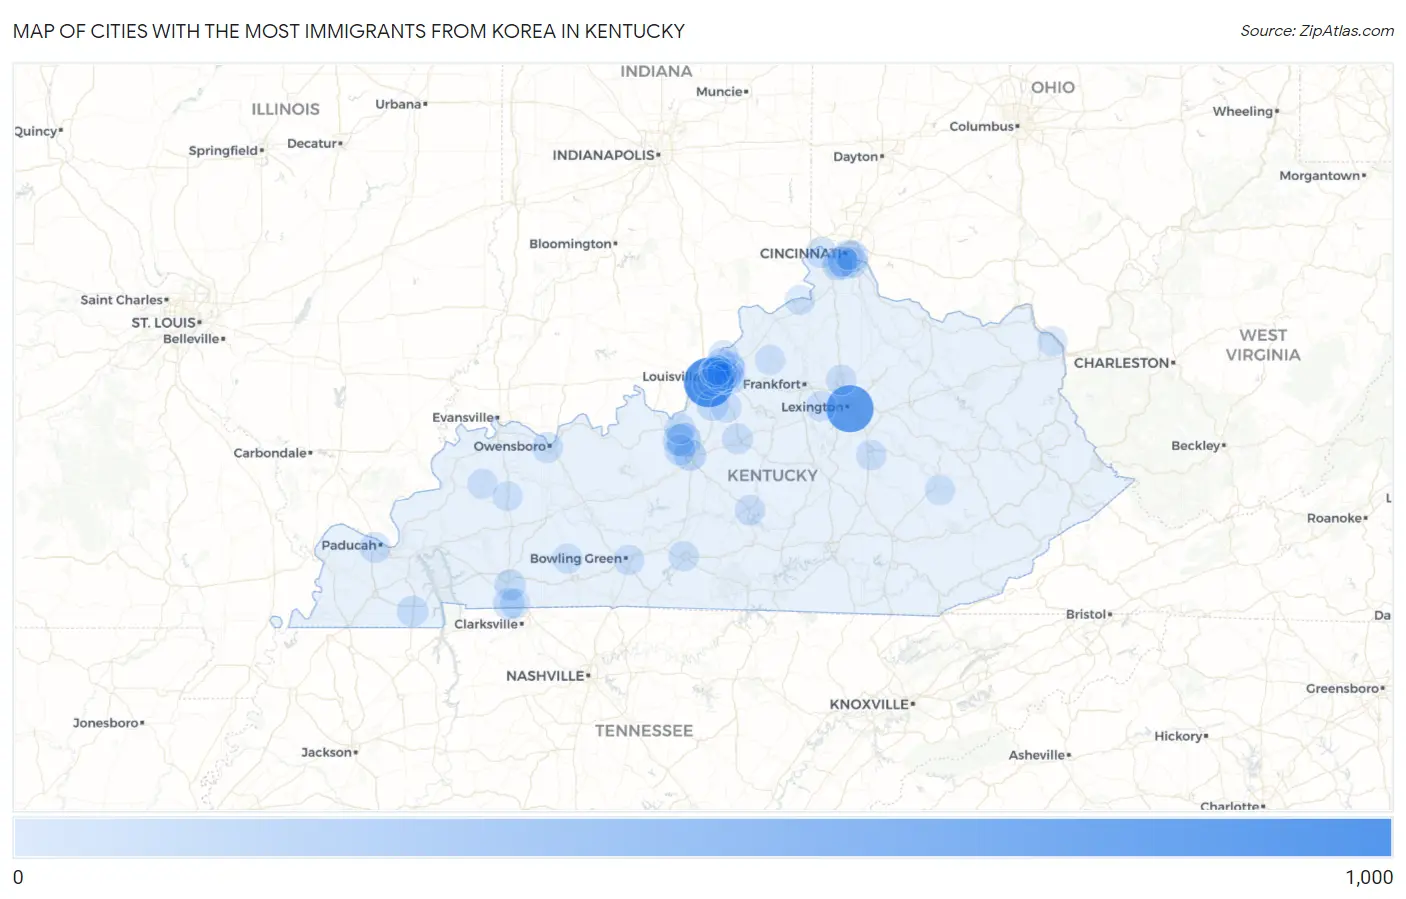
Cities with the Most Immigrants from Korea in Kentucky
RELATED REPORTS & OPTIONS
Korea
Kentucky
Compare Cities
Map of Cities with the Most Immigrants from Korea in Kentucky
0
1,000
Cities with the Most Immigrants from Korea in Kentucky
| City | Korea | vs State | vs National | |
| 1. | Louisville | 814 | 3,585(22.71%)#1 | 1,034,299(0.08%)#187 |
| 2. | Lexington | 712 | 3,585(19.86%)#2 | 1,034,299(0.07%)#221 |
| 3. | Radcliff | 165 | 3,585(4.60%)#3 | 1,034,299(0.02%)#872 |
| 4. | Elizabethtown | 77 | 3,585(2.15%)#4 | 1,034,299(0.01%)#1,495 |
| 5. | Vine Grove | 72 | 3,585(2.01%)#5 | 1,034,299(0.01%)#1,565 |
| 6. | Hillview | 60 | 3,585(1.67%)#6 | 1,034,299(0.01%)#1,736 |
| 7. | St Matthews | 56 | 3,585(1.56%)#7 | 1,034,299(0.01%)#1,803 |
| 8. | Middletown | 56 | 3,585(1.56%)#8 | 1,034,299(0.01%)#1,808 |
| 9. | Fort Thomas | 55 | 3,585(1.53%)#9 | 1,034,299(0.01%)#1,827 |
| 10. | Fort Campbell North | 49 | 3,585(1.37%)#10 | 1,034,299(0.00%)#1,949 |
| 11. | Murray | 46 | 3,585(1.28%)#11 | 1,034,299(0.00%)#2,012 |
| 12. | Hopkinsville | 43 | 3,585(1.20%)#12 | 1,034,299(0.00%)#2,081 |
| 13. | Lakeside Park | 43 | 3,585(1.20%)#13 | 1,034,299(0.00%)#2,098 |
| 14. | Lyndon | 40 | 3,585(1.12%)#14 | 1,034,299(0.00%)#2,179 |
| 15. | Rineyville | 40 | 3,585(1.12%)#15 | 1,034,299(0.00%)#2,187 |
| 16. | Covington | 36 | 3,585(1.00%)#16 | 1,034,299(0.00%)#2,288 |
| 17. | Francisville | 36 | 3,585(1.00%)#17 | 1,034,299(0.00%)#2,300 |
| 18. | Erlanger | 33 | 3,585(0.92%)#18 | 1,034,299(0.00%)#2,392 |
| 19. | Fort Knox | 33 | 3,585(0.92%)#19 | 1,034,299(0.00%)#2,409 |
| 20. | Paducah | 32 | 3,585(0.89%)#20 | 1,034,299(0.00%)#2,429 |
| 21. | Bardstown | 30 | 3,585(0.84%)#21 | 1,034,299(0.00%)#2,533 |
| 22. | Highland Heights | 29 | 3,585(0.81%)#22 | 1,034,299(0.00%)#2,581 |
| 23. | Owensboro | 27 | 3,585(0.75%)#23 | 1,034,299(0.00%)#2,644 |
| 24. | Fort Wright | 22 | 3,585(0.61%)#24 | 1,034,299(0.00%)#2,942 |
| 25. | Bowling Green | 17 | 3,585(0.47%)#25 | 1,034,299(0.00%)#3,247 |
| 26. | Versailles | 16 | 3,585(0.45%)#26 | 1,034,299(0.00%)#3,361 |
| 27. | Georgetown | 15 | 3,585(0.42%)#27 | 1,034,299(0.00%)#3,414 |
| 28. | Indian Hills | 15 | 3,585(0.42%)#28 | 1,034,299(0.00%)#3,473 |
| 29. | Mount Washington | 13 | 3,585(0.36%)#29 | 1,034,299(0.00%)#3,616 |
| 30. | Oak Grove | 12 | 3,585(0.33%)#30 | 1,034,299(0.00%)#3,762 |
| 31. | Orchard Grass Hills | 12 | 3,585(0.33%)#31 | 1,034,299(0.00%)#3,808 |
| 32. | Northfield | 12 | 3,585(0.33%)#32 | 1,034,299(0.00%)#3,815 |
| 33. | Worthington Hills | 11 | 3,585(0.31%)#33 | 1,034,299(0.00%)#3,909 |
| 34. | Richmond | 10 | 3,585(0.28%)#34 | 1,034,299(0.00%)#3,937 |
| 35. | Glasgow | 10 | 3,585(0.28%)#35 | 1,034,299(0.00%)#3,960 |
| 36. | Campbellsville | 10 | 3,585(0.28%)#36 | 1,034,299(0.00%)#3,971 |
| 37. | Lewisburg | 10 | 3,585(0.28%)#37 | 1,034,299(0.00%)#4,039 |
| 38. | Blue Ridge Manor | 9 | 3,585(0.25%)#38 | 1,034,299(0.00%)#4,167 |
| 39. | Prospect | 8 | 3,585(0.22%)#39 | 1,034,299(0.00%)#4,243 |
| 40. | Glenview | 8 | 3,585(0.22%)#40 | 1,034,299(0.00%)#4,304 |
| 41. | Newport | 7 | 3,585(0.20%)#41 | 1,034,299(0.00%)#4,331 |
| 42. | Hurstbourne | 7 | 3,585(0.20%)#42 | 1,034,299(0.00%)#4,371 |
| 43. | Warsaw | 6 | 3,585(0.17%)#43 | 1,034,299(0.00%)#4,527 |
| 44. | Booneville | 6 | 3,585(0.17%)#44 | 1,034,299(0.00%)#4,577 |
| 45. | Dixon | 5 | 3,585(0.14%)#45 | 1,034,299(0.00%)#4,689 |
| 46. | Audubon Park | 4 | 3,585(0.11%)#46 | 1,034,299(0.00%)#4,808 |
| 47. | Hanson | 4 | 3,585(0.11%)#47 | 1,034,299(0.00%)#4,824 |
| 48. | Briarwood | 4 | 3,585(0.11%)#48 | 1,034,299(0.00%)#4,858 |
| 49. | Eminence | 3 | 3,585(0.08%)#49 | 1,034,299(0.00%)#4,909 |
| 50. | Anchorage | 3 | 3,585(0.08%)#50 | 1,034,299(0.00%)#4,915 |
| 51. | Bellefonte | 3 | 3,585(0.08%)#51 | 1,034,299(0.00%)#4,969 |
| 52. | Goshen | 2 | 3,585(0.06%)#52 | 1,034,299(0.00%)#5,135 |
| 53. | Riverwood | 2 | 3,585(0.06%)#53 | 1,034,299(0.00%)#5,175 |
| 54. | Strathmoor Manor | 2 | 3,585(0.06%)#54 | 1,034,299(0.00%)#5,178 |
| 55. | Glenview Hills | 2 | 3,585(0.06%)#55 | 1,034,299(0.00%)#5,187 |
| 56. | Norwood | 1 | 3,585(0.03%)#56 | 1,034,299(0.00%)#5,322 |
Common Questions
What are the Top 10 Cities with the Most Immigrants from Korea in Kentucky?
Top 10 Cities with the Most Immigrants from Korea in Kentucky are:
#1
814
#2
712
#3
165
#4
77
#5
72
#6
60
#7
56
#8
56
#9
55
#10
49
What city has the Most Immigrants from Korea in Kentucky?
Louisville has the Most Immigrants from Korea in Kentucky with 814.
What is the Total Immigrants from Korea in the State of Kentucky?
Total Immigrants from Korea in Kentucky is 3,585.
What is the Total Immigrants from Korea in the United States?
Total Immigrants from Korea in the United States is 1,034,299.