Cities with the Most Immigrants from Korea in Connecticut
RELATED REPORTS & OPTIONS
Korea
Connecticut
Compare Cities
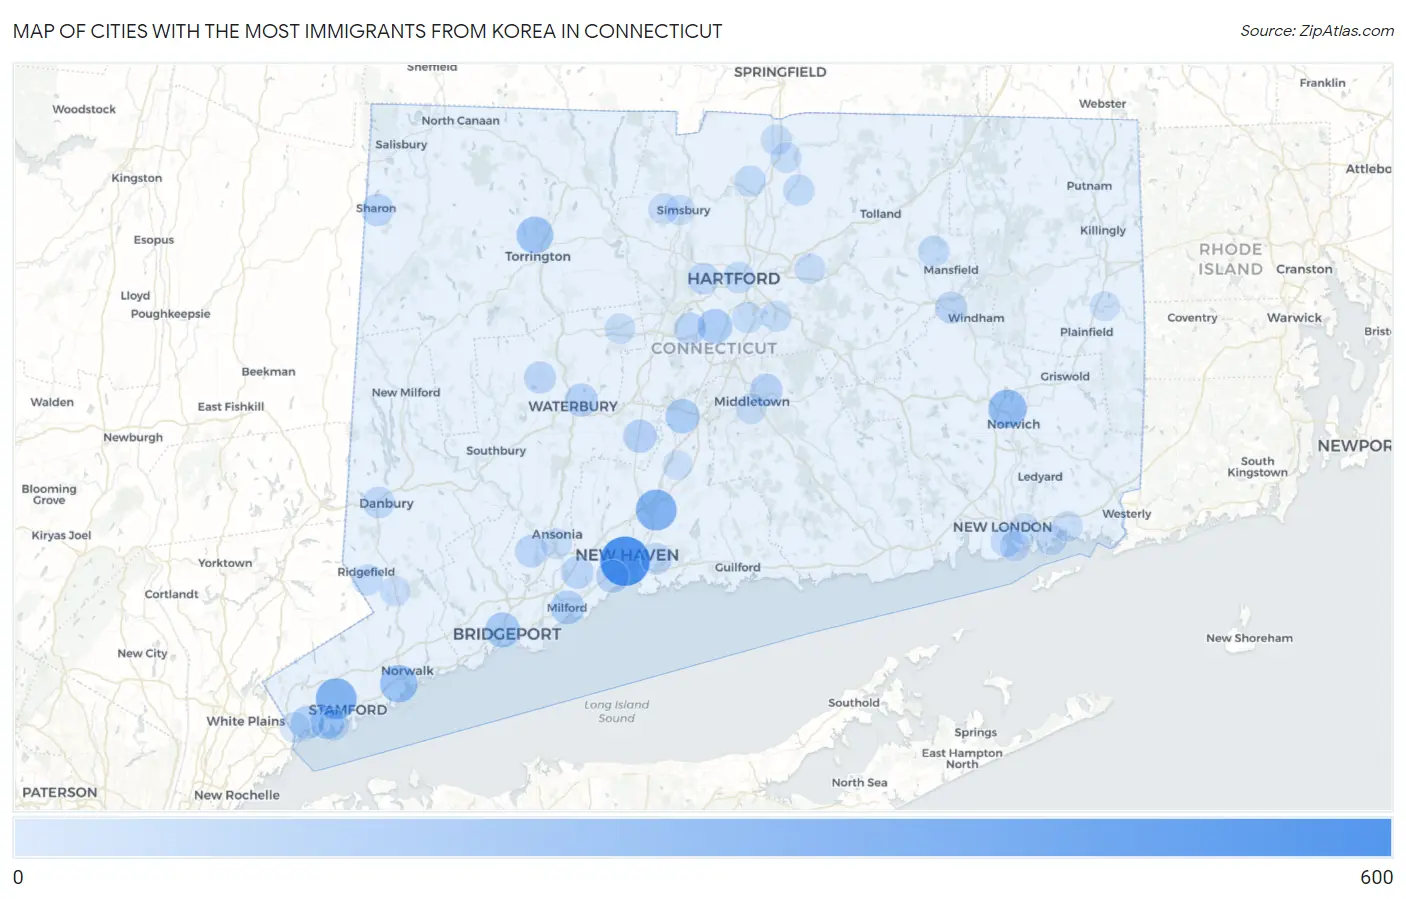
Map of Cities with the Most Immigrants from Korea in Connecticut
0
600
Cities with the Most Immigrants from Korea in Connecticut
| City | Korea | vs State | vs National | |
| 1. | New Haven | 552 | 7,495(7.36%)#1 | 1,034,299(0.05%)#286 |
| 2. | North Haven | 300 | 7,495(4.00%)#2 | 1,034,299(0.03%)#510 |
| 3. | Stamford | 299 | 7,495(3.99%)#3 | 1,034,299(0.03%)#511 |
| 4. | Norwich | 228 | 7,495(3.04%)#4 | 1,034,299(0.02%)#662 |
| 5. | Norwalk | 204 | 7,495(2.72%)#5 | 1,034,299(0.02%)#731 |
| 6. | Torrington | 184 | 7,495(2.45%)#6 | 1,034,299(0.02%)#802 |
| 7. | Bridgeport | 136 | 7,495(1.81%)#7 | 1,034,299(0.01%)#1,011 |
| 8. | Newington | 122 | 7,495(1.63%)#8 | 1,034,299(0.01%)#1,089 |
| 9. | Meriden | 116 | 7,495(1.55%)#9 | 1,034,299(0.01%)#1,137 |
| 10. | Milford City Balance | 104 | 7,495(1.39%)#10 | 1,034,299(0.01%)#1,231 |
| 11. | Riverside | 104 | 7,495(1.39%)#11 | 1,034,299(0.01%)#1,236 |
| 12. | Greenwich | 93 | 7,495(1.24%)#12 | 1,034,299(0.01%)#1,319 |
| 13. | Cheshire Village | 88 | 7,495(1.17%)#13 | 1,034,299(0.01%)#1,368 |
| 14. | Waterbury | 82 | 7,495(1.09%)#14 | 1,034,299(0.01%)#1,426 |
| 15. | West Haven | 79 | 7,495(1.05%)#15 | 1,034,299(0.01%)#1,461 |
| 16. | Portland | 69 | 7,495(0.92%)#16 | 1,034,299(0.01%)#1,612 |
| 17. | Orange | 68 | 7,495(0.91%)#17 | 1,034,299(0.01%)#1,620 |
| 18. | Shelton | 66 | 7,495(0.88%)#18 | 1,034,299(0.01%)#1,638 |
| 19. | New Britain | 63 | 7,495(0.84%)#19 | 1,034,299(0.01%)#1,681 |
| 20. | Ridgebury | 62 | 7,495(0.83%)#20 | 1,034,299(0.01%)#1,713 |
| 21. | Trumbull Center | 61 | 7,495(0.81%)#21 | 1,034,299(0.01%)#1,722 |
| 22. | Sharon | 60 | 7,495(0.80%)#22 | 1,034,299(0.01%)#1,743 |
| 23. | Watertown | 56 | 7,495(0.75%)#23 | 1,034,299(0.01%)#1,812 |
| 24. | Willimantic | 55 | 7,495(0.73%)#24 | 1,034,299(0.01%)#1,825 |
| 25. | Staples | 47 | 7,495(0.63%)#25 | 1,034,299(0.00%)#1,996 |
| 26. | East Haven | 46 | 7,495(0.61%)#26 | 1,034,299(0.00%)#2,007 |
| 27. | Danbury | 44 | 7,495(0.59%)#27 | 1,034,299(0.00%)#2,049 |
| 28. | Naugatuck Borough | 44 | 7,495(0.59%)#28 | 1,034,299(0.00%)#2,052 |
| 29. | West Hartford | 42 | 7,495(0.56%)#29 | 1,034,299(0.00%)#2,103 |
| 30. | Hartford | 37 | 7,495(0.49%)#30 | 1,034,299(0.00%)#2,249 |
| 31. | Windsor Locks | 37 | 7,495(0.49%)#31 | 1,034,299(0.00%)#2,266 |
| 32. | Noroton | 37 | 7,495(0.49%)#32 | 1,034,299(0.00%)#2,278 |
| 33. | New Canaan | 35 | 7,495(0.47%)#33 | 1,034,299(0.00%)#2,330 |
| 34. | Storrs | 34 | 7,495(0.45%)#34 | 1,034,299(0.00%)#2,355 |
| 35. | New London | 33 | 7,495(0.44%)#35 | 1,034,299(0.00%)#2,389 |
| 36. | Broad Brook | 33 | 7,495(0.44%)#36 | 1,034,299(0.00%)#2,418 |
| 37. | Wethersfield | 30 | 7,495(0.40%)#37 | 1,034,299(0.00%)#2,515 |
| 38. | Ridgefield | 27 | 7,495(0.36%)#38 | 1,034,299(0.00%)#2,674 |
| 39. | Old Greenwich | 25 | 7,495(0.33%)#39 | 1,034,299(0.00%)#2,775 |
| 40. | Daniels Farm | 24 | 7,495(0.32%)#40 | 1,034,299(0.00%)#2,825 |
| 41. | Pemberwick | 22 | 7,495(0.29%)#41 | 1,034,299(0.00%)#2,949 |
| 42. | Stratford Downtown | 22 | 7,495(0.29%)#42 | 1,034,299(0.00%)#2,953 |
| 43. | Sandy Hook | 21 | 7,495(0.28%)#43 | 1,034,299(0.00%)#2,998 |
| 44. | Glastonbury Center | 21 | 7,495(0.28%)#44 | 1,034,299(0.00%)#3,006 |
| 45. | Derby | 20 | 7,495(0.27%)#45 | 1,034,299(0.00%)#3,063 |
| 46. | Thompsonville | 20 | 7,495(0.27%)#46 | 1,034,299(0.00%)#3,073 |
| 47. | Middletown | 19 | 7,495(0.25%)#47 | 1,034,299(0.00%)#3,104 |
| 48. | Manchester | 19 | 7,495(0.25%)#48 | 1,034,299(0.00%)#3,107 |
| 49. | Long Hill | 19 | 7,495(0.25%)#49 | 1,034,299(0.00%)#3,154 |
| 50. | Westport | 19 | 7,495(0.25%)#50 | 1,034,299(0.00%)#3,164 |
| 51. | Noank | 18 | 7,495(0.24%)#51 | 1,034,299(0.00%)#3,238 |
| 52. | Bristol | 17 | 7,495(0.23%)#52 | 1,034,299(0.00%)#3,251 |
| 53. | Southwood Acres | 17 | 7,495(0.23%)#53 | 1,034,299(0.00%)#3,283 |
| 54. | West Simsbury | 15 | 7,495(0.20%)#54 | 1,034,299(0.00%)#3,474 |
| 55. | Mystic | 13 | 7,495(0.17%)#55 | 1,034,299(0.00%)#3,660 |
| 56. | Tashua | 12 | 7,495(0.16%)#56 | 1,034,299(0.00%)#3,793 |
| 57. | Coleytown | 10 | 7,495(0.13%)#57 | 1,034,299(0.00%)#4,008 |
| 58. | Simsbury Center | 7 | 7,495(0.09%)#58 | 1,034,299(0.00%)#4,362 |
| 59. | Groton | 6 | 7,495(0.08%)#59 | 1,034,299(0.00%)#4,471 |
| 60. | Georgetown | 6 | 7,495(0.08%)#60 | 1,034,299(0.00%)#4,538 |
| 61. | Sacred Heart University | 6 | 7,495(0.08%)#61 | 1,034,299(0.00%)#4,550 |
| 62. | Stonington Borough | 5 | 7,495(0.07%)#62 | 1,034,299(0.00%)#4,696 |
| 63. | Tokeneke | 4 | 7,495(0.05%)#63 | 1,034,299(0.00%)#4,775 |
| 64. | Newtown Borough | 2 | 7,495(0.03%)#64 | 1,034,299(0.00%)#5,088 |
| 65. | Wallingford Center | 1 | 7,495(0.01%)#65 | 1,034,299(0.00%)#5,217 |
| 66. | Moosup | 1 | 7,495(0.01%)#66 | 1,034,299(0.00%)#5,245 |
1
2Common Questions
What are the Top 10 Cities with the Most Immigrants from Korea in Connecticut?
Top 10 Cities with the Most Immigrants from Korea in Connecticut are:
#1
552
#2
300
#3
299
#4
228
#5
204
#6
184
#7
136
#8
122
#9
116
#10
104
What city has the Most Immigrants from Korea in Connecticut?
New Haven has the Most Immigrants from Korea in Connecticut with 552.
What is the Total Immigrants from Korea in the State of Connecticut?
Total Immigrants from Korea in Connecticut is 7,495.
What is the Total Immigrants from Korea in the United States?
Total Immigrants from Korea in the United States is 1,034,299.