Cities with the Most Immigrants from Korea in New Mexico
RELATED REPORTS & OPTIONS
Korea
New Mexico
Compare Cities
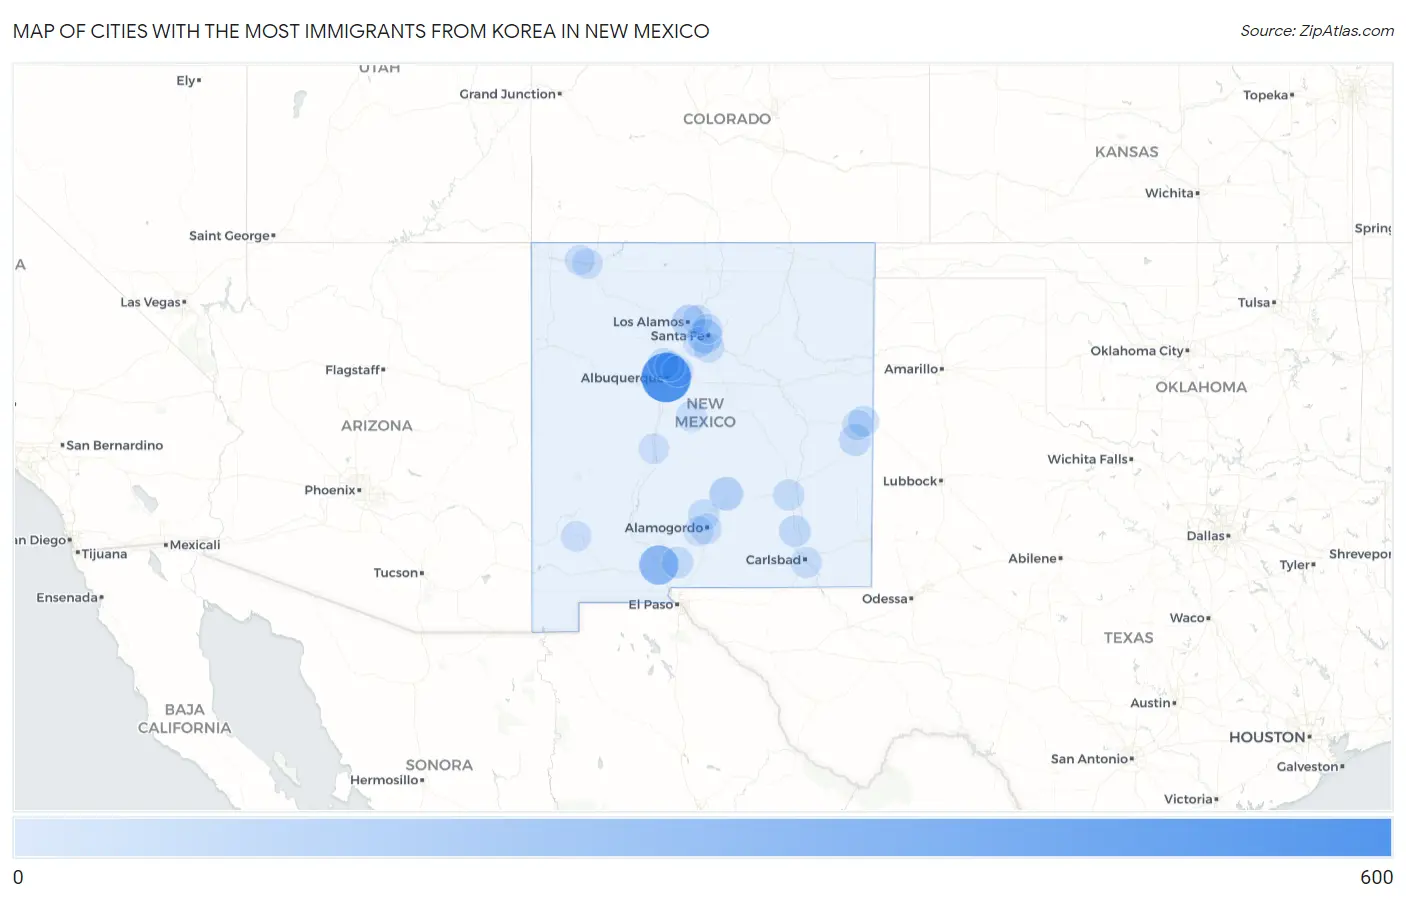
Map of Cities with the Most Immigrants from Korea in New Mexico
0
600
Cities with the Most Immigrants from Korea in New Mexico
| City | Korea | vs State | vs National | |
| 1. | Albuquerque | 536 | 1,632(32.84%)#1 | 1,034,299(0.05%)#294 |
| 2. | Las Cruces | 246 | 1,632(15.07%)#2 | 1,034,299(0.02%)#606 |
| 3. | Santa Fe | 111 | 1,632(6.80%)#3 | 1,034,299(0.01%)#1,173 |
| 4. | Ruidoso | 91 | 1,632(5.58%)#4 | 1,034,299(0.01%)#1,340 |
| 5. | Los Alamos | 82 | 1,632(5.02%)#5 | 1,034,299(0.01%)#1,434 |
| 6. | Portales | 48 | 1,632(2.94%)#6 | 1,034,299(0.00%)#1,973 |
| 7. | Artesia | 43 | 1,632(2.63%)#7 | 1,034,299(0.00%)#2,089 |
| 8. | Rio Rancho | 40 | 1,632(2.45%)#8 | 1,034,299(0.00%)#2,160 |
| 9. | White Sands | 40 | 1,632(2.45%)#9 | 1,034,299(0.00%)#2,190 |
| 10. | Picacho Hills | 35 | 1,632(2.14%)#10 | 1,034,299(0.00%)#2,339 |
| 11. | Tularosa | 34 | 1,632(2.08%)#11 | 1,034,299(0.00%)#2,378 |
| 12. | Roswell | 30 | 1,632(1.84%)#12 | 1,034,299(0.00%)#2,509 |
| 13. | Sandia Heights | 29 | 1,632(1.78%)#13 | 1,034,299(0.00%)#2,588 |
| 14. | Clovis | 23 | 1,632(1.41%)#14 | 1,034,299(0.00%)#2,852 |
| 15. | Alamogordo | 21 | 1,632(1.29%)#15 | 1,034,299(0.00%)#2,967 |
| 16. | Mountainair | 21 | 1,632(1.29%)#16 | 1,034,299(0.00%)#3,029 |
| 17. | Carlsbad | 20 | 1,632(1.23%)#17 | 1,034,299(0.00%)#3,042 |
| 18. | Eldorado At Santa Fe | 15 | 1,632(0.92%)#18 | 1,034,299(0.00%)#3,458 |
| 19. | Socorro | 11 | 1,632(0.67%)#19 | 1,034,299(0.00%)#3,864 |
| 20. | La Cienega | 11 | 1,632(0.67%)#20 | 1,034,299(0.00%)#3,895 |
| 21. | Silver City | 10 | 1,632(0.61%)#21 | 1,034,299(0.00%)#3,978 |
| 22. | Placitas Cdp Sandoval County | 10 | 1,632(0.61%)#22 | 1,034,299(0.00%)#4,002 |
| 23. | Lee Acres | 9 | 1,632(0.55%)#23 | 1,034,299(0.00%)#4,123 |
| 24. | Cannon Afb | 9 | 1,632(0.55%)#24 | 1,034,299(0.00%)#4,144 |
| 25. | Edith Enclave | 9 | 1,632(0.55%)#25 | 1,034,299(0.00%)#4,175 |
| 26. | Corrales | 7 | 1,632(0.43%)#26 | 1,034,299(0.00%)#4,349 |
| 27. | Farmington | 6 | 1,632(0.37%)#27 | 1,034,299(0.00%)#4,441 |
| 28. | San Ildefonso Pueblo | 6 | 1,632(0.37%)#28 | 1,034,299(0.00%)#4,566 |
| 29. | Peak Place | 4 | 1,632(0.25%)#29 | 1,034,299(0.00%)#4,854 |
| 30. | Holloman Afb | 1 | 1,632(0.06%)#30 | 1,034,299(0.00%)#5,240 |
Common Questions
What are the Top 10 Cities with the Most Immigrants from Korea in New Mexico?
Top 10 Cities with the Most Immigrants from Korea in New Mexico are:
#1
536
#2
246
#3
111
#4
91
#5
82
#6
48
#7
43
#8
40
#9
40
#10
34
What city has the Most Immigrants from Korea in New Mexico?
Albuquerque has the Most Immigrants from Korea in New Mexico with 536.
What is the Total Immigrants from Korea in the State of New Mexico?
Total Immigrants from Korea in New Mexico is 1,632.
What is the Total Immigrants from Korea in the United States?
Total Immigrants from Korea in the United States is 1,034,299.