Cities with the Most Immigrants from India in Maryland
RELATED REPORTS & OPTIONS
India
Maryland
Compare Cities
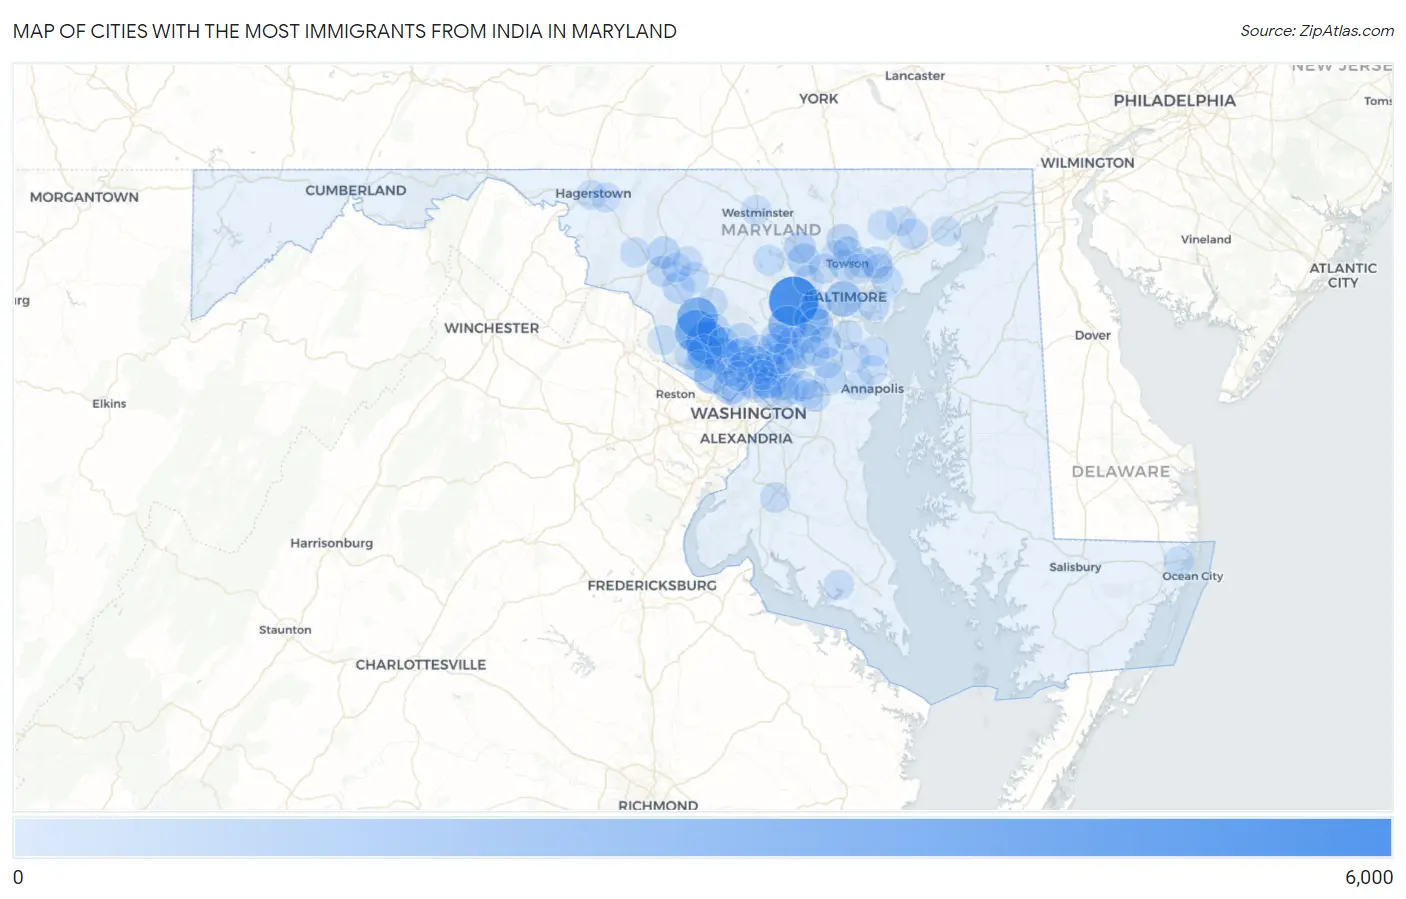
Map of Cities with the Most Immigrants from India in Maryland
0
6,000
Cities with the Most Immigrants from India in Maryland
| City | India | vs State | vs National | |
| 1. | Ellicott City | 5,603 | 61,725(9.08%)#1 | 2,732,526(0.21%)#54 |
| 2. | Gaithersburg | 3,507 | 61,725(5.68%)#2 | 2,732,526(0.13%)#100 |
| 3. | Germantown | 3,494 | 61,725(5.66%)#3 | 2,732,526(0.13%)#101 |
| 4. | Clarksburg | 3,016 | 61,725(4.89%)#4 | 2,732,526(0.11%)#130 |
| 5. | Columbia | 2,346 | 61,725(3.80%)#5 | 2,732,526(0.09%)#171 |
| 6. | Rockville | 2,240 | 61,725(3.63%)#6 | 2,732,526(0.08%)#178 |
| 7. | Baltimore | 1,747 | 61,725(2.83%)#7 | 2,732,526(0.06%)#224 |
| 8. | North Potomac | 1,563 | 61,725(2.53%)#8 | 2,732,526(0.06%)#257 |
| 9. | Potomac | 1,321 | 61,725(2.14%)#9 | 2,732,526(0.05%)#308 |
| 10. | Ilchester | 1,224 | 61,725(1.98%)#10 | 2,732,526(0.04%)#328 |
| 11. | Elkridge | 1,155 | 61,725(1.87%)#11 | 2,732,526(0.04%)#341 |
| 12. | Bethesda | 1,153 | 61,725(1.87%)#12 | 2,732,526(0.04%)#342 |
| 13. | North Laurel | 879 | 61,725(1.42%)#13 | 2,732,526(0.03%)#451 |
| 14. | Owings Mills | 866 | 61,725(1.40%)#14 | 2,732,526(0.03%)#459 |
| 15. | Montgomery Village | 857 | 61,725(1.39%)#15 | 2,732,526(0.03%)#466 |
| 16. | North Bethesda | 828 | 61,725(1.34%)#16 | 2,732,526(0.03%)#484 |
| 17. | Woodlawn Cdp Baltimore County | 768 | 61,725(1.24%)#17 | 2,732,526(0.03%)#524 |
| 18. | Fairland | 758 | 61,725(1.23%)#18 | 2,732,526(0.03%)#531 |
| 19. | Silver Spring | 746 | 61,725(1.21%)#19 | 2,732,526(0.03%)#540 |
| 20. | Greenbelt | 730 | 61,725(1.18%)#20 | 2,732,526(0.03%)#559 |
| 21. | College Park | 683 | 61,725(1.11%)#21 | 2,732,526(0.02%)#597 |
| 22. | Frederick | 681 | 61,725(1.10%)#22 | 2,732,526(0.02%)#601 |
| 23. | Cockeysville | 666 | 61,725(1.08%)#23 | 2,732,526(0.02%)#613 |
| 24. | Urbana | 662 | 61,725(1.07%)#24 | 2,732,526(0.02%)#620 |
| 25. | Severn | 642 | 61,725(1.04%)#25 | 2,732,526(0.02%)#630 |
| 26. | Burtonsville | 619 | 61,725(1.00%)#26 | 2,732,526(0.02%)#658 |
| 27. | Perry Hall | 595 | 61,725(0.96%)#27 | 2,732,526(0.02%)#677 |
| 28. | Olney | 576 | 61,725(0.93%)#28 | 2,732,526(0.02%)#693 |
| 29. | Reisterstown | 555 | 61,725(0.90%)#29 | 2,732,526(0.02%)#713 |
| 30. | Dundalk | 504 | 61,725(0.82%)#30 | 2,732,526(0.02%)#770 |
| 31. | Calverton | 501 | 61,725(0.81%)#31 | 2,732,526(0.02%)#774 |
| 32. | Travilah | 498 | 61,725(0.81%)#32 | 2,732,526(0.02%)#776 |
| 33. | Crofton | 451 | 61,725(0.73%)#33 | 2,732,526(0.02%)#824 |
| 34. | Laurel | 450 | 61,725(0.73%)#34 | 2,732,526(0.02%)#825 |
| 35. | Aspen Hill | 449 | 61,725(0.73%)#35 | 2,732,526(0.02%)#826 |
| 36. | Scaggsville | 427 | 61,725(0.69%)#36 | 2,732,526(0.02%)#863 |
| 37. | Ballenger Creek | 422 | 61,725(0.68%)#37 | 2,732,526(0.02%)#869 |
| 38. | Odenton | 405 | 61,725(0.66%)#38 | 2,732,526(0.01%)#889 |
| 39. | Adelphi | 379 | 61,725(0.61%)#39 | 2,732,526(0.01%)#933 |
| 40. | Towson | 368 | 61,725(0.60%)#40 | 2,732,526(0.01%)#950 |
| 41. | Catonsville | 364 | 61,725(0.59%)#41 | 2,732,526(0.01%)#958 |
| 42. | Bel Air South | 362 | 61,725(0.59%)#42 | 2,732,526(0.01%)#964 |
| 43. | South Laurel | 321 | 61,725(0.52%)#43 | 2,732,526(0.01%)#1,070 |
| 44. | Seabrook | 314 | 61,725(0.51%)#44 | 2,732,526(0.01%)#1,093 |
| 45. | Bowie | 307 | 61,725(0.50%)#45 | 2,732,526(0.01%)#1,103 |
| 46. | Monrovia | 291 | 61,725(0.47%)#46 | 2,732,526(0.01%)#1,148 |
| 47. | Cloverly | 282 | 61,725(0.46%)#47 | 2,732,526(0.01%)#1,173 |
| 48. | Eldersburg | 277 | 61,725(0.45%)#48 | 2,732,526(0.01%)#1,189 |
| 49. | Darnestown | 270 | 61,725(0.44%)#49 | 2,732,526(0.01%)#1,209 |
| 50. | Glenmont | 264 | 61,725(0.43%)#50 | 2,732,526(0.01%)#1,220 |
| 51. | Redland | 248 | 61,725(0.40%)#51 | 2,732,526(0.01%)#1,263 |
| 52. | Middle River | 246 | 61,725(0.40%)#52 | 2,732,526(0.01%)#1,271 |
| 53. | Colesville | 228 | 61,725(0.37%)#53 | 2,732,526(0.01%)#1,341 |
| 54. | Glenn Dale | 225 | 61,725(0.36%)#54 | 2,732,526(0.01%)#1,354 |
| 55. | Kemp Mill | 221 | 61,725(0.36%)#55 | 2,732,526(0.01%)#1,365 |
| 56. | Beltsville | 202 | 61,725(0.33%)#56 | 2,732,526(0.01%)#1,437 |
| 57. | Carney | 187 | 61,725(0.30%)#57 | 2,732,526(0.01%)#1,493 |
| 58. | White Oak | 183 | 61,725(0.30%)#58 | 2,732,526(0.01%)#1,518 |
| 59. | Wheaton | 182 | 61,725(0.29%)#59 | 2,732,526(0.01%)#1,523 |
| 60. | Maryland City | 166 | 61,725(0.27%)#60 | 2,732,526(0.01%)#1,618 |
| 61. | Jessup | 153 | 61,725(0.25%)#61 | 2,732,526(0.01%)#1,704 |
| 62. | Waldorf | 151 | 61,725(0.24%)#62 | 2,732,526(0.01%)#1,716 |
| 63. | Hyattsville | 151 | 61,725(0.24%)#63 | 2,732,526(0.01%)#1,718 |
| 64. | Middletown | 150 | 61,725(0.24%)#64 | 2,732,526(0.01%)#1,734 |
| 65. | Takoma Park | 138 | 61,725(0.22%)#65 | 2,732,526(0.01%)#1,803 |
| 66. | Parole | 136 | 61,725(0.22%)#66 | 2,732,526(0.00%)#1,819 |
| 67. | Damascus | 133 | 61,725(0.22%)#67 | 2,732,526(0.00%)#1,842 |
| 68. | Mays Chapel | 129 | 61,725(0.21%)#68 | 2,732,526(0.00%)#1,875 |
| 69. | Leonardtown | 129 | 61,725(0.21%)#69 | 2,732,526(0.00%)#1,878 |
| 70. | Bartonsville | 128 | 61,725(0.21%)#70 | 2,732,526(0.00%)#1,887 |
| 71. | Honeygo | 127 | 61,725(0.21%)#71 | 2,732,526(0.00%)#1,895 |
| 72. | Severna Park | 125 | 61,725(0.20%)#72 | 2,732,526(0.00%)#1,908 |
| 73. | Timonium | 125 | 61,725(0.20%)#73 | 2,732,526(0.00%)#1,912 |
| 74. | Hagerstown | 123 | 61,725(0.20%)#74 | 2,732,526(0.00%)#1,922 |
| 75. | Konterra | 121 | 61,725(0.20%)#75 | 2,732,526(0.00%)#1,948 |
| 76. | Fulton | 119 | 61,725(0.19%)#76 | 2,732,526(0.00%)#1,970 |
| 77. | New Carrollton | 115 | 61,725(0.19%)#77 | 2,732,526(0.00%)#2,000 |
| 78. | Ocean Pines | 115 | 61,725(0.19%)#78 | 2,732,526(0.00%)#2,001 |
| 79. | Hillandale | 110 | 61,725(0.18%)#79 | 2,732,526(0.00%)#2,043 |
| 80. | Fairwood | 109 | 61,725(0.18%)#80 | 2,732,526(0.00%)#2,047 |
| 81. | Westminster | 107 | 61,725(0.17%)#81 | 2,732,526(0.00%)#2,056 |
| 82. | White Marsh | 107 | 61,725(0.17%)#82 | 2,732,526(0.00%)#2,059 |
| 83. | Friendship Heights Village | 101 | 61,725(0.16%)#83 | 2,732,526(0.00%)#2,130 |
| 84. | Pikesville | 98 | 61,725(0.16%)#84 | 2,732,526(0.00%)#2,157 |
| 85. | Lake Shore | 98 | 61,725(0.16%)#85 | 2,732,526(0.00%)#2,162 |
| 86. | Aberdeen | 98 | 61,725(0.16%)#86 | 2,732,526(0.00%)#2,163 |
| 87. | Robinwood | 97 | 61,725(0.16%)#87 | 2,732,526(0.00%)#2,176 |
| 88. | Milford Mill | 96 | 61,725(0.16%)#88 | 2,732,526(0.00%)#2,182 |
| 89. | Arnold | 95 | 61,725(0.15%)#89 | 2,732,526(0.00%)#2,194 |
| 90. | Bel Air North | 91 | 61,725(0.15%)#90 | 2,732,526(0.00%)#2,237 |
| 91. | Poolesville | 91 | 61,725(0.15%)#91 | 2,732,526(0.00%)#2,245 |
| 92. | Glen Burnie | 88 | 61,725(0.14%)#92 | 2,732,526(0.00%)#2,281 |
| 93. | Linganore | 81 | 61,725(0.13%)#93 | 2,732,526(0.00%)#2,378 |
| 94. | Fallston | 81 | 61,725(0.13%)#94 | 2,732,526(0.00%)#2,379 |
| 95. | Flower Hill | 75 | 61,725(0.12%)#95 | 2,732,526(0.00%)#2,474 |
| 96. | South Kensington | 74 | 61,725(0.12%)#96 | 2,732,526(0.00%)#2,490 |
| 97. | Fort Meade | 72 | 61,725(0.12%)#97 | 2,732,526(0.00%)#2,509 |
| 98. | Green Valley | 71 | 61,725(0.12%)#98 | 2,732,526(0.00%)#2,523 |
| 99. | Leisure World | 67 | 61,725(0.11%)#99 | 2,732,526(0.00%)#2,588 |
| 100. | Parkville | 66 | 61,725(0.11%)#100 | 2,732,526(0.00%)#2,601 |
Common Questions
What are the Top 10 Cities with the Most Immigrants from India in Maryland?
Top 10 Cities with the Most Immigrants from India in Maryland are:
#1
5,603
#2
3,507
#3
3,494
#4
3,016
#5
2,346
#6
2,240
#7
1,747
#8
1,563
#9
1,321
#10
1,224
What city has the Most Immigrants from India in Maryland?
Ellicott City has the Most Immigrants from India in Maryland with 5,603.
What is the Total Immigrants from India in the State of Maryland?
Total Immigrants from India in Maryland is 61,725.
What is the Total Immigrants from India in the United States?
Total Immigrants from India in the United States is 2,732,526.