Cities with the Most Immigrants from Chile in Colorado
RELATED REPORTS & OPTIONS
Chile
Colorado
Compare Cities
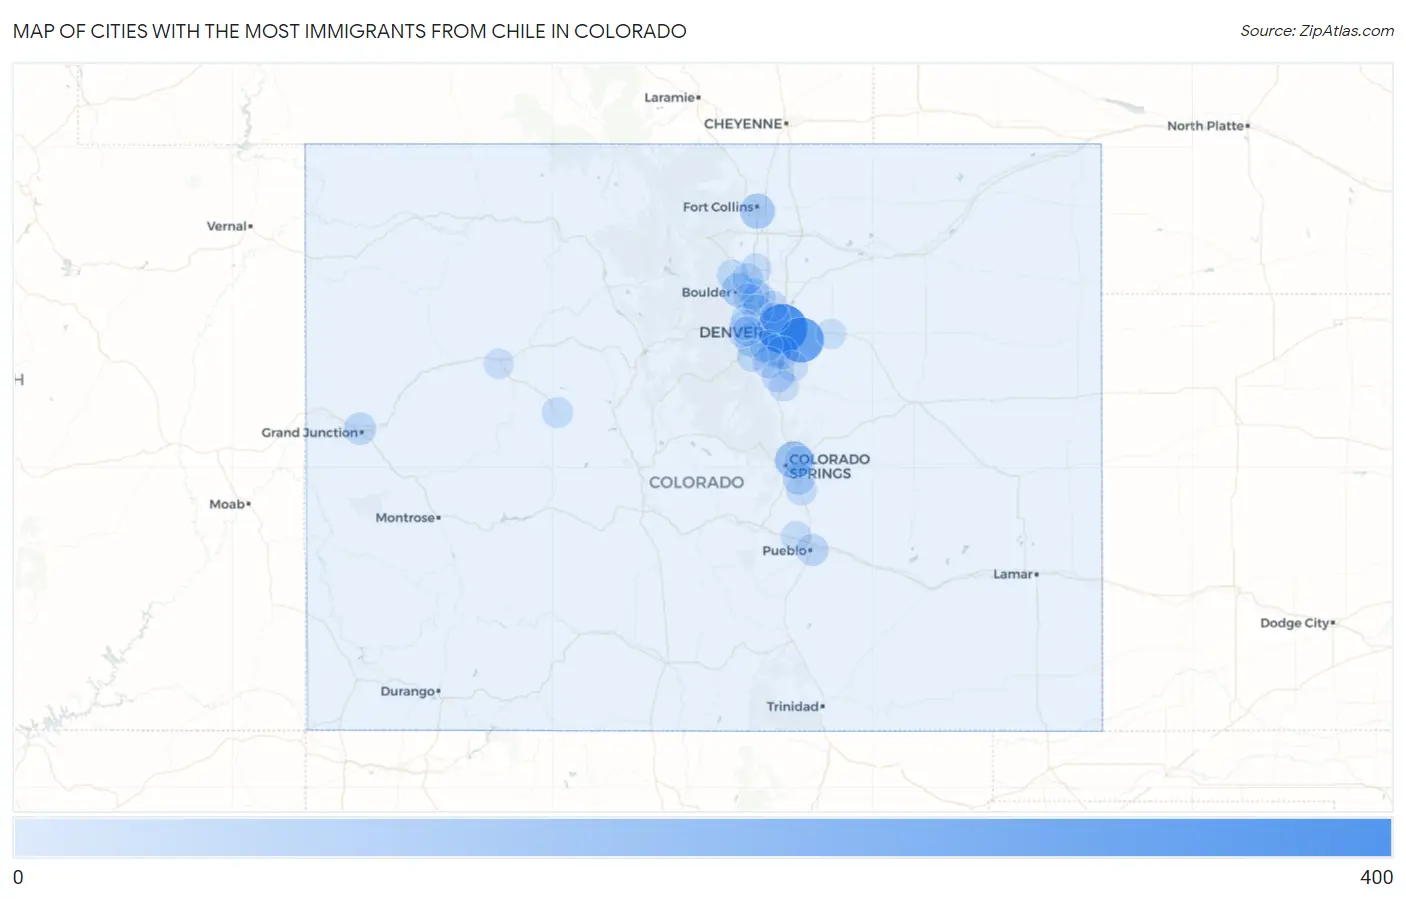
Map of Cities with the Most Immigrants from Chile in Colorado
0
400
Cities with the Most Immigrants from Chile in Colorado
| City | Chile | vs State | vs National | |
| 1. | Denver | 380 | 1,938(19.61%)#1 | 106,565(0.36%)#26 |
| 2. | Aurora | 292 | 1,938(15.07%)#2 | 106,565(0.27%)#40 |
| 3. | Colorado Springs | 139 | 1,938(7.17%)#3 | 106,565(0.13%)#129 |
| 4. | Fort Collins | 96 | 1,938(4.95%)#4 | 106,565(0.09%)#214 |
| 5. | Boulder | 80 | 1,938(4.13%)#5 | 106,565(0.08%)#260 |
| 6. | Lakewood | 67 | 1,938(3.46%)#6 | 106,565(0.06%)#320 |
| 7. | Broomfield | 60 | 1,938(3.10%)#7 | 106,565(0.06%)#359 |
| 8. | Greenwood Village | 53 | 1,938(2.73%)#8 | 106,565(0.05%)#407 |
| 9. | Centennial | 47 | 1,938(2.43%)#9 | 106,565(0.04%)#446 |
| 10. | Castle Pines Village | 44 | 1,938(2.27%)#10 | 106,565(0.04%)#484 |
| 11. | Englewood | 43 | 1,938(2.22%)#11 | 106,565(0.04%)#491 |
| 12. | Grand Junction | 42 | 1,938(2.17%)#12 | 106,565(0.04%)#509 |
| 13. | Highlands Ranch | 37 | 1,938(1.91%)#13 | 106,565(0.03%)#556 |
| 14. | Pueblo | 36 | 1,938(1.86%)#14 | 106,565(0.03%)#566 |
| 15. | Security Widefield | 35 | 1,938(1.81%)#15 | 106,565(0.03%)#586 |
| 16. | Lafayette | 28 | 1,938(1.44%)#16 | 106,565(0.03%)#694 |
| 17. | Ken Caryl | 23 | 1,938(1.19%)#17 | 106,565(0.02%)#784 |
| 18. | Altona | 22 | 1,938(1.14%)#18 | 106,565(0.02%)#821 |
| 19. | Thornton | 19 | 1,938(0.98%)#19 | 106,565(0.02%)#870 |
| 20. | Aspen | 19 | 1,938(0.98%)#20 | 106,565(0.02%)#896 |
| 21. | Cimarron Hills | 18 | 1,938(0.93%)#21 | 106,565(0.02%)#913 |
| 22. | Longmont | 17 | 1,938(0.88%)#22 | 106,565(0.02%)#929 |
| 23. | Fountain | 17 | 1,938(0.88%)#23 | 106,565(0.02%)#941 |
| 24. | Louisville | 17 | 1,938(0.88%)#24 | 106,565(0.02%)#945 |
| 25. | Niwot | 17 | 1,938(0.88%)#25 | 106,565(0.02%)#959 |
| 26. | Arvada | 15 | 1,938(0.77%)#26 | 106,565(0.01%)#991 |
| 27. | Pueblo West | 13 | 1,938(0.67%)#27 | 106,565(0.01%)#1,086 |
| 28. | Westminster | 12 | 1,938(0.62%)#28 | 106,565(0.01%)#1,120 |
| 29. | Parker | 12 | 1,938(0.62%)#29 | 106,565(0.01%)#1,127 |
| 30. | Golden | 8 | 1,938(0.41%)#30 | 106,565(0.01%)#1,314 |
| 31. | Glenwood Springs | 8 | 1,938(0.41%)#31 | 106,565(0.01%)#1,323 |
| 32. | Castle Rock | 7 | 1,938(0.36%)#32 | 106,565(0.01%)#1,345 |
| 33. | Fairmount | 7 | 1,938(0.36%)#33 | 106,565(0.01%)#1,370 |
| 34. | Applewood | 7 | 1,938(0.36%)#34 | 106,565(0.01%)#1,375 |
| 35. | Derby | 6 | 1,938(0.31%)#35 | 106,565(0.01%)#1,406 |
| 36. | Canon City | 4 | 1,938(0.21%)#36 | 106,565(0.00%)#1,464 |
| 37. | Bennett | 4 | 1,938(0.21%)#37 | 106,565(0.00%)#1,476 |
Common Questions
What are the Top 10 Cities with the Most Immigrants from Chile in Colorado?
Top 10 Cities with the Most Immigrants from Chile in Colorado are:
#1
380
#2
292
#3
139
#4
96
#5
80
#6
67
#7
60
#8
53
#9
47
#10
44
What city has the Most Immigrants from Chile in Colorado?
Denver has the Most Immigrants from Chile in Colorado with 380.
What is the Total Immigrants from Chile in the State of Colorado?
Total Immigrants from Chile in Colorado is 1,938.
What is the Total Immigrants from Chile in the United States?
Total Immigrants from Chile in the United States is 106,565.