Cities with the Highest Percentage of Not-for-profit Organizations in Connecticut
RELATED REPORTS & OPTIONS
Not-for-profit Organizations
Connecticut
Compare Cities
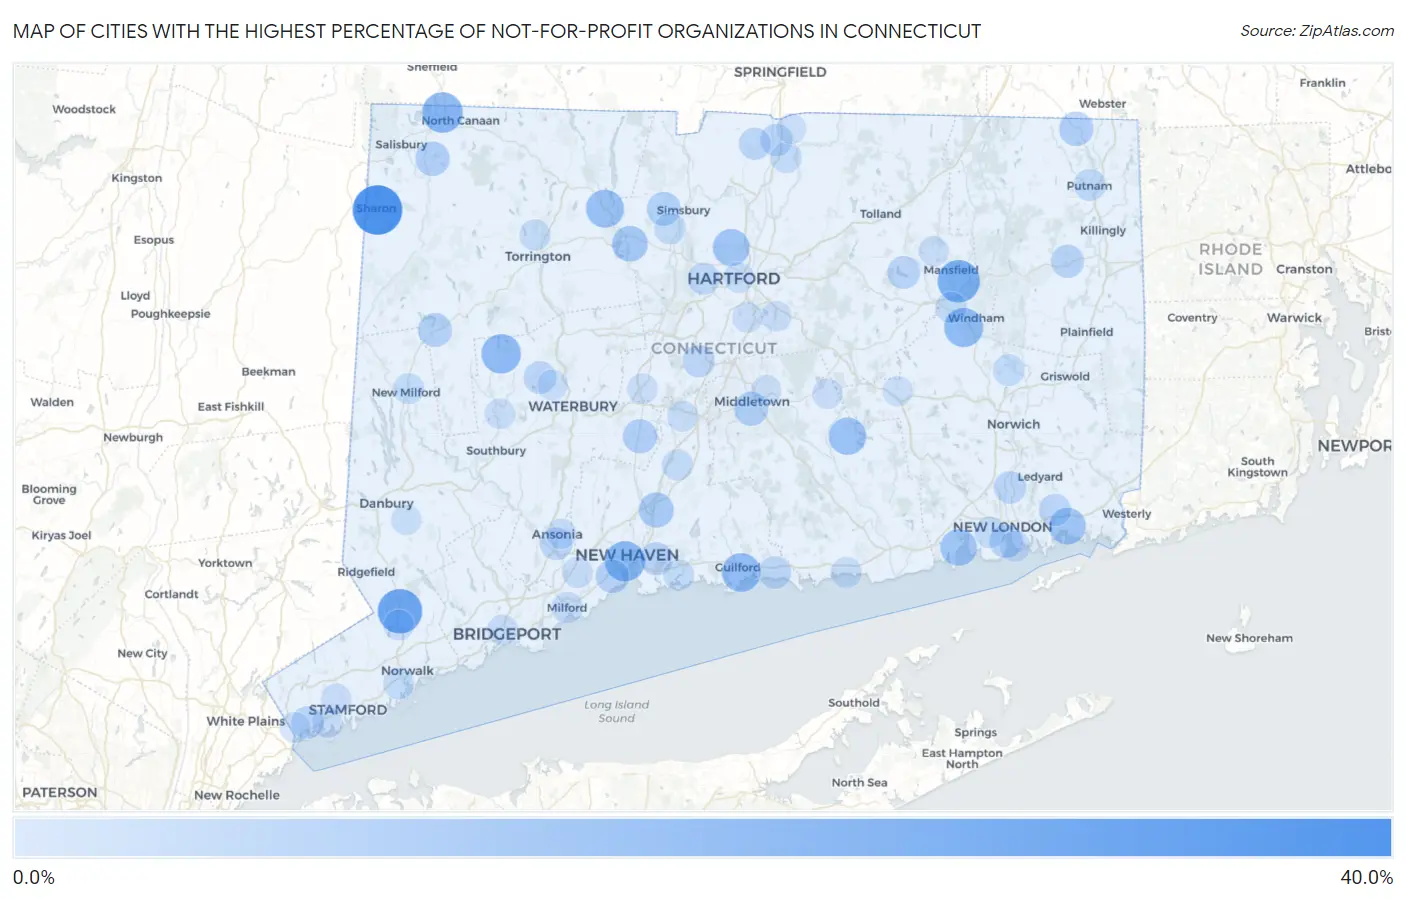
Map of Cities with the Highest Percentage of Not-for-profit Organizations in Connecticut
0.0%
40.0%
Cities with the Highest Percentage of Not-for-profit Organizations in Connecticut
| City | % Employed in Not-for-profit | vs State | vs National | |
| 1. | Sharon | 36.2% | 10.4%(+25.7)#1 | 8.4%(+27.7)#369 |
| 2. | Knollcrest | 29.5% | 10.4%(+19.0)#2 | 8.4%(+21.0)#605 |
| 3. | Fenwick Borough | 29.4% | 10.4%(+19.0)#3 | 8.4%(+21.0)#610 |
| 4. | Cannondale | 28.9% | 10.4%(+18.4)#4 | 8.4%(+20.4)#638 |
| 5. | Quinnipiac University | 28.4% | 10.4%(+17.9)#5 | 8.4%(+19.9)#668 |
| 6. | Mansfield Center | 25.9% | 10.4%(+15.5)#6 | 8.4%(+17.4)#820 |
| 7. | Canaan | 23.5% | 10.4%(+13.1)#7 | 8.4%(+15.1)#1,051 |
| 8. | New Haven | 22.9% | 10.4%(+12.5)#8 | 8.4%(+14.5)#1,110 |
| 9. | Bethlehem Village | 21.8% | 10.4%(+11.4)#9 | 8.4%(+13.4)#1,251 |
| 10. | South Windham | 21.4% | 10.4%(+11.0)#10 | 8.4%(+13.0)#1,298 |
| 11. | Cornwall | 21.4% | 10.4%(+11.0)#11 | 8.4%(+13.0)#1,304 |
| 12. | Guilford Center | 20.7% | 10.4%(+10.3)#12 | 8.4%(+12.3)#1,428 |
| 13. | Plattsville | 20.3% | 10.4%(+9.84)#13 | 8.4%(+11.8)#1,495 |
| 14. | Topstone | 20.0% | 10.4%(+9.56)#14 | 8.4%(+11.6)#1,552 |
| 15. | New Hartford Center | 19.8% | 10.4%(+9.32)#15 | 8.4%(+11.3)#1,609 |
| 16. | Murray | 19.1% | 10.4%(+8.70)#16 | 8.4%(+10.7)#1,725 |
| 17. | Moodus | 19.1% | 10.4%(+8.66)#17 | 8.4%(+10.7)#1,739 |
| 18. | Blue Hills | 18.2% | 10.4%(+7.73)#18 | 8.4%(+9.72)#1,994 |
| 19. | Jewett City Borough | 18.1% | 10.4%(+7.69)#19 | 8.4%(+9.69)#2,008 |
| 20. | Mystic | 18.0% | 10.4%(+7.61)#20 | 8.4%(+9.60)#2,032 |
| 21. | Niantic | 17.8% | 10.4%(+7.40)#21 | 8.4%(+9.40)#2,094 |
| 22. | Mechanicsville | 17.3% | 10.4%(+6.84)#22 | 8.4%(+8.84)#2,273 |
| 23. | Bridgewater | 16.7% | 10.4%(+6.23)#23 | 8.4%(+8.22)#2,488 |
| 24. | West Cornwall | 16.7% | 10.4%(+6.23)#24 | 8.4%(+8.22)#2,499 |
| 25. | Collinsville | 16.6% | 10.4%(+6.19)#25 | 8.4%(+8.19)#2,511 |
| 26. | North Haven | 15.8% | 10.4%(+5.37)#26 | 8.4%(+7.37)#2,877 |
| 27. | Old Hill | 15.5% | 10.4%(+5.02)#27 | 8.4%(+7.02)#3,062 |
| 28. | Sacred Heart University | 15.1% | 10.4%(+4.61)#28 | 8.4%(+6.61)#3,293 |
| 29. | Falls Village | 14.8% | 10.4%(+4.37)#29 | 8.4%(+6.37)#3,445 |
| 30. | Quinebaug | 14.8% | 10.4%(+4.36)#30 | 8.4%(+6.35)#3,454 |
| 31. | Cheshire Village | 14.6% | 10.4%(+4.13)#31 | 8.4%(+6.12)#3,610 |
| 32. | Middletown | 14.4% | 10.4%(+3.95)#32 | 8.4%(+5.95)#3,714 |
| 33. | Stonington Borough | 14.3% | 10.4%(+3.81)#33 | 8.4%(+5.81)#3,854 |
| 34. | New Preston | 14.2% | 10.4%(+3.78)#34 | 8.4%(+5.78)#3,868 |
| 35. | Litchfield Borough | 14.2% | 10.4%(+3.76)#35 | 8.4%(+5.75)#3,885 |
| 36. | West Simsbury | 14.1% | 10.4%(+3.66)#36 | 8.4%(+5.65)#3,945 |
| 37. | Candlewood Knolls | 13.9% | 10.4%(+3.45)#37 | 8.4%(+5.44)#4,099 |
| 38. | Indian Field | 13.8% | 10.4%(+3.35)#38 | 8.4%(+5.35)#4,156 |
| 39. | West Haven | 13.7% | 10.4%(+3.27)#39 | 8.4%(+5.26)#4,226 |
| 40. | New London | 13.7% | 10.4%(+3.24)#40 | 8.4%(+5.24)#4,238 |
| 41. | Stratford Downtown | 13.1% | 10.4%(+2.65)#41 | 8.4%(+4.65)#4,703 |
| 42. | Northford | 13.1% | 10.4%(+2.62)#42 | 8.4%(+4.62)#4,726 |
| 43. | Brooklyn | 13.1% | 10.4%(+2.62)#43 | 8.4%(+4.62)#4,729 |
| 44. | East Haven | 12.9% | 10.4%(+2.49)#44 | 8.4%(+4.49)#4,839 |
| 45. | Lakeside Woods | 12.9% | 10.4%(+2.45)#45 | 8.4%(+4.45)#4,899 |
| 46. | Brookfield Center | 12.7% | 10.4%(+2.26)#46 | 8.4%(+4.25)#5,088 |
| 47. | South Coventry | 12.6% | 10.4%(+2.15)#47 | 8.4%(+4.14)#5,180 |
| 48. | Madison Center | 12.5% | 10.4%(+2.09)#48 | 8.4%(+4.09)#5,218 |
| 49. | Gales Ferry | 12.5% | 10.4%(+2.04)#49 | 8.4%(+4.03)#5,299 |
| 50. | Watertown | 12.4% | 10.4%(+1.96)#50 | 8.4%(+3.96)#5,375 |
| 51. | Derby | 12.3% | 10.4%(+1.89)#51 | 8.4%(+3.89)#5,440 |
| 52. | Westport | 12.3% | 10.4%(+1.89)#52 | 8.4%(+3.89)#5,441 |
| 53. | Greenwich | 12.1% | 10.4%(+1.62)#53 | 8.4%(+3.62)#5,723 |
| 54. | Thompsonville | 12.0% | 10.4%(+1.60)#54 | 8.4%(+3.60)#5,741 |
| 55. | Old Mystic | 12.0% | 10.4%(+1.52)#55 | 8.4%(+3.52)#5,818 |
| 56. | Woodmont Borough | 11.9% | 10.4%(+1.43)#56 | 8.4%(+3.43)#5,921 |
| 57. | Kensington | 11.9% | 10.4%(+1.41)#57 | 8.4%(+3.41)#5,944 |
| 58. | Hawleyville | 11.8% | 10.4%(+1.40)#58 | 8.4%(+3.40)#5,955 |
| 59. | Suffield Depot | 11.7% | 10.4%(+1.31)#59 | 8.4%(+3.30)#6,048 |
| 60. | West Hartford | 11.7% | 10.4%(+1.23)#60 | 8.4%(+3.23)#6,139 |
| 61. | Putnam | 11.6% | 10.4%(+1.20)#61 | 8.4%(+3.20)#6,179 |
| 62. | Baltic | 11.2% | 10.4%(+0.784)#62 | 8.4%(+2.78)#6,696 |
| 63. | Lakes West | 11.1% | 10.4%(+0.686)#63 | 8.4%(+2.68)#6,798 |
| 64. | Weatogue | 10.9% | 10.4%(+0.467)#64 | 8.4%(+2.46)#7,110 |
| 65. | Willimantic | 10.9% | 10.4%(+0.447)#65 | 8.4%(+2.44)#7,134 |
| 66. | Dayville | 10.8% | 10.4%(+0.319)#66 | 8.4%(+2.32)#7,317 |
| 67. | Milford City Balance | 10.7% | 10.4%(+0.262)#67 | 8.4%(+2.26)#7,399 |
| 68. | Torrington | 10.7% | 10.4%(+0.258)#68 | 8.4%(+2.25)#7,407 |
| 69. | Wallingford Center | 10.7% | 10.4%(+0.236)#69 | 8.4%(+2.23)#7,440 |
| 70. | Groton Long Point Borough | 10.7% | 10.4%(+0.232)#70 | 8.4%(+2.23)#7,446 |
| 71. | Candlewood Isle | 10.6% | 10.4%(+0.206)#71 | 8.4%(+2.20)#7,482 |
| 72. | Norwalk | 10.6% | 10.4%(+0.191)#72 | 8.4%(+2.19)#7,510 |
| 73. | Waterford | 10.6% | 10.4%(+0.164)#73 | 8.4%(+2.16)#7,550 |
| 74. | Southwood Acres | 10.5% | 10.4%(+0.075)#74 | 8.4%(+2.07)#7,678 |
| 75. | Stepney | 10.4% | 10.4%(+0.005)#75 | 8.4%(+2.00)#7,766 |
| 76. | Branford Center | 10.4% | 10.4%(-0.042)#76 | 8.4%(+1.95)#7,837 |
| 77. | New Milford | 10.3% | 10.4%(-0.095)#77 | 8.4%(+1.90)#7,908 |
| 78. | Pemberwick | 10.3% | 10.4%(-0.172)#78 | 8.4%(+1.82)#8,049 |
| 79. | Westbrook Center | 10.2% | 10.4%(-0.204)#79 | 8.4%(+1.79)#8,107 |
| 80. | Orange | 10.2% | 10.4%(-0.276)#80 | 8.4%(+1.72)#8,219 |
| 81. | Bridgeport | 10.2% | 10.4%(-0.277)#81 | 8.4%(+1.72)#8,221 |
| 82. | Wilton Center | 10.1% | 10.4%(-0.345)#82 | 8.4%(+1.65)#8,318 |
| 83. | Riverside | 10.0% | 10.4%(-0.433)#83 | 8.4%(+1.56)#8,420 |
| 84. | Meriden | 10.0% | 10.4%(-0.454)#84 | 8.4%(+1.54)#8,482 |
| 85. | Hartford | 9.9% | 10.4%(-0.566)#85 | 8.4%(+1.43)#8,641 |
| 86. | Plantsville | 9.9% | 10.4%(-0.589)#86 | 8.4%(+1.41)#8,681 |
| 87. | Groton | 9.8% | 10.4%(-0.637)#87 | 8.4%(+1.36)#8,776 |
| 88. | East Hampton | 9.8% | 10.4%(-0.676)#88 | 8.4%(+1.32)#8,821 |
| 89. | Woodbury Center | 9.7% | 10.4%(-0.694)#89 | 8.4%(+1.30)#8,849 |
| 90. | Ansonia | 9.7% | 10.4%(-0.709)#90 | 8.4%(+1.29)#8,871 |
| 91. | Storrs | 9.7% | 10.4%(-0.726)#91 | 8.4%(+1.27)#8,905 |
| 92. | Glastonbury Center | 9.7% | 10.4%(-0.734)#92 | 8.4%(+1.26)#8,917 |
| 93. | Oakville | 9.7% | 10.4%(-0.740)#93 | 8.4%(+1.26)#8,925 |
| 94. | Stamford | 9.6% | 10.4%(-0.809)#94 | 8.4%(+1.19)#9,060 |
| 95. | Newtown Borough | 9.6% | 10.4%(-0.830)#95 | 8.4%(+1.17)#9,099 |
| 96. | Wethersfield | 9.6% | 10.4%(-0.859)#96 | 8.4%(+1.14)#9,167 |
| 97. | Bethel | 9.5% | 10.4%(-0.988)#97 | 8.4%(+1.01)#9,412 |
| 98. | Colchester | 9.3% | 10.4%(-1.10)#98 | 8.4%(+0.898)#9,601 |
| 99. | Portland | 9.3% | 10.4%(-1.10)#99 | 8.4%(+0.894)#9,610 |
| 100. | Sherwood Manor | 9.2% | 10.4%(-1.23)#100 | 8.4%(+0.762)#9,842 |
Common Questions
What are the Top 10 Cities with the Highest Percentage of Not-for-profit Organizations in Connecticut?
Top 10 Cities with the Highest Percentage of Not-for-profit Organizations in Connecticut are:
#1
36.2%
#2
28.9%
#3
25.9%
#4
23.5%
#5
22.9%
#6
21.8%
#7
21.4%
#8
20.7%
#9
19.8%
#10
19.1%
What city has the Highest Percentage of Not-for-profit Organizations in Connecticut?
Sharon has the Highest Percentage of Not-for-profit Organizations in Connecticut with 36.2%.
What is the Percentage of Not-for-profit Organizations in the State of Connecticut?
Percentage of Not-for-profit Organizations in Connecticut is 10.4%.
What is the Percentage of Not-for-profit Organizations in the United States?
Percentage of Not-for-profit Organizations in the United States is 8.4%.