Cities with the Highest Percentage of Not-for-profit Organizations in South Carolina
RELATED REPORTS & OPTIONS
Not-for-profit Organizations
South Carolina
Compare Cities
Map of Cities with the Highest Percentage of Not-for-profit Organizations in South Carolina
0.0%
100.0%
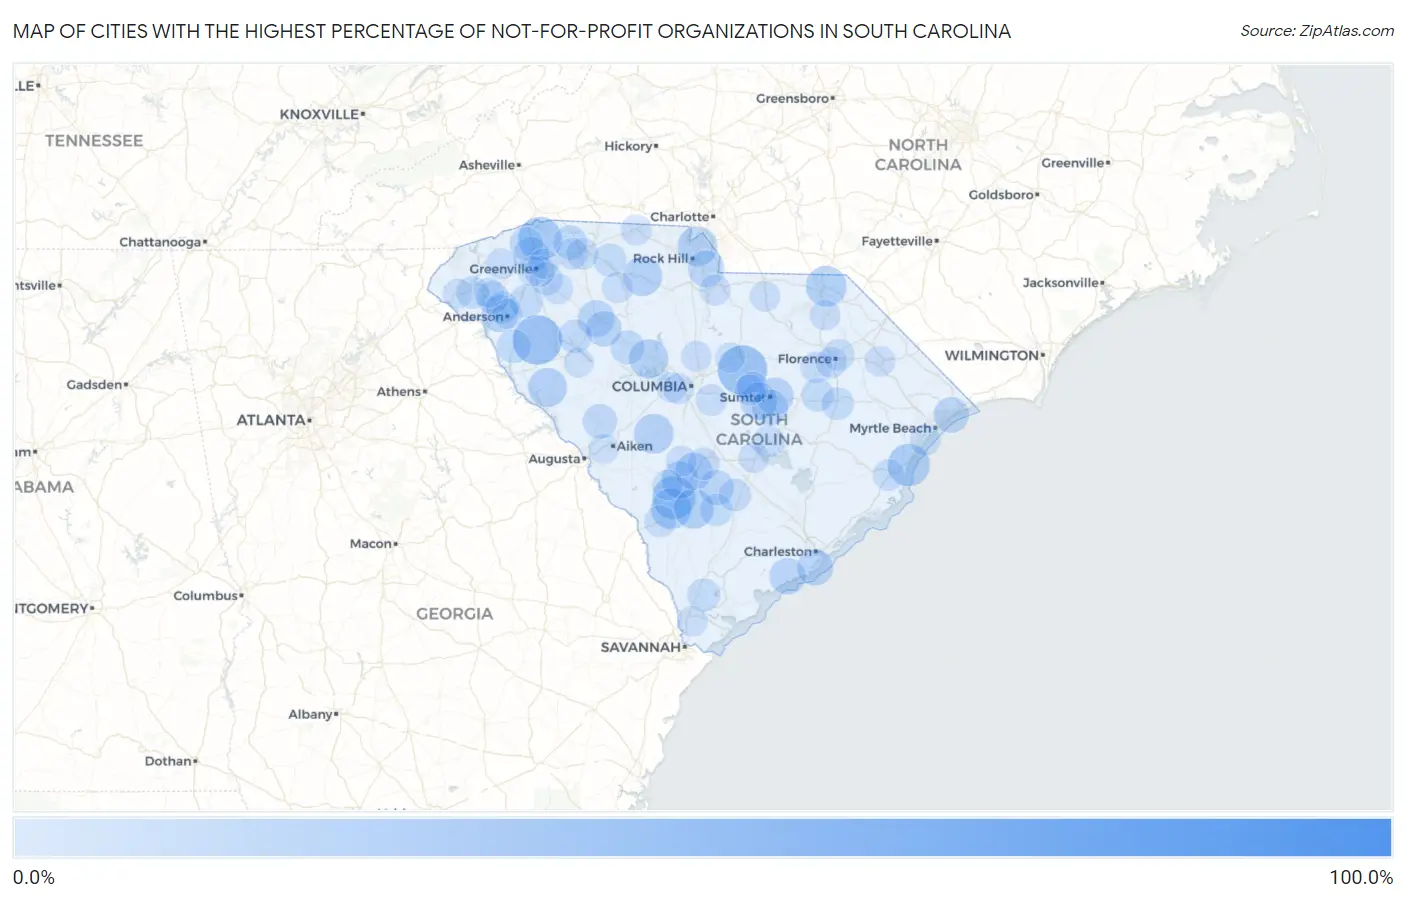
Cities with the Highest Percentage of Not-for-profit Organizations in South Carolina
| City | % Employed in Not-for-profit | vs State | vs National | |
| 1. | Abney Crossroads | 81.0% | 6.5% (+74.5)#1 | 8.4% (+72.5)#50 |
| 2. | Caesars Head | 53.8% | 6.5% (+47.4)#2 | 8.4% (+45.4)#141 |
| 3. | Boykin | 34.3% | 6.5% (+27.8)#3 | 8.4% (+25.9)#419 |
| 4. | Due West | 34.2% | 6.5% (+27.7)#4 | 8.4% (+25.8)#422 |
| 5. | Glenn Springs | 31.7% | 6.5% (+25.3)#5 | 8.4% (+23.3)#512 |
| 6. | Sheldon | 29.6% | 6.5% (+23.1)#6 | 8.4% (+21.1)#603 |
| 7. | Chickasaw Point | 28.1% | 6.5% (+21.6)#7 | 8.4% (+19.7)#680 |
| 8. | Tigerville | 26.7% | 6.5% (+20.2)#8 | 8.4% (+18.3)#765 |
| 9. | Olar | 25.9% | 6.5% (+19.5)#9 | 8.4% (+17.5)#816 |
| 10. | Pawleys Island | 25.0% | 6.5% (+18.5)#10 | 8.4% (+16.6)#893 |
| 11. | Fairview Crossroads | 23.9% | 6.5% (+17.5)#11 | 8.4% (+15.5)#1,007 |
| 12. | Ashwood | 23.3% | 6.5% (+16.9)#12 | 8.4% (+14.9)#1,068 |
| 13. | Wallace | 22.8% | 6.5% (+16.3)#13 | 8.4% (+14.4)#1,123 |
| 14. | Ulmer | 22.8% | 6.5% (+16.3)#14 | 8.4% (+14.4)#1,124 |
| 15. | Ehrhardt | 21.7% | 6.5% (+15.2)#15 | 8.4% (+13.2)#1,270 |
| 16. | East Camden | 21.3% | 6.5% (+14.8)#16 | 8.4% (+12.9)#1,323 |
| 17. | Wagener | 21.3% | 6.5% (+14.8)#17 | 8.4% (+12.9)#1,325 |
| 18. | Lockhart | 21.3% | 6.5% (+14.8)#18 | 8.4% (+12.8)#1,330 |
| 19. | Riverview | 21.2% | 6.5% (+14.8)#19 | 8.4% (+12.8)#1,339 |
| 20. | Little Mountain | 20.7% | 6.5% (+14.2)#20 | 8.4% (+12.2)#1,440 |
| 21. | Troy | 20.6% | 6.5% (+14.2)#21 | 8.4% (+12.2)#1,449 |
| 22. | Hamer | 19.0% | 6.5% (+12.6)#22 | 8.4% (+10.6)#1,752 |
| 23. | Denmark | 18.5% | 6.5% (+12.1)#23 | 8.4% (+10.1)#1,876 |
| 24. | East Sumter | 18.4% | 6.5% (+11.9)#24 | 8.4% (+9.95)#1,908 |
| 25. | Cane Savannah | 18.4% | 6.5% (+11.9)#25 | 8.4% (+9.93)#1,913 |
| 26. | Grover | 18.3% | 6.5% (+11.8)#26 | 8.4% (+9.87)#1,939 |
| 27. | Cope | 18.2% | 6.5% (+11.7)#27 | 8.4% (+9.74)#1,990 |
| 28. | Centerville | 18.1% | 6.5% (+11.6)#28 | 8.4% (+9.62)#2,024 |
| 29. | Clinton | 17.9% | 6.5% (+11.5)#29 | 8.4% (+9.49)#2,066 |
| 30. | Dunbar | 17.5% | 6.5% (+11.0)#30 | 8.4% (+9.04)#2,204 |
| 31. | Catawba | 17.5% | 6.5% (+11.0)#31 | 8.4% (+9.02)#2,207 |
| 32. | Dacusville | 17.1% | 6.5% (+10.7)#32 | 8.4% (+8.70)#2,312 |
| 33. | Rockville | 17.1% | 6.5% (+10.6)#33 | 8.4% (+8.63)#2,339 |
| 34. | Folly Beach | 16.9% | 6.5% (+10.5)#34 | 8.4% (+8.49)#2,389 |
| 35. | Lakewood | 16.8% | 6.5% (+10.3)#35 | 8.4% (+8.33)#2,437 |
| 36. | Travelers Rest | 16.6% | 6.5% (+10.1)#36 | 8.4% (+8.15)#2,522 |
| 37. | Joanna | 16.5% | 6.5% (+10.0)#37 | 8.4% (+8.04)#2,563 |
| 38. | Briarcliffe Acres | 16.3% | 6.5% (+9.84)#38 | 8.4% (+7.86)#2,634 |
| 39. | Branchville | 15.7% | 6.5% (+9.22)#39 | 8.4% (+7.24)#2,937 |
| 40. | Trenton | 14.8% | 6.5% (+8.35)#40 | 8.4% (+6.37)#3,446 |
| 41. | Newberry | 14.3% | 6.5% (+7.80)#41 | 8.4% (+5.82)#3,848 |
| 42. | Inman Mills | 14.1% | 6.5% (+7.62)#42 | 8.4% (+5.64)#3,953 |
| 43. | Lake Secession | 13.9% | 6.5% (+7.40)#43 | 8.4% (+5.42)#4,121 |
| 44. | Waterloo | 13.8% | 6.5% (+7.29)#44 | 8.4% (+5.31)#4,192 |
| 45. | Williamston | 13.7% | 6.5% (+7.27)#45 | 8.4% (+5.29)#4,200 |
| 46. | Slater Marietta | 13.6% | 6.5% (+7.15)#46 | 8.4% (+5.17)#4,308 |
| 47. | La France | 13.5% | 6.5% (+7.05)#47 | 8.4% (+5.07)#4,379 |
| 48. | Ridgeland | 13.2% | 6.5% (+6.75)#48 | 8.4% (+4.77)#4,608 |
| 49. | Central Pacolet | 13.1% | 6.5% (+6.65)#49 | 8.4% (+4.67)#4,681 |
| 50. | Olanta | 12.8% | 6.5% (+6.32)#50 | 8.4% (+4.34)#5,000 |
| 51. | Lake City | 12.5% | 6.5% (+6.04)#51 | 8.4% (+4.06)#5,237 |
| 52. | Smoaks | 12.5% | 6.5% (+6.04)#52 | 8.4% (+4.06)#5,269 |
| 53. | Seneca | 12.5% | 6.5% (+6.02)#53 | 8.4% (+4.04)#5,292 |
| 54. | Mauldin | 12.5% | 6.5% (+6.01)#54 | 8.4% (+4.03)#5,297 |
| 55. | Wyboo | 12.4% | 6.5% (+5.96)#55 | 8.4% (+3.98)#5,345 |
| 56. | Northlake | 12.3% | 6.5% (+5.84)#56 | 8.4% (+3.86)#5,459 |
| 57. | Pendleton | 12.3% | 6.5% (+5.84)#57 | 8.4% (+3.86)#5,461 |
| 58. | Reevesville | 12.3% | 6.5% (+5.82)#58 | 8.4% (+3.84)#5,490 |
| 59. | Cordova | 11.9% | 6.5% (+5.44)#59 | 8.4% (+3.46)#5,883 |
| 60. | Camp Croft | 11.6% | 6.5% (+5.09)#60 | 8.4% (+3.11)#6,284 |
| 61. | Summerton | 11.4% | 6.5% (+4.89)#61 | 8.4% (+2.91)#6,526 |
| 62. | Quinby | 11.3% | 6.5% (+4.88)#62 | 8.4% (+2.90)#6,533 |
| 63. | Allendale | 11.3% | 6.5% (+4.88)#63 | 8.4% (+2.90)#6,540 |
| 64. | Arcadia | 11.2% | 6.5% (+4.77)#64 | 8.4% (+2.79)#6,689 |
| 65. | Ben Avon | 11.2% | 6.5% (+4.74)#65 | 8.4% (+2.76)#6,718 |
| 66. | Timmonsville | 11.2% | 6.5% (+4.70)#66 | 8.4% (+2.72)#6,767 |
| 67. | Hopkins | 11.0% | 6.5% (+4.55)#67 | 8.4% (+2.57)#6,960 |
| 68. | Georgetown | 10.9% | 6.5% (+4.46)#68 | 8.4% (+2.48)#7,081 |
| 69. | Wellford | 10.9% | 6.5% (+4.44)#69 | 8.4% (+2.46)#7,112 |
| 70. | Whitney | 10.8% | 6.5% (+4.30)#70 | 8.4% (+2.32)#7,314 |
| 71. | Oakland | 10.6% | 6.5% (+4.18)#71 | 8.4% (+2.20)#7,484 |
| 72. | Lobeco | 10.6% | 6.5% (+4.15)#72 | 8.4% (+2.18)#7,525 |
| 73. | Blacksburg | 10.5% | 6.5% (+4.03)#73 | 8.4% (+2.05)#7,700 |
| 74. | Irwin | 10.4% | 6.5% (+3.96)#74 | 8.4% (+1.98)#7,794 |
| 75. | Stateburg | 10.4% | 6.5% (+3.92)#75 | 8.4% (+1.94)#7,861 |
| 76. | Florence | 10.4% | 6.5% (+3.92)#76 | 8.4% (+1.94)#7,863 |
| 77. | Pickens | 10.4% | 6.5% (+3.91)#77 | 8.4% (+1.93)#7,881 |
| 78. | Fountain Inn | 10.3% | 6.5% (+3.81)#78 | 8.4% (+1.83)#8,037 |
| 79. | Santee | 10.3% | 6.5% (+3.80)#79 | 8.4% (+1.82)#8,047 |
| 80. | Surfside Beach | 10.3% | 6.5% (+3.80)#80 | 8.4% (+1.82)#8,050 |
| 81. | Norway | 10.1% | 6.5% (+3.63)#81 | 8.4% (+1.65)#8,324 |
| 82. | Greenville | 10.0% | 6.5% (+3.57)#82 | 8.4% (+1.59)#8,389 |
| 83. | Buffalo | 10.0% | 6.5% (+3.51)#83 | 8.4% (+1.53)#8,494 |
| 84. | Blythewood | 10.0% | 6.5% (+3.51)#84 | 8.4% (+1.53)#8,496 |
| 85. | Marion | 10.0% | 6.5% (+3.50)#85 | 8.4% (+1.52)#8,507 |
| 86. | Hilda | 9.8% | 6.5% (+3.33)#86 | 8.4% (+1.35)#8,786 |
| 87. | Oak Grove | 9.8% | 6.5% (+3.32)#87 | 8.4% (+1.34)#8,791 |
| 88. | Society Hill | 9.8% | 6.5% (+3.32)#88 | 8.4% (+1.34)#8,793 |
| 89. | Jefferson | 9.7% | 6.5% (+3.20)#89 | 8.4% (+1.22)#8,990 |
| 90. | Hardeeville | 9.7% | 6.5% (+3.20)#90 | 8.4% (+1.22)#8,998 |
| 91. | Warrenville | 9.6% | 6.5% (+3.11)#91 | 8.4% (+1.13)#9,184 |
| 92. | Anderson | 9.6% | 6.5% (+3.10)#92 | 8.4% (+1.12)#9,200 |
| 93. | Lexington | 9.4% | 6.5% (+2.94)#93 | 8.4% (+0.965)#9,491 |
| 94. | Judson | 9.4% | 6.5% (+2.89)#94 | 8.4% (+0.908)#9,581 |
| 95. | Lugoff | 9.3% | 6.5% (+2.88)#95 | 8.4% (+0.896)#9,603 |
| 96. | Sandy Springs | 9.3% | 6.5% (+2.87)#96 | 8.4% (+0.889)#9,618 |
| 97. | Wade Hampton | 9.3% | 6.5% (+2.79)#97 | 8.4% (+0.812)#9,756 |
| 98. | Clemson | 9.1% | 6.5% (+2.68)#98 | 8.4% (+0.705)#9,946 |
| 99. | Westminster | 9.1% | 6.5% (+2.63)#99 | 8.4% (+0.646)#10,044 |
| 100. | Ninety Six | 9.1% | 6.5% (+2.60)#100 | 8.4% (+0.620)#10,146 |
Common Questions
What are the Top 10 Cities with the Highest Percentage of Not-for-profit Organizations in South Carolina?
Top 10 Cities with the Highest Percentage of Not-for-profit Organizations in South Carolina are:
#1
34.3%
#2
34.2%
#3
26.7%
#4
25.9%
#5
25.0%
#6
22.8%
#7
22.8%
#8
21.7%
#9
21.3%
#10
21.3%
What city has the Highest Percentage of Not-for-profit Organizations in South Carolina?
Boykin has the Highest Percentage of Not-for-profit Organizations in South Carolina with 34.3%.
What is the Percentage of Not-for-profit Organizations in the State of South Carolina?
Percentage of Not-for-profit Organizations in South Carolina is 6.5%.
What is the Percentage of Not-for-profit Organizations in the United States?
Percentage of Not-for-profit Organizations in the United States is 8.4%.