Cities with the Highest Percentage of Not-for-profit Organizations in Massachusetts
RELATED REPORTS & OPTIONS
Not-for-profit Organizations
Massachusetts
Compare Cities
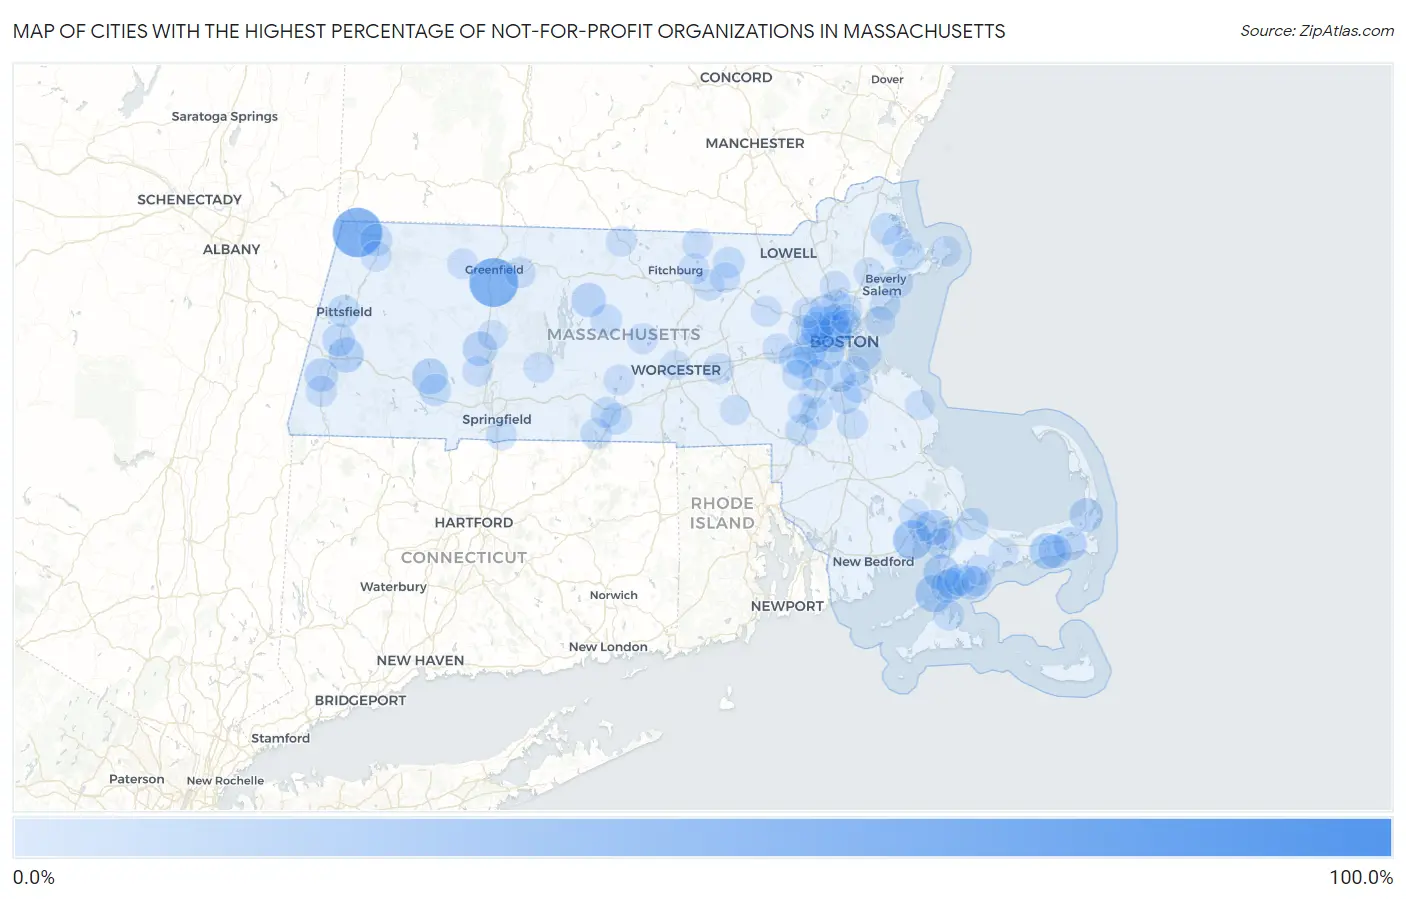
Map of Cities with the Highest Percentage of Not-for-profit Organizations in Massachusetts
0.0%
100.0%
Cities with the Highest Percentage of Not-for-profit Organizations in Massachusetts
| City | % Employed in Not-for-profit | vs State | vs National | |
| 1. | Lenox Dale | 96.3% | 13.4%(+83.0)#1 | 8.4%(+87.9)#44 |
| 2. | Williamstown | 61.5% | 13.4%(+48.2)#2 | 8.4%(+53.1)#99 |
| 3. | Deerfield | 59.9% | 13.4%(+46.6)#3 | 8.4%(+51.5)#109 |
| 4. | Marion Center | 34.9% | 13.4%(+21.5)#4 | 8.4%(+26.4)#398 |
| 5. | Cambridge | 30.7% | 13.4%(+17.3)#5 | 8.4%(+22.3)#548 |
| 6. | Woods Hole | 29.9% | 13.4%(+16.5)#6 | 8.4%(+21.5)#590 |
| 7. | Brookline | 29.4% | 13.4%(+16.0)#7 | 8.4%(+21.0)#613 |
| 8. | West Dennis | 27.4% | 13.4%(+14.0)#8 | 8.4%(+18.9)#721 |
| 9. | Huntington | 26.9% | 13.4%(+13.6)#9 | 8.4%(+18.5)#751 |
| 10. | Oak Bluffs | 26.6% | 13.4%(+13.2)#10 | 8.4%(+18.1)#778 |
| 11. | West Falmouth | 26.5% | 13.4%(+13.2)#11 | 8.4%(+18.1)#782 |
| 12. | Onset | 25.4% | 13.4%(+12.1)#12 | 8.4%(+17.0)#851 |
| 13. | Lee | 25.0% | 13.4%(+11.6)#13 | 8.4%(+16.5)#908 |
| 14. | Northampton | 23.8% | 13.4%(+10.4)#14 | 8.4%(+15.4)#1,020 |
| 15. | Petersham | 23.4% | 13.4%(+10.1)#15 | 8.4%(+15.0)#1,060 |
| 16. | Somerville | 23.0% | 13.4%(+9.63)#16 | 8.4%(+14.6)#1,102 |
| 17. | Seconsett Island | 22.2% | 13.4%(+8.86)#17 | 8.4%(+13.8)#1,191 |
| 18. | Newton | 22.2% | 13.4%(+8.83)#18 | 8.4%(+13.8)#1,202 |
| 19. | Orleans | 21.7% | 13.4%(+8.30)#19 | 8.4%(+13.2)#1,275 |
| 20. | Harwich Center | 21.3% | 13.4%(+7.89)#20 | 8.4%(+12.8)#1,337 |
| 21. | Dennis Port | 21.1% | 13.4%(+7.73)#21 | 8.4%(+12.6)#1,359 |
| 22. | Falmouth | 21.0% | 13.4%(+7.60)#22 | 8.4%(+12.5)#1,385 |
| 23. | Housatonic | 20.8% | 13.4%(+7.48)#23 | 8.4%(+12.4)#1,405 |
| 24. | Watertown Town | 20.8% | 13.4%(+7.43)#24 | 8.4%(+12.3)#1,416 |
| 25. | Belmont | 20.5% | 13.4%(+7.11)#25 | 8.4%(+12.0)#1,466 |
| 26. | Arlington | 20.3% | 13.4%(+6.96)#26 | 8.4%(+11.9)#1,488 |
| 27. | Boston | 20.0% | 13.4%(+6.61)#27 | 8.4%(+11.5)#1,576 |
| 28. | Lenox | 19.6% | 13.4%(+6.23)#28 | 8.4%(+11.1)#1,632 |
| 29. | Randolph Town | 19.3% | 13.4%(+5.98)#29 | 8.4%(+10.9)#1,677 |
| 30. | Sharon | 18.8% | 13.4%(+5.39)#30 | 8.4%(+10.3)#1,813 |
| 31. | Amherst | 18.7% | 13.4%(+5.36)#31 | 8.4%(+10.3)#1,828 |
| 32. | Teaticket | 18.7% | 13.4%(+5.34)#32 | 8.4%(+10.3)#1,836 |
| 33. | Pittsfield | 18.6% | 13.4%(+5.22)#33 | 8.4%(+10.1)#1,864 |
| 34. | North Adams | 18.4% | 13.4%(+5.05)#34 | 8.4%(+9.97)#1,904 |
| 35. | Essex | 18.4% | 13.4%(+5.04)#35 | 8.4%(+9.96)#1,906 |
| 36. | Russell | 18.4% | 13.4%(+5.01)#36 | 8.4%(+9.93)#1,914 |
| 37. | Wellesley | 18.3% | 13.4%(+4.97)#37 | 8.4%(+9.89)#1,932 |
| 38. | Sandwich | 18.0% | 13.4%(+4.67)#38 | 8.4%(+9.59)#2,036 |
| 39. | East Falmouth | 17.9% | 13.4%(+4.52)#39 | 8.4%(+9.44)#2,078 |
| 40. | Foxborough | 17.7% | 13.4%(+4.31)#40 | 8.4%(+9.23)#2,130 |
| 41. | Needham | 17.5% | 13.4%(+4.13)#41 | 8.4%(+9.05)#2,202 |
| 42. | Melrose | 17.3% | 13.4%(+3.94)#42 | 8.4%(+8.86)#2,268 |
| 43. | Sturbridge | 17.0% | 13.4%(+3.64)#43 | 8.4%(+8.56)#2,360 |
| 44. | Rowley | 17.0% | 13.4%(+3.63)#44 | 8.4%(+8.55)#2,365 |
| 45. | Milton | 16.8% | 13.4%(+3.48)#45 | 8.4%(+8.40)#2,423 |
| 46. | Dedham | 16.5% | 13.4%(+3.12)#46 | 8.4%(+8.04)#2,561 |
| 47. | Barre | 16.4% | 13.4%(+2.99)#47 | 8.4%(+7.91)#2,615 |
| 48. | Groton | 16.2% | 13.4%(+2.82)#48 | 8.4%(+7.74)#2,700 |
| 49. | Holland | 15.9% | 13.4%(+2.55)#49 | 8.4%(+7.47)#2,825 |
| 50. | Greenfield | 15.8% | 13.4%(+2.45)#50 | 8.4%(+7.37)#2,878 |
| 51. | Winchester | 15.7% | 13.4%(+2.34)#51 | 8.4%(+7.26)#2,932 |
| 52. | Millers Falls | 15.6% | 13.4%(+2.19)#52 | 8.4%(+7.11)#3,009 |
| 53. | Great Barrington | 15.6% | 13.4%(+2.19)#53 | 8.4%(+7.11)#3,016 |
| 54. | Beverly | 15.5% | 13.4%(+2.18)#54 | 8.4%(+7.10)#3,023 |
| 55. | Westborough | 15.5% | 13.4%(+2.10)#55 | 8.4%(+7.02)#3,054 |
| 56. | Medford | 15.3% | 13.4%(+1.96)#56 | 8.4%(+6.88)#3,135 |
| 57. | Brockton | 15.3% | 13.4%(+1.95)#57 | 8.4%(+6.87)#3,139 |
| 58. | Shirley | 15.3% | 13.4%(+1.94)#58 | 8.4%(+6.86)#3,150 |
| 59. | Pocasset | 15.0% | 13.4%(+1.63)#59 | 8.4%(+6.55)#3,341 |
| 60. | Fiskdale | 15.0% | 13.4%(+1.63)#60 | 8.4%(+6.54)#3,343 |
| 61. | Vineyard Haven | 14.9% | 13.4%(+1.53)#61 | 8.4%(+6.45)#3,390 |
| 62. | Longmeadow | 14.7% | 13.4%(+1.31)#62 | 8.4%(+6.23)#3,537 |
| 63. | Swampscott | 14.7% | 13.4%(+1.30)#63 | 8.4%(+6.22)#3,548 |
| 64. | Stoneham | 14.5% | 13.4%(+1.17)#64 | 8.4%(+6.09)#3,634 |
| 65. | Rockport | 14.5% | 13.4%(+1.17)#65 | 8.4%(+6.09)#3,638 |
| 66. | Lunenburg | 14.5% | 13.4%(+1.13)#66 | 8.4%(+6.05)#3,663 |
| 67. | West Concord | 14.5% | 13.4%(+1.11)#67 | 8.4%(+6.03)#3,673 |
| 68. | Belchertown | 14.4% | 13.4%(+1.05)#68 | 8.4%(+5.97)#3,701 |
| 69. | Townsend | 14.4% | 13.4%(+1.04)#69 | 8.4%(+5.96)#3,707 |
| 70. | Braintree Town | 14.4% | 13.4%(+1.04)#70 | 8.4%(+5.96)#3,708 |
| 71. | Lexington | 14.4% | 13.4%(+1.00)#71 | 8.4%(+5.92)#3,734 |
| 72. | Shelburne Falls | 14.4% | 13.4%(+0.996)#72 | 8.4%(+5.92)#3,740 |
| 73. | Rutland | 14.3% | 13.4%(+0.973)#73 | 8.4%(+5.89)#3,760 |
| 74. | East Brookfield | 14.3% | 13.4%(+0.960)#74 | 8.4%(+5.88)#3,766 |
| 75. | Mashpee Neck | 14.3% | 13.4%(+0.943)#75 | 8.4%(+5.86)#3,773 |
| 76. | Dover | 14.3% | 13.4%(+0.908)#76 | 8.4%(+5.83)#3,842 |
| 77. | Adams | 14.2% | 13.4%(+0.802)#77 | 8.4%(+5.72)#3,902 |
| 78. | Winchendon | 14.2% | 13.4%(+0.795)#78 | 8.4%(+5.71)#3,907 |
| 79. | Reading | 14.0% | 13.4%(+0.645)#79 | 8.4%(+5.57)#4,014 |
| 80. | Monument Beach | 14.0% | 13.4%(+0.630)#80 | 8.4%(+5.55)#4,025 |
| 81. | Ipswich | 13.8% | 13.4%(+0.484)#81 | 8.4%(+5.40)#4,131 |
| 82. | Cochituate | 13.8% | 13.4%(+0.401)#82 | 8.4%(+5.32)#4,182 |
| 83. | Waltham | 13.7% | 13.4%(+0.324)#83 | 8.4%(+5.24)#4,237 |
| 84. | Easthampton Town | 13.7% | 13.4%(+0.290)#84 | 8.4%(+5.21)#4,264 |
| 85. | Everett | 13.5% | 13.4%(+0.102)#85 | 8.4%(+5.02)#4,411 |
| 86. | New Seabury | 13.4% | 13.4%(-0.004)#86 | 8.4%(+4.92)#4,490 |
| 87. | Ayer | 13.3% | 13.4%(-0.031)#87 | 8.4%(+4.89)#4,506 |
| 88. | Worcester | 13.3% | 13.4%(-0.108)#88 | 8.4%(+4.81)#4,579 |
| 89. | Hopedale | 13.2% | 13.4%(-0.180)#89 | 8.4%(+4.74)#4,630 |
| 90. | Hatfield | 13.2% | 13.4%(-0.185)#90 | 8.4%(+4.73)#4,635 |
| 91. | Nahant | 13.2% | 13.4%(-0.198)#91 | 8.4%(+4.72)#4,642 |
| 92. | Quincy | 13.1% | 13.4%(-0.279)#92 | 8.4%(+4.64)#4,707 |
| 93. | Danvers | 13.0% | 13.4%(-0.397)#93 | 8.4%(+4.52)#4,802 |
| 94. | Marshfield Hills | 12.9% | 13.4%(-0.433)#94 | 8.4%(+4.49)#4,842 |
| 95. | Wareham Center | 12.9% | 13.4%(-0.458)#95 | 8.4%(+4.46)#4,873 |
| 96. | West Wareham | 12.8% | 13.4%(-0.541)#96 | 8.4%(+4.38)#4,959 |
| 97. | Barnstable Town | 12.7% | 13.4%(-0.626)#97 | 8.4%(+4.29)#5,041 |
| 98. | Norwood | 12.7% | 13.4%(-0.628)#98 | 8.4%(+4.29)#5,046 |
| 99. | Walpole | 12.6% | 13.4%(-0.719)#99 | 8.4%(+4.20)#5,133 |
| 100. | Malden | 12.6% | 13.4%(-0.799)#100 | 8.4%(+4.12)#5,194 |
Common Questions
What are the Top 10 Cities with the Highest Percentage of Not-for-profit Organizations in Massachusetts?
Top 10 Cities with the Highest Percentage of Not-for-profit Organizations in Massachusetts are:
#1
61.5%
#2
59.9%
#3
34.9%
#4
30.7%
#5
29.9%
#6
29.4%
#7
27.4%
#8
26.9%
#9
26.5%
#10
25.4%
What city has the Highest Percentage of Not-for-profit Organizations in Massachusetts?
Williamstown has the Highest Percentage of Not-for-profit Organizations in Massachusetts with 61.5%.
What is the Percentage of Not-for-profit Organizations in the State of Massachusetts?
Percentage of Not-for-profit Organizations in Massachusetts is 13.4%.
What is the Percentage of Not-for-profit Organizations in the United States?
Percentage of Not-for-profit Organizations in the United States is 8.4%.