Cities with the Highest Percentage of Immigrants from Latin America in Oregon
RELATED REPORTS & OPTIONS
Latin America
Oregon
Compare Cities
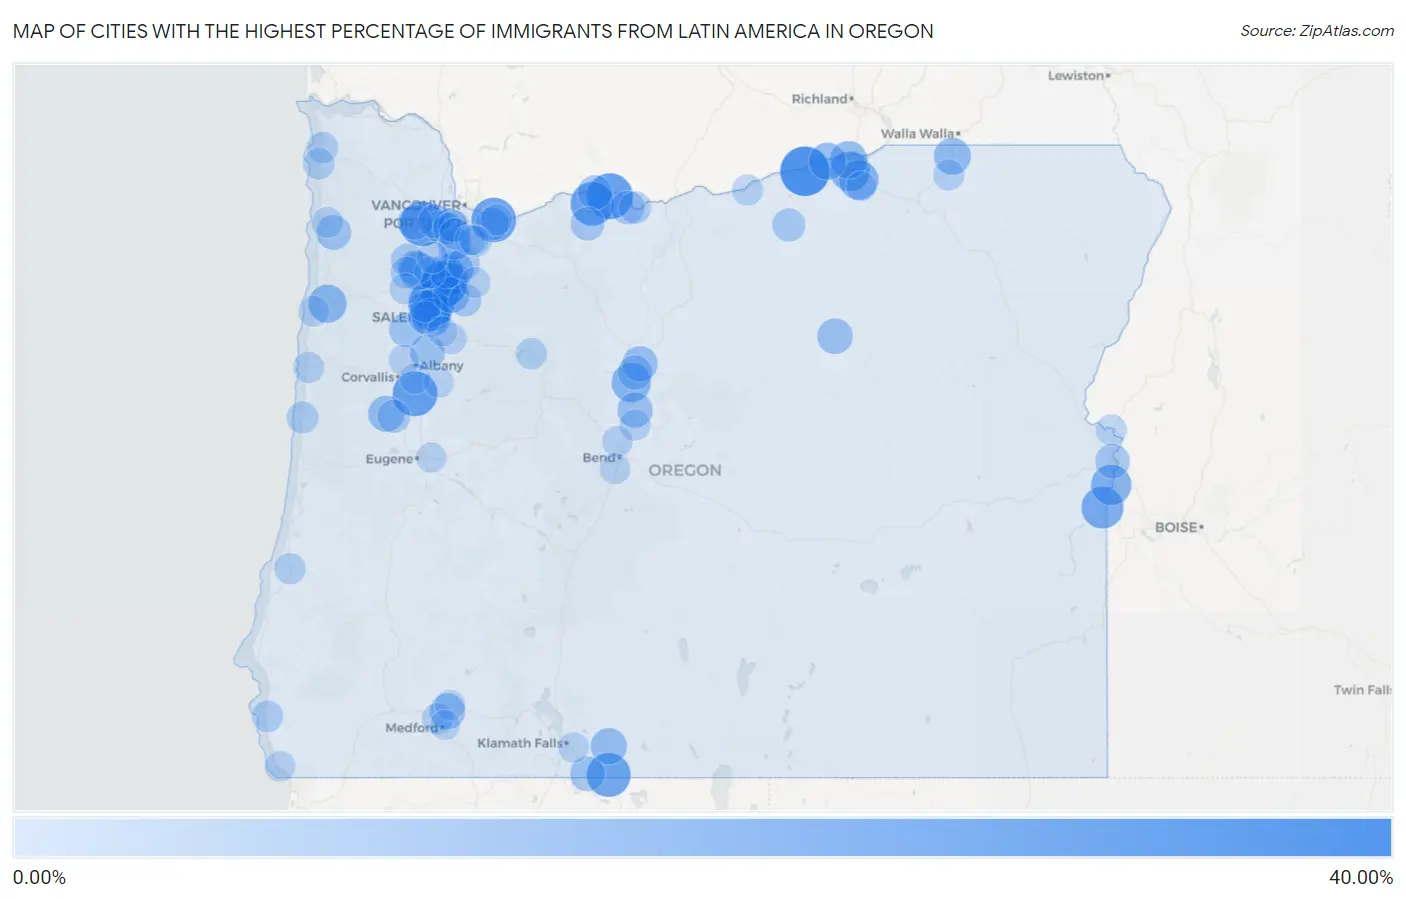
Map of Cities with the Highest Percentage of Immigrants from Latin America in Oregon
0.00%
40.00%
Cities with the Highest Percentage of Immigrants from Latin America in Oregon
| City | Latin America | vs State | vs National | |
| 1. | Boardman | 31.17% | 4.07%(+27.1)#-1 | 6.84%(+24.3)#0 |
| 2. | Woodburn | 26.79% | 4.07%(+22.7)#90 | 6.84%(+19.9)#2,734 |
| 3. | Labish Village | 25.81% | 4.07%(+21.7)#91 | 6.84%(+19.0)#2,735 |
| 4. | Mosier | 25.71% | 4.07%(+21.6)#92 | 6.84%(+18.9)#2,736 |
| 5. | Cornelius | 24.76% | 4.07%(+20.7)#93 | 6.84%(+17.9)#2,737 |
| 6. | Shedd | 24.40% | 4.07%(+20.3)#94 | 6.84%(+17.6)#2,738 |
| 7. | Wood Village | 24.01% | 4.07%(+19.9)#95 | 6.84%(+17.2)#2,739 |
| 8. | Odell | 22.94% | 4.07%(+18.9)#96 | 6.84%(+16.1)#2,740 |
| 9. | Malin | 22.93% | 4.07%(+18.9)#97 | 6.84%(+16.1)#2,741 |
| 10. | Gervais | 21.65% | 4.07%(+17.6)#98 | 6.84%(+14.8)#2,742 |
| 11. | Adrian | 20.20% | 4.07%(+16.1)#99 | 6.84%(+13.4)#2,743 |
| 12. | Hayesville | 19.72% | 4.07%(+15.6)#100 | 6.84%(+12.9)#2,744 |
| 13. | Nyssa | 17.93% | 4.07%(+13.9)#101 | 6.84%(+11.1)#2,745 |
| 14. | Hermiston | 16.95% | 4.07%(+12.9)#102 | 6.84%(+10.1)#2,746 |
| 15. | Stanfield | 16.59% | 4.07%(+12.5)#103 | 6.84%(+9.75)#2,747 |
| 16. | Culver | 16.34% | 4.07%(+12.3)#104 | 6.84%(+9.50)#2,748 |
| 17. | Four Corners | 15.13% | 4.07%(+11.1)#105 | 6.84%(+8.29)#2,749 |
| 18. | Rose Lodge | 14.69% | 4.07%(+10.6)#106 | 6.84%(+7.85)#2,750 |
| 19. | Dayton | 14.61% | 4.07%(+10.5)#107 | 6.84%(+7.77)#2,751 |
| 20. | Umatilla | 13.88% | 4.07%(+9.81)#108 | 6.84%(+7.04)#2,752 |
| 21. | Irrigon | 13.32% | 4.07%(+9.25)#109 | 6.84%(+6.48)#2,753 |
| 22. | Milton Freewater | 12.96% | 4.07%(+8.89)#110 | 6.84%(+6.12)#2,754 |
| 23. | Hubbard | 12.72% | 4.07%(+8.65)#111 | 6.84%(+5.88)#2,755 |
| 24. | Aurora | 12.51% | 4.07%(+8.44)#112 | 6.84%(+5.67)#2,756 |
| 25. | Bonanza | 12.11% | 4.07%(+8.04)#113 | 6.84%(+5.27)#2,757 |
| 26. | Alpine | 11.89% | 4.07%(+7.81)#114 | 6.84%(+5.04)#2,758 |
| 27. | Mount Angel | 11.57% | 4.07%(+7.50)#115 | 6.84%(+4.73)#2,759 |
| 28. | Monument | 11.04% | 4.07%(+6.97)#116 | 6.84%(+4.20)#2,760 |
| 29. | White City | 10.96% | 4.07%(+6.89)#117 | 6.84%(+4.12)#2,761 |
| 30. | Terrebonne | 10.71% | 4.07%(+6.64)#118 | 6.84%(+3.87)#2,762 |
| 31. | Madras | 10.66% | 4.07%(+6.59)#119 | 6.84%(+3.82)#2,763 |
| 32. | Merrill | 10.06% | 4.07%(+5.98)#120 | 6.84%(+3.21)#2,764 |
| 33. | Jefferson | 9.93% | 4.07%(+5.85)#121 | 6.84%(+3.09)#2,765 |
| 34. | Tillamook | 9.74% | 4.07%(+5.67)#122 | 6.84%(+2.90)#2,766 |
| 35. | Aloha | 9.73% | 4.07%(+5.66)#123 | 6.84%(+2.89)#2,767 |
| 36. | Forest Grove | 9.72% | 4.07%(+5.65)#124 | 6.84%(+2.88)#3,019 |
| 37. | Donald | 9.56% | 4.07%(+5.48)#125 | 6.84%(+2.72)#3,020 |
| 38. | Ontario | 9.54% | 4.07%(+5.47)#126 | 6.84%(+2.70)#3,021 |
| 39. | Lafayette | 9.45% | 4.07%(+5.38)#127 | 6.84%(+2.61)#3,022 |
| 40. | Metolius | 9.45% | 4.07%(+5.37)#128 | 6.84%(+2.61)#3,023 |
| 41. | Hood River | 9.36% | 4.07%(+5.29)#129 | 6.84%(+2.52)#3,024 |
| 42. | Independence | 9.34% | 4.07%(+5.26)#130 | 6.84%(+2.50)#3,025 |
| 43. | Hillsboro | 8.79% | 4.07%(+4.72)#131 | 6.84%(+1.95)#3,026 |
| 44. | Parkdale | 8.45% | 4.07%(+4.38)#132 | 6.84%(+1.61)#3,027 |
| 45. | Chenoweth | 8.27% | 4.07%(+4.20)#133 | 6.84%(+1.43)#3,028 |
| 46. | Gresham | 7.90% | 4.07%(+3.82)#134 | 6.84%(+1.05)#3,029 |
| 47. | Cedar Hills | 7.76% | 4.07%(+3.68)#135 | 6.84%(+0.916)#3,030 |
| 48. | Ione | 7.56% | 4.07%(+3.48)#136 | 6.84%(+0.716)#3,031 |
| 49. | Carlton | 7.48% | 4.07%(+3.41)#137 | 6.84%(+0.641)#3,032 |
| 50. | Monroe | 7.39% | 4.07%(+3.31)#138 | 6.84%(+0.545)#3,033 |
| 51. | Scotts Mills | 7.11% | 4.07%(+3.04)#139 | 6.84%(+0.268)#3,034 |
| 52. | Tualatin | 6.91% | 4.07%(+2.83)#140 | 6.84%(+0.065)#3,035 |
| 53. | Salem | 6.75% | 4.07%(+2.68)#141 | 6.84%(-0.090)#3,036 |
| 54. | Canby | 6.63% | 4.07%(+2.55)#142 | 6.84%(-0.215)#3,037 |
| 55. | Durham | 6.61% | 4.07%(+2.54)#143 | 6.84%(-0.228)#3,038 |
| 56. | Keizer | 6.54% | 4.07%(+2.46)#144 | 6.84%(-0.305)#3,039 |
| 57. | The Dalles | 6.35% | 4.07%(+2.28)#145 | 6.84%(-0.486)#3,040 |
| 58. | Yachats | 5.83% | 4.07%(+1.76)#146 | 6.84%(-1.01)#3,041 |
| 59. | Fort Klamath | 5.77% | 4.07%(+1.70)#147 | 6.84%(-1.07)#3,042 |
| 60. | Beaverton | 5.67% | 4.07%(+1.60)#148 | 6.84%(-1.17)#3,043 |
| 61. | West Slope | 5.66% | 4.07%(+1.58)#149 | 6.84%(-1.18)#3,044 |
| 62. | Gold Beach | 5.53% | 4.07%(+1.45)#150 | 6.84%(-1.31)#3,045 |
| 63. | St Paul | 5.49% | 4.07%(+1.41)#151 | 6.84%(-1.35)#3,046 |
| 64. | Mcminnville | 5.47% | 4.07%(+1.40)#152 | 6.84%(-1.37)#3,047 |
| 65. | Newberg | 5.38% | 4.07%(+1.31)#153 | 6.84%(-1.46)#3,048 |
| 66. | Seaside | 5.22% | 4.07%(+1.15)#154 | 6.84%(-1.62)#3,049 |
| 67. | Cannon Beach | 5.19% | 4.07%(+1.12)#155 | 6.84%(-1.65)#3,050 |
| 68. | Metzger | 5.16% | 4.07%(+1.09)#156 | 6.84%(-1.68)#3,051 |
| 69. | Bunker Hill | 5.04% | 4.07%(+0.967)#157 | 6.84%(-1.80)#3,052 |
| 70. | Troutdale | 5.02% | 4.07%(+0.948)#158 | 6.84%(-1.82)#3,053 |
| 71. | Idanha | 4.96% | 4.07%(+0.891)#159 | 6.84%(-1.88)#3,054 |
| 72. | Newport | 4.92% | 4.07%(+0.850)#160 | 6.84%(-1.92)#3,055 |
| 73. | Central Point | 4.82% | 4.07%(+0.743)#161 | 6.84%(-2.02)#3,056 |
| 74. | Annex | 4.80% | 4.07%(+0.731)#162 | 6.84%(-2.04)#3,057 |
| 75. | Stayton | 4.79% | 4.07%(+0.714)#163 | 6.84%(-2.05)#3,058 |
| 76. | Amity | 4.76% | 4.07%(+0.689)#164 | 6.84%(-2.08)#3,059 |
| 77. | Weston | 4.76% | 4.07%(+0.689)#165 | 6.84%(-2.08)#3,060 |
| 78. | Johnson City | 4.65% | 4.07%(+0.578)#166 | 6.84%(-2.19)#3,061 |
| 79. | Bay City | 4.63% | 4.07%(+0.558)#167 | 6.84%(-2.21)#3,062 |
| 80. | Redmond | 4.61% | 4.07%(+0.533)#168 | 6.84%(-2.23)#3,063 |
| 81. | Arlington | 4.56% | 4.07%(+0.486)#169 | 6.84%(-2.28)#3,064 |
| 82. | Marlene | 4.50% | 4.07%(+0.429)#170 | 6.84%(-2.34)#3,065 |
| 83. | Lincoln City | 4.39% | 4.07%(+0.319)#171 | 6.84%(-2.45)#3,066 |
| 84. | Deschutes River Woods | 4.27% | 4.07%(+0.198)#172 | 6.84%(-2.57)#3,067 |
| 85. | Molalla | 4.23% | 4.07%(+0.155)#173 | 6.84%(-2.61)#3,068 |
| 86. | Tumalo | 4.22% | 4.07%(+0.148)#174 | 6.84%(-2.62)#3,069 |
| 87. | Oak Grove | 4.20% | 4.07%(+0.130)#175 | 6.84%(-2.64)#3,070 |
| 88. | Bayshore | 4.08% | 4.07%(+0.006)#176 | 6.84%(-2.76)#3,071 |
| 89. | Altamont | 4.05% | 4.07%(-0.028)#177 | 6.84%(-2.80)#3,072 |
| 90. | Brookings | 4.03% | 4.07%(-0.040)#178 | 6.84%(-2.81)#3,073 |
| 91. | San Marine | 3.98% | 4.07%(-0.096)#179 | 6.84%(-2.86)#3,074 |
| 92. | Adair Village | 3.97% | 4.07%(-0.107)#180 | 6.84%(-2.87)#3,075 |
| 93. | Oatfield | 3.89% | 4.07%(-0.187)#181 | 6.84%(-2.95)#3,076 |
| 94. | Tangent | 3.77% | 4.07%(-0.301)#182 | 6.84%(-3.07)#3,077 |
| 95. | Springfield | 3.71% | 4.07%(-0.366)#183 | 6.84%(-3.13)#3,078 |
| 96. | Eagle Point | 3.65% | 4.07%(-0.427)#184 | 6.84%(-3.19)#3,079 |
| 97. | Aumsville | 3.63% | 4.07%(-0.447)#185 | 6.84%(-3.21)#3,080 |
| 98. | Lebanon | 3.58% | 4.07%(-0.496)#186 | 6.84%(-3.26)#3,081 |
| 99. | Echo | 3.56% | 4.07%(-0.517)#187 | 6.84%(-3.28)#3,082 |
| 100. | Medford | 3.47% | 4.07%(-0.601)#188 | 6.84%(-3.37)#3,083 |
Common Questions
What are the Top 10 Cities with the Highest Percentage of Immigrants from Latin America in Oregon?
Top 10 Cities with the Highest Percentage of Immigrants from Latin America in Oregon are:
#1
31.17%
#2
26.79%
#3
25.81%
#4
25.71%
#5
24.76%
#6
24.40%
#7
24.01%
#8
22.94%
#9
22.93%
#10
21.65%
What city has the Highest Percentage of Immigrants from Latin America in Oregon?
Boardman has the Highest Percentage of Immigrants from Latin America in Oregon with 31.17%.
What is the Percentage of Immigrants from Latin America in the State of Oregon?
Percentage of Immigrants from Latin America in Oregon is 4.07%.
What is the Percentage of Immigrants from Latin America in the United States?
Percentage of Immigrants from Latin America in the United States is 6.84%.