Cities with the Highest Percentage of Immigrants from Latin America in South Carolina
RELATED REPORTS & OPTIONS
Latin America
South Carolina
Compare Cities
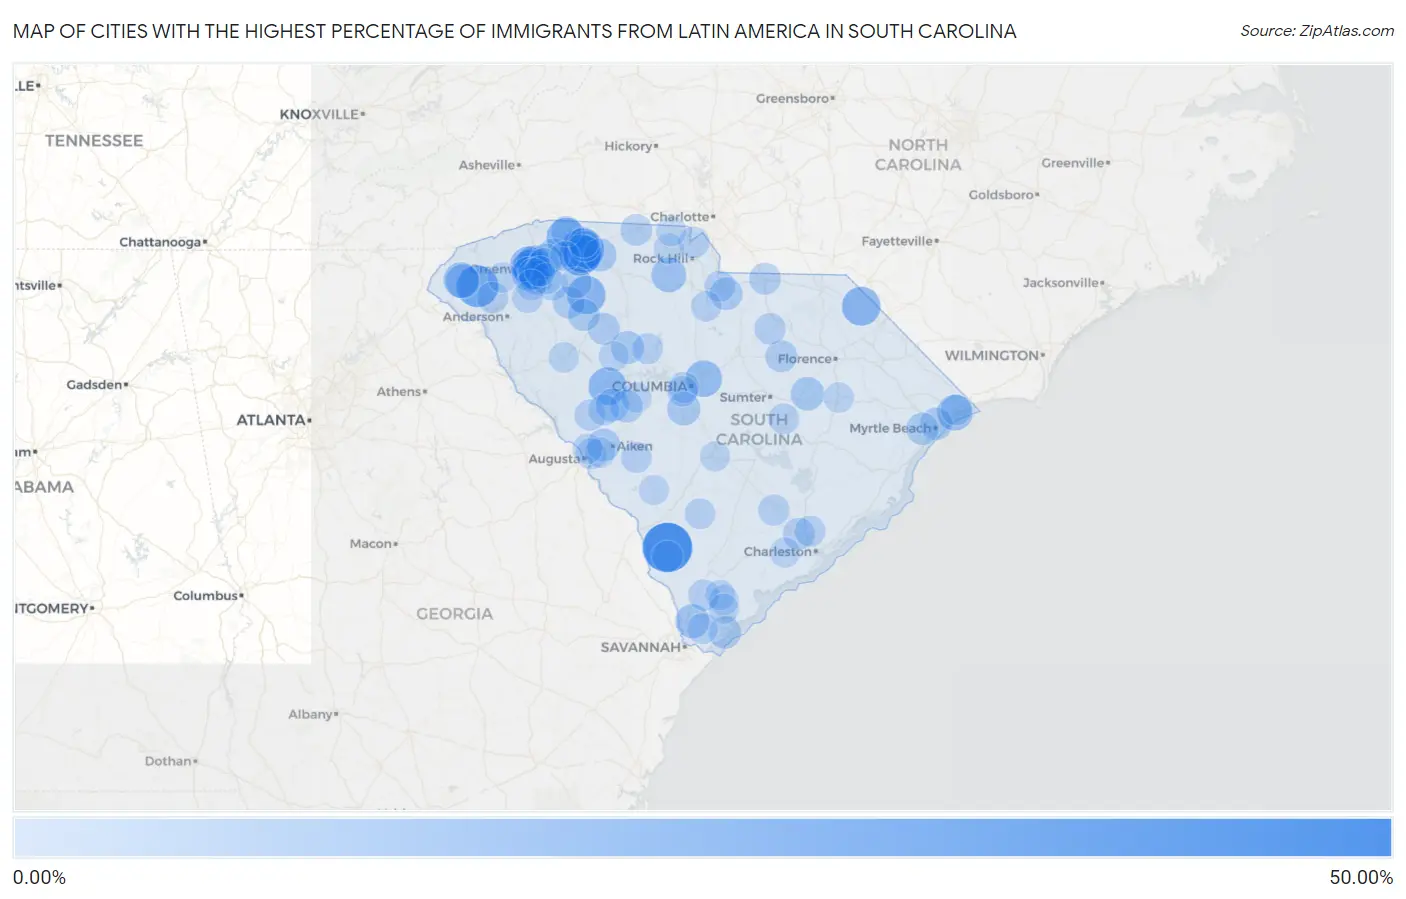
Map of Cities with the Highest Percentage of Immigrants from Latin America in South Carolina
0.00%
50.00%
Cities with the Highest Percentage of Immigrants from Latin America in South Carolina
| City | Latin America | vs State | vs National | |
| 1. | Luray | 40.34% | 2.63%(+37.7)#-1 | 6.84%(+33.5)#0 |
| 2. | Southern Shops | 27.36% | 2.63%(+24.7)#0 | 6.84%(+20.5)#1 |
| 3. | Conestee | 25.83% | 2.63%(+23.2)#1 | 6.84%(+19.0)#2 |
| 4. | Newry | 25.22% | 2.63%(+22.6)#2 | 6.84%(+18.4)#3 |
| 5. | Fairforest | 23.55% | 2.63%(+20.9)#3 | 6.84%(+16.7)#4 |
| 6. | Gramling | 20.25% | 2.63%(+17.6)#4 | 6.84%(+13.4)#5 |
| 7. | Clio | 19.00% | 2.63%(+16.4)#5 | 6.84%(+12.2)#6 |
| 8. | Arcadia | 18.94% | 2.63%(+16.3)#6 | 6.84%(+12.1)#7 |
| 9. | Enoree | 18.59% | 2.63%(+16.0)#7 | 6.84%(+11.8)#8 |
| 10. | City View | 17.98% | 2.63%(+15.4)#8 | 6.84%(+11.1)#9 |
| 11. | Saluda | 17.70% | 2.63%(+15.1)#9 | 6.84%(+10.9)#10 |
| 12. | Sandy Springs | 16.49% | 2.63%(+13.9)#10 | 6.84%(+9.65)#11 |
| 13. | Judson | 16.44% | 2.63%(+13.8)#11 | 6.84%(+9.60)#12 |
| 14. | Berea | 15.95% | 2.63%(+13.3)#12 | 6.84%(+9.11)#13 |
| 15. | Woodfield | 14.75% | 2.63%(+12.1)#13 | 6.84%(+7.91)#14 |
| 16. | Parker | 13.91% | 2.63%(+11.3)#14 | 6.84%(+7.07)#15 |
| 17. | Atlantic Beach | 13.55% | 2.63%(+10.9)#15 | 6.84%(+6.71)#16 |
| 18. | Walhalla | 13.09% | 2.63%(+10.5)#16 | 6.84%(+6.25)#17 |
| 19. | Unity | 11.85% | 2.63%(+9.22)#17 | 6.84%(+5.01)#18 |
| 20. | Lowrys | 11.78% | 2.63%(+9.16)#18 | 6.84%(+4.94)#19 |
| 21. | West Union | 10.66% | 2.63%(+8.04)#19 | 6.84%(+3.82)#20 |
| 22. | Hardeeville | 10.59% | 2.63%(+7.96)#20 | 6.84%(+3.75)#21 |
| 23. | Sans Souci | 10.31% | 2.63%(+7.68)#21 | 6.84%(+3.47)#22 |
| 24. | Welcome | 10.05% | 2.63%(+7.42)#22 | 6.84%(+3.21)#23 |
| 25. | Saxon | 9.47% | 2.63%(+6.84)#23 | 6.84%(+2.63)#24 |
| 26. | Gantt | 9.41% | 2.63%(+6.78)#24 | 6.84%(+2.57)#25 |
| 27. | Arkwright | 9.39% | 2.63%(+6.76)#25 | 6.84%(+2.55)#26 |
| 28. | Shiloh | 9.23% | 2.63%(+6.60)#26 | 6.84%(+2.39)#27 |
| 29. | Gaston | 9.04% | 2.63%(+6.41)#27 | 6.84%(+2.20)#28 |
| 30. | Ward | 8.33% | 2.63%(+5.71)#28 | 6.84%(+1.49)#29 |
| 31. | Greer | 8.32% | 2.63%(+5.69)#29 | 6.84%(+1.48)#2,000 |
| 32. | Glendale | 8.27% | 2.63%(+5.64)#30 | 6.84%(+1.43)#2,001 |
| 33. | Newberry | 8.20% | 2.63%(+5.57)#31 | 6.84%(+1.36)#2,002 |
| 34. | Graniteville | 8.07% | 2.63%(+5.45)#32 | 6.84%(+1.23)#2,003 |
| 35. | Elgin | 7.74% | 2.63%(+5.11)#33 | 6.84%(+0.897)#2,004 |
| 36. | Taylors | 7.69% | 2.63%(+5.06)#34 | 6.84%(+0.845)#2,005 |
| 37. | Monetta | 7.61% | 2.63%(+4.98)#35 | 6.84%(+0.768)#2,006 |
| 38. | Myrtle Beach | 7.45% | 2.63%(+4.82)#36 | 6.84%(+0.610)#2,007 |
| 39. | Hilton Head Island | 7.23% | 2.63%(+4.61)#37 | 6.84%(+0.394)#2,506 |
| 40. | Socastee | 7.16% | 2.63%(+4.53)#38 | 6.84%(+0.321)#2,507 |
| 41. | Camp Croft | 7.09% | 2.63%(+4.46)#39 | 6.84%(+0.247)#2,508 |
| 42. | Joanna | 6.61% | 2.63%(+3.99)#40 | 6.84%(-0.226)#2,509 |
| 43. | Gray Court | 6.56% | 2.63%(+3.93)#41 | 6.84%(-0.285)#2,510 |
| 44. | Bishopville | 6.50% | 2.63%(+3.87)#42 | 6.84%(-0.344)#2,511 |
| 45. | Watts Mills | 6.46% | 2.63%(+3.83)#43 | 6.84%(-0.383)#2,512 |
| 46. | North Charleston | 5.97% | 2.63%(+3.34)#44 | 6.84%(-0.874)#2,513 |
| 47. | Pageland | 5.94% | 2.63%(+3.32)#45 | 6.84%(-0.898)#2,514 |
| 48. | Blacksburg | 5.91% | 2.63%(+3.28)#46 | 6.84%(-0.931)#2,515 |
| 49. | Pendleton | 5.49% | 2.63%(+2.86)#47 | 6.84%(-1.35)#2,516 |
| 50. | Carolina Forest | 5.38% | 2.63%(+2.75)#48 | 6.84%(-1.46)#2,517 |
| 51. | Hamer | 5.26% | 2.63%(+2.64)#49 | 6.84%(-1.58)#2,518 |
| 52. | Bethune | 5.07% | 2.63%(+2.44)#50 | 6.84%(-1.77)#2,519 |
| 53. | Simpsonville | 5.00% | 2.63%(+2.37)#51 | 6.84%(-1.84)#2,520 |
| 54. | Tega Cay | 4.97% | 2.63%(+2.34)#52 | 6.84%(-1.87)#2,521 |
| 55. | Estill | 4.93% | 2.63%(+2.31)#53 | 6.84%(-1.91)#2,522 |
| 56. | Edgefield | 4.91% | 2.63%(+2.28)#54 | 6.84%(-1.93)#2,523 |
| 57. | Clearwater | 4.91% | 2.63%(+2.28)#55 | 6.84%(-1.93)#2,524 |
| 58. | Johnston | 4.88% | 2.63%(+2.26)#56 | 6.84%(-1.96)#2,525 |
| 59. | Ridgeland | 4.87% | 2.63%(+2.24)#57 | 6.84%(-1.97)#2,526 |
| 60. | West Columbia | 4.85% | 2.63%(+2.22)#58 | 6.84%(-2.00)#2,527 |
| 61. | Wade Hampton | 4.78% | 2.63%(+2.16)#59 | 6.84%(-2.06)#2,528 |
| 62. | Ridgeville | 4.78% | 2.63%(+2.15)#60 | 6.84%(-2.06)#2,529 |
| 63. | West Pelzer | 4.76% | 2.63%(+2.13)#61 | 6.84%(-2.08)#2,530 |
| 64. | Dunean | 4.67% | 2.63%(+2.04)#62 | 6.84%(-2.17)#2,531 |
| 65. | Mauldin | 4.64% | 2.63%(+2.02)#63 | 6.84%(-2.20)#2,532 |
| 66. | Lancaster | 4.60% | 2.63%(+1.97)#64 | 6.84%(-2.24)#2,533 |
| 67. | Hanahan | 4.51% | 2.63%(+1.88)#65 | 6.84%(-2.34)#2,534 |
| 68. | Windsor | 4.42% | 2.63%(+1.79)#66 | 6.84%(-2.42)#2,535 |
| 69. | Pomaria | 4.40% | 2.63%(+1.77)#67 | 6.84%(-2.45)#2,536 |
| 70. | Whitney | 4.26% | 2.63%(+1.63)#68 | 6.84%(-2.58)#2,537 |
| 71. | Bluffton | 4.23% | 2.63%(+1.61)#69 | 6.84%(-2.61)#2,538 |
| 72. | Woodruff | 4.22% | 2.63%(+1.60)#70 | 6.84%(-2.62)#2,539 |
| 73. | Alcolu | 4.16% | 2.63%(+1.53)#71 | 6.84%(-2.68)#2,540 |
| 74. | Lodge | 4.12% | 2.63%(+1.49)#72 | 6.84%(-2.72)#2,541 |
| 75. | Golden Grove | 4.11% | 2.63%(+1.49)#73 | 6.84%(-2.73)#2,542 |
| 76. | North Myrtle Beach | 3.98% | 2.63%(+1.36)#74 | 6.84%(-2.86)#2,543 |
| 77. | Great Falls | 3.83% | 2.63%(+1.21)#75 | 6.84%(-3.01)#2,544 |
| 78. | Valley Falls | 3.81% | 2.63%(+1.19)#76 | 6.84%(-3.03)#2,545 |
| 79. | Campobello | 3.81% | 2.63%(+1.18)#77 | 6.84%(-3.03)#2,546 |
| 80. | Springdale | 3.73% | 2.63%(+1.10)#78 | 6.84%(-3.12)#2,547 |
| 81. | Greenville | 3.60% | 2.63%(+0.977)#79 | 6.84%(-3.24)#2,548 |
| 82. | Langley | 3.60% | 2.63%(+0.976)#80 | 6.84%(-3.24)#2,549 |
| 83. | East Camden | 3.60% | 2.63%(+0.972)#81 | 6.84%(-3.24)#2,550 |
| 84. | Liberty | 3.54% | 2.63%(+0.917)#82 | 6.84%(-3.30)#2,551 |
| 85. | York | 3.52% | 2.63%(+0.888)#83 | 6.84%(-3.33)#2,552 |
| 86. | Boiling Springs | 3.50% | 2.63%(+0.875)#84 | 6.84%(-3.34)#2,553 |
| 87. | Scranton | 3.46% | 2.63%(+0.829)#85 | 6.84%(-3.38)#2,554 |
| 88. | Silverstreet | 3.40% | 2.63%(+0.774)#86 | 6.84%(-3.44)#2,555 |
| 89. | Greenwood | 3.37% | 2.63%(+0.742)#87 | 6.84%(-3.47)#2,556 |
| 90. | Batesburg Leesville | 3.34% | 2.63%(+0.710)#88 | 6.84%(-3.50)#2,557 |
| 91. | Belvedere | 3.30% | 2.63%(+0.674)#89 | 6.84%(-3.54)#2,558 |
| 92. | Burton | 3.24% | 2.63%(+0.608)#90 | 6.84%(-3.61)#2,559 |
| 93. | White Knoll | 3.22% | 2.63%(+0.588)#91 | 6.84%(-3.63)#2,560 |
| 94. | Ravenel | 3.19% | 2.63%(+0.561)#92 | 6.84%(-3.65)#2,561 |
| 95. | Laurel Bay | 3.14% | 2.63%(+0.511)#93 | 6.84%(-3.70)#2,562 |
| 96. | Port Royal | 3.14% | 2.63%(+0.509)#94 | 6.84%(-3.70)#2,992 |
| 97. | Clover | 3.10% | 2.63%(+0.476)#95 | 6.84%(-3.74)#2,993 |
| 98. | Duncan | 3.08% | 2.63%(+0.457)#96 | 6.84%(-3.76)#2,994 |
| 99. | Barnwell | 3.08% | 2.63%(+0.452)#97 | 6.84%(-3.76)#2,995 |
| 100. | Wilkinson Heights | 3.07% | 2.63%(+0.447)#98 | 6.84%(-3.77)#2,996 |
Common Questions
What are the Top 10 Cities with the Highest Percentage of Immigrants from Latin America in South Carolina?
Top 10 Cities with the Highest Percentage of Immigrants from Latin America in South Carolina are:
#1
40.34%
#2
27.36%
#3
25.22%
#4
23.55%
#5
20.25%
#6
19.00%
#7
18.94%
#8
18.59%
#9
17.98%
#10
17.70%
What city has the Highest Percentage of Immigrants from Latin America in South Carolina?
Luray has the Highest Percentage of Immigrants from Latin America in South Carolina with 40.34%.
What is the Percentage of Immigrants from Latin America in the State of South Carolina?
Percentage of Immigrants from Latin America in South Carolina is 2.63%.
What is the Percentage of Immigrants from Latin America in the United States?
Percentage of Immigrants from Latin America in the United States is 6.84%.