Cities with the Highest Percentage of Immigrants from Latin America in Tennessee
RELATED REPORTS & OPTIONS
Latin America
Tennessee
Compare Cities
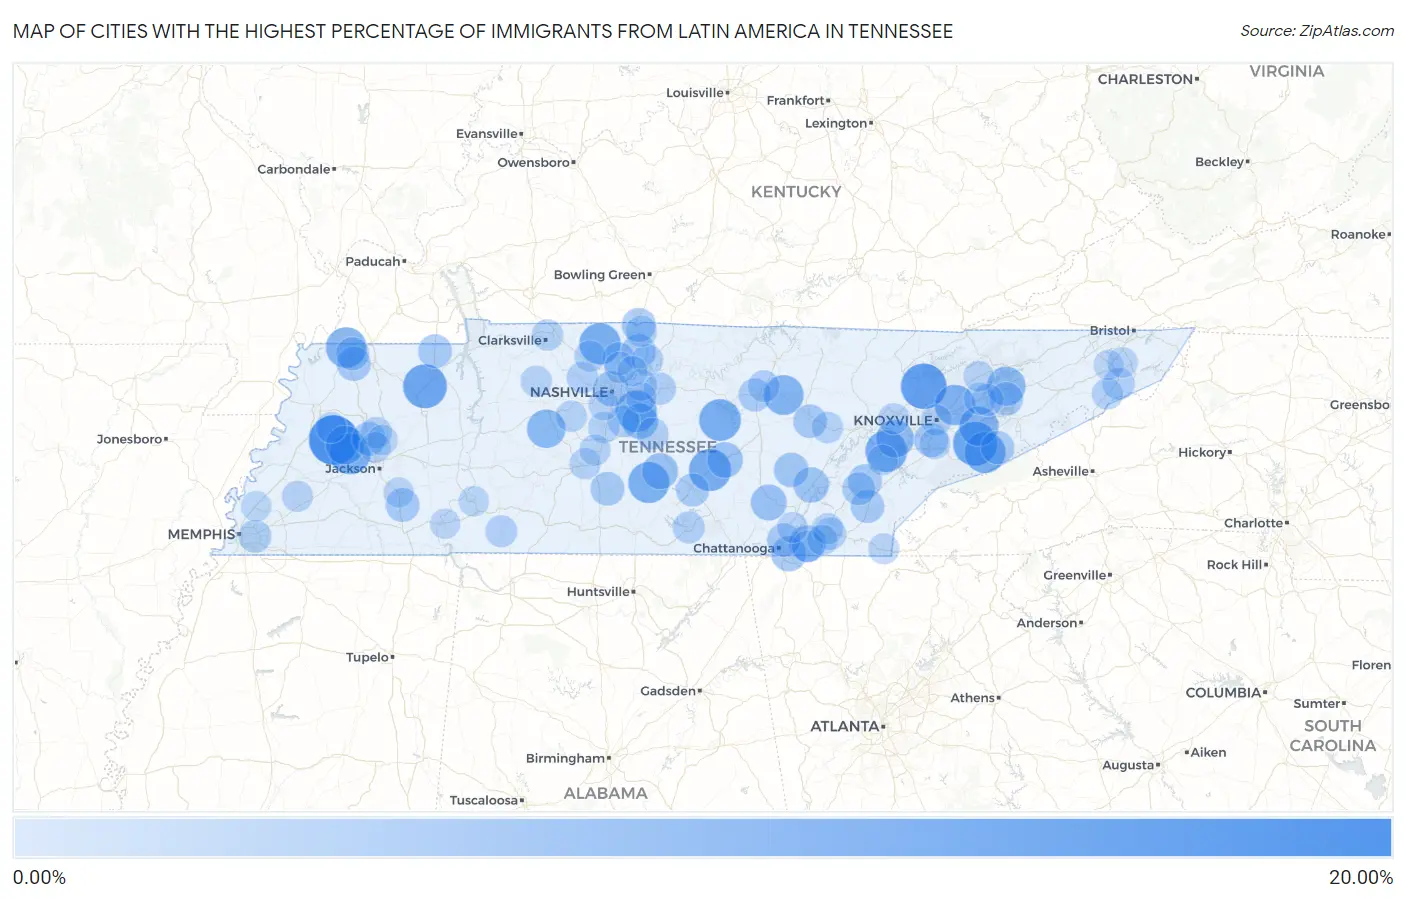
Map of Cities with the Highest Percentage of Immigrants from Latin America in Tennessee
0.00%
20.00%
Cities with the Highest Percentage of Immigrants from Latin America in Tennessee
| City | Latin America | vs State | vs National | |
| 1. | Maury City | 16.11% | 2.47%(+13.6)#-1 | 6.84%(+9.27)#0 |
| 2. | Andersonville | 13.14% | 2.47%(+10.7)#0 | 6.84%(+6.30)#1 |
| 3. | Pigeon Forge | 11.96% | 2.47%(+9.49)#3 | 6.84%(+5.12)#400 |
| 4. | Henry | 11.83% | 2.47%(+9.35)#4 | 6.84%(+4.99)#401 |
| 5. | Morrison | 10.60% | 2.47%(+8.13)#5 | 6.84%(+3.76)#402 |
| 6. | Loudon | 10.38% | 2.47%(+7.91)#7 | 6.84%(+3.54)#681 |
| 7. | Smithville | 10.32% | 2.47%(+7.84)#8 | 6.84%(+3.48)#682 |
| 8. | La Vergne | 10.10% | 2.47%(+7.63)#9 | 6.84%(+3.26)#683 |
| 9. | Springfield | 10.07% | 2.47%(+7.60)#10 | 6.84%(+3.23)#684 |
| 10. | Gatlinburg | 9.90% | 2.47%(+7.43)#11 | 6.84%(+3.06)#685 |
| 11. | Bells | 9.87% | 2.47%(+7.40)#12 | 6.84%(+3.03)#686 |
| 12. | Shelbyville | 9.81% | 2.47%(+7.33)#13 | 6.84%(+2.97)#687 |
| 13. | Woodland Mills | 9.49% | 2.47%(+7.02)#14 | 6.84%(+2.65)#688 |
| 14. | Mascot | 9.32% | 2.47%(+6.84)#15 | 6.84%(+2.48)#689 |
| 15. | Monterey | 8.87% | 2.47%(+6.40)#16 | 6.84%(+2.03)#690 |
| 16. | Sevierville | 8.67% | 2.47%(+6.20)#17 | 6.84%(+1.83)#691 |
| 17. | Alamo | 8.23% | 2.47%(+5.76)#18 | 6.84%(+1.39)#692 |
| 18. | Morristown | 8.12% | 2.47%(+5.65)#19 | 6.84%(+1.28)#693 |
| 19. | Wrigley | 8.00% | 2.47%(+5.53)#20 | 6.84%(+1.16)#694 |
| 20. | Lenoir City | 7.44% | 2.47%(+4.97)#21 | 6.84%(+0.603)#695 |
| 21. | Ooltewah | 6.71% | 2.47%(+4.24)#22 | 6.84%(-0.131)#696 |
| 22. | Smyrna | 6.15% | 2.47%(+3.67)#23 | 6.84%(-0.693)#1,977 |
| 23. | Bell Buckle | 6.12% | 2.47%(+3.65)#24 | 6.84%(-0.722)#1,978 |
| 24. | Dunlap | 6.12% | 2.47%(+3.64)#25 | 6.84%(-0.723)#1,979 |
| 25. | Mcminnville | 5.99% | 2.47%(+3.52)#26 | 6.84%(-0.851)#1,980 |
| 26. | Dayton | 5.72% | 2.47%(+3.24)#27 | 6.84%(-1.13)#1,981 |
| 27. | East Ridge | 5.65% | 2.47%(+3.18)#28 | 6.84%(-1.19)#1,982 |
| 28. | Nashville | 5.62% | 2.47%(+3.15)#29 | 6.84%(-1.22)#2,459 |
| 29. | Pikeville | 5.19% | 2.47%(+2.72)#30 | 6.84%(-1.65)#2,460 |
| 30. | Cottontown | 4.93% | 2.47%(+2.45)#31 | 6.84%(-1.91)#2,461 |
| 31. | Rives | 4.90% | 2.47%(+2.43)#32 | 6.84%(-1.94)#2,462 |
| 32. | Alcoa | 4.86% | 2.47%(+2.38)#33 | 6.84%(-1.98)#2,463 |
| 33. | Mitchellville | 4.73% | 2.47%(+2.26)#34 | 6.84%(-2.11)#2,464 |
| 34. | Niota | 4.68% | 2.47%(+2.21)#35 | 6.84%(-2.16)#2,465 |
| 35. | Finger | 4.68% | 2.47%(+2.20)#36 | 6.84%(-2.17)#2,466 |
| 36. | Lewisburg | 4.65% | 2.47%(+2.18)#37 | 6.84%(-2.19)#2,467 |
| 37. | Puryear | 4.63% | 2.47%(+2.16)#38 | 6.84%(-2.21)#2,468 |
| 38. | Humboldt | 4.57% | 2.47%(+2.10)#39 | 6.84%(-2.27)#2,469 |
| 39. | Etowah | 4.45% | 2.47%(+1.98)#40 | 6.84%(-2.39)#2,470 |
| 40. | Crossville | 4.44% | 2.47%(+1.96)#41 | 6.84%(-2.40)#2,471 |
| 41. | White Pine | 4.39% | 2.47%(+1.92)#42 | 6.84%(-2.45)#2,472 |
| 42. | Chattanooga | 4.27% | 2.47%(+1.79)#43 | 6.84%(-2.57)#3,133 |
| 43. | Pittman Center | 4.23% | 2.47%(+1.76)#44 | 6.84%(-2.61)#3,134 |
| 44. | Manchester | 4.15% | 2.47%(+1.68)#45 | 6.84%(-2.69)#3,135 |
| 45. | Union City | 4.13% | 2.47%(+1.66)#46 | 6.84%(-2.71)#3,136 |
| 46. | Cookeville | 4.12% | 2.47%(+1.65)#47 | 6.84%(-2.72)#3,137 |
| 47. | Athens | 4.03% | 2.47%(+1.56)#48 | 6.84%(-2.81)#3,138 |
| 48. | Millersville | 3.99% | 2.47%(+1.51)#49 | 6.84%(-2.85)#3,139 |
| 49. | Memphis | 3.86% | 2.47%(+1.38)#50 | 6.84%(-2.98)#3,140 |
| 50. | East Cleveland | 3.49% | 2.47%(+1.02)#51 | 6.84%(-3.35)#3,141 |
| 51. | New Market | 3.47% | 2.47%(+0.997)#52 | 6.84%(-3.37)#3,142 |
| 52. | Lebanon | 3.37% | 2.47%(+0.895)#53 | 6.84%(-3.47)#3,143 |
| 53. | Murfreesboro | 3.35% | 2.47%(+0.872)#54 | 6.84%(-3.49)#3,144 |
| 54. | Unicoi | 3.31% | 2.47%(+0.840)#55 | 6.84%(-3.53)#3,145 |
| 55. | Winchester | 3.27% | 2.47%(+0.796)#56 | 6.84%(-3.57)#3,146 |
| 56. | Jefferson City | 3.22% | 2.47%(+0.744)#57 | 6.84%(-3.62)#3,147 |
| 57. | Collinwood | 3.19% | 2.47%(+0.712)#58 | 6.84%(-3.65)#3,148 |
| 58. | Mount Juliet | 3.13% | 2.47%(+0.661)#59 | 6.84%(-3.71)#3,149 |
| 59. | Algood | 3.12% | 2.47%(+0.645)#60 | 6.84%(-3.72)#3,150 |
| 60. | Ashland City | 3.11% | 2.47%(+0.634)#61 | 6.84%(-3.73)#3,151 |
| 61. | Nolensville | 3.06% | 2.47%(+0.586)#62 | 6.84%(-3.78)#3,152 |
| 62. | Goodlettsville | 3.06% | 2.47%(+0.583)#63 | 6.84%(-3.78)#3,153 |
| 63. | Gallatin | 3.06% | 2.47%(+0.583)#64 | 6.84%(-3.78)#3,154 |
| 64. | Collegedale | 3.01% | 2.47%(+0.535)#65 | 6.84%(-3.83)#3,155 |
| 65. | Crab Orchard | 3.00% | 2.47%(+0.521)#66 | 6.84%(-3.85)#3,156 |
| 66. | Portland | 2.92% | 2.47%(+0.448)#67 | 6.84%(-3.92)#3,157 |
| 67. | Gibson | 2.89% | 2.47%(+0.419)#68 | 6.84%(-3.95)#3,158 |
| 68. | Franklin | 2.87% | 2.47%(+0.398)#69 | 6.84%(-3.97)#3,159 |
| 69. | Erwin | 2.87% | 2.47%(+0.397)#70 | 6.84%(-3.97)#3,160 |
| 70. | Fairview | 2.85% | 2.47%(+0.373)#71 | 6.84%(-3.99)#3,161 |
| 71. | Clarksville | 2.83% | 2.47%(+0.357)#72 | 6.84%(-4.01)#3,162 |
| 72. | Coopertown | 2.82% | 2.47%(+0.348)#73 | 6.84%(-4.02)#3,163 |
| 73. | Vanleer | 2.81% | 2.47%(+0.336)#74 | 6.84%(-4.03)#3,164 |
| 74. | Cleveland | 2.77% | 2.47%(+0.294)#75 | 6.84%(-4.07)#3,165 |
| 75. | Columbia | 2.74% | 2.47%(+0.269)#76 | 6.84%(-4.10)#3,166 |
| 76. | Spring Hill | 2.70% | 2.47%(+0.227)#77 | 6.84%(-4.14)#3,167 |
| 77. | Knoxville | 2.68% | 2.47%(+0.202)#78 | 6.84%(-4.16)#3,168 |
| 78. | Oak Ridge | 2.66% | 2.47%(+0.190)#79 | 6.84%(-4.18)#3,169 |
| 79. | Three Way | 2.62% | 2.47%(+0.147)#80 | 6.84%(-4.22)#3,170 |
| 80. | Mason | 2.62% | 2.47%(+0.147)#81 | 6.84%(-4.22)#3,171 |
| 81. | Gladeville | 2.61% | 2.47%(+0.132)#82 | 6.84%(-4.24)#3,172 |
| 82. | Valley Forge | 2.55% | 2.47%(+0.073)#83 | 6.84%(-4.29)#3,173 |
| 83. | Ducktown | 2.54% | 2.47%(+0.070)#84 | 6.84%(-4.30)#3,174 |
| 84. | Friendship | 2.53% | 2.47%(+0.056)#85 | 6.84%(-4.31)#3,175 |
| 85. | Middle Valley | 2.51% | 2.47%(+0.039)#86 | 6.84%(-4.33)#3,176 |
| 86. | Eagleton Village | 2.48% | 2.47%(+0.003)#87 | 6.84%(-4.36)#3,177 |
| 87. | Rutledge | 2.45% | 2.47%(-0.022)#88 | 6.84%(-4.39)#3,178 |
| 88. | Forest Hills | 2.44% | 2.47%(-0.036)#89 | 6.84%(-4.40)#3,179 |
| 89. | South Cleveland | 2.43% | 2.47%(-0.039)#90 | 6.84%(-4.41)#3,180 |
| 90. | Medina | 2.36% | 2.47%(-0.111)#91 | 6.84%(-4.48)#3,181 |
| 91. | Finley | 2.35% | 2.47%(-0.121)#92 | 6.84%(-4.49)#3,182 |
| 92. | Rural Hill | 2.33% | 2.47%(-0.143)#93 | 6.84%(-4.51)#3,183 |
| 93. | Philadelphia | 2.29% | 2.47%(-0.181)#94 | 6.84%(-4.55)#3,184 |
| 94. | Hendersonville | 2.29% | 2.47%(-0.185)#95 | 6.84%(-4.55)#3,185 |
| 95. | Watauga | 2.24% | 2.47%(-0.233)#96 | 6.84%(-4.60)#3,186 |
| 96. | Clifton | 2.21% | 2.47%(-0.262)#97 | 6.84%(-4.63)#3,187 |
| 97. | Johnson City | 2.18% | 2.47%(-0.289)#98 | 6.84%(-4.66)#3,188 |
| 98. | Millington | 2.17% | 2.47%(-0.305)#99 | 6.84%(-4.67)#3,189 |
| 99. | Henderson | 2.10% | 2.47%(-0.372)#100 | 6.84%(-4.74)#3,190 |
| 100. | Savannah | 2.07% | 2.47%(-0.406)#101 | 6.84%(-4.77)#3,191 |
Common Questions
What are the Top 10 Cities with the Highest Percentage of Immigrants from Latin America in Tennessee?
Top 10 Cities with the Highest Percentage of Immigrants from Latin America in Tennessee are:
#1
16.11%
#2
13.14%
#3
11.96%
#4
11.83%
#5
10.60%
#6
10.38%
#7
10.32%
#8
10.10%
#9
10.07%
#10
9.90%
What city has the Highest Percentage of Immigrants from Latin America in Tennessee?
Maury City has the Highest Percentage of Immigrants from Latin America in Tennessee with 16.11%.
What is the Percentage of Immigrants from Latin America in the State of Tennessee?
Percentage of Immigrants from Latin America in Tennessee is 2.47%.
What is the Percentage of Immigrants from Latin America in the United States?
Percentage of Immigrants from Latin America in the United States is 6.84%.