Cities with the Highest Percentage of Immigrants from Latin America in Pennsylvania
RELATED REPORTS & OPTIONS
Latin America
Pennsylvania
Compare Cities
Map of Cities with the Highest Percentage of Immigrants from Latin America in Pennsylvania
0.00%
50.00%
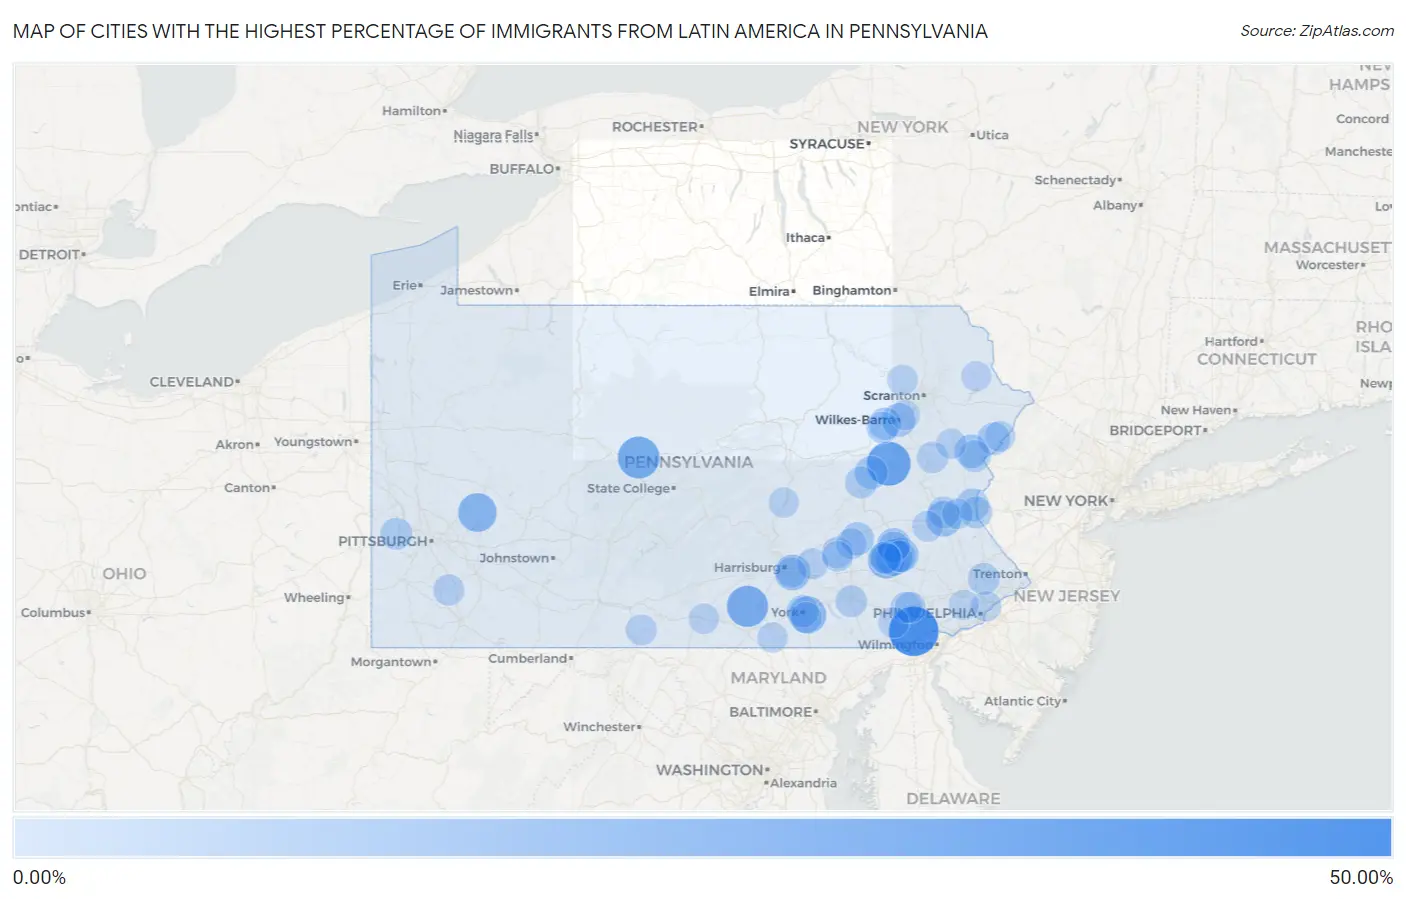
Cities with the Highest Percentage of Immigrants from Latin America in Pennsylvania
| City | Latin America | vs State | vs National | |
| 1. | Toughkenamon | 46.11% | 2.31%(+43.8)#-1 | 6.84%(+39.3)#0 |
| 2. | Avondale Borough | 45.65% | 2.31%(+43.3)#0 | 6.84%(+38.8)#1 |
| 3. | Hazleton | 33.57% | 2.31%(+31.3)#1 | 6.84%(+26.7)#2 |
| 4. | West Hazleton Borough | 31.52% | 2.31%(+29.2)#2 | 6.84%(+24.7)#3 |
| 5. | Kylertown | 29.15% | 2.31%(+26.8)#3 | 6.84%(+22.3)#4 |
| 6. | Gardners | 27.84% | 2.31%(+25.5)#4 | 6.84%(+21.0)#5 |
| 7. | York Springs Borough | 24.08% | 2.31%(+21.8)#5 | 6.84%(+17.2)#6 |
| 8. | Hyde Park | 22.30% | 2.31%(+20.0)#6 | 6.84%(+15.5)#7 |
| 9. | Kennett Square Borough | 21.75% | 2.31%(+19.4)#7 | 6.84%(+14.9)#8 |
| 10. | Mifflintown Borough | 20.65% | 2.31%(+18.3)#8 | 6.84%(+13.8)#9 |
| 11. | Queens Gate | 19.53% | 2.31%(+17.2)#9 | 6.84%(+12.7)#10 |
| 12. | Lincoln Park | 18.84% | 2.31%(+16.5)#10 | 6.84%(+12.0)#11 |
| 13. | Gratz Borough | 18.59% | 2.31%(+16.3)#11 | 6.84%(+11.7)#12 |
| 14. | Reading | 17.79% | 2.31%(+15.5)#86 | 6.84%(+11.0)#3,127 |
| 15. | Bressler | 16.13% | 2.31%(+13.8)#87 | 6.84%(+9.29)#3,128 |
| 16. | Allentown | 15.68% | 2.31%(+13.4)#88 | 6.84%(+8.84)#3,129 |
| 17. | Mcadoo Borough | 14.98% | 2.31%(+12.7)#89 | 6.84%(+8.14)#3,130 |
| 18. | Bendersville Borough | 14.63% | 2.31%(+12.3)#90 | 6.84%(+7.79)#3,131 |
| 19. | Stony Creek Mills | 13.87% | 2.31%(+11.6)#91 | 6.84%(+7.03)#3,132 |
| 20. | Oxford Borough | 13.61% | 2.31%(+11.3)#92 | 6.84%(+6.77)#3,133 |
| 21. | Nottingham | 13.08% | 2.31%(+10.8)#93 | 6.84%(+6.24)#3,134 |
| 22. | Temple | 12.04% | 2.31%(+9.72)#94 | 6.84%(+5.20)#3,135 |
| 23. | Norristown Borough | 11.76% | 2.31%(+9.44)#95 | 6.84%(+4.92)#3,136 |
| 24. | Wilkes Barre | 11.68% | 2.31%(+9.37)#96 | 6.84%(+4.84)#3,137 |
| 25. | Penn Estates | 11.47% | 2.31%(+9.15)#97 | 6.84%(+4.62)#3,138 |
| 26. | Laureldale Borough | 11.09% | 2.31%(+8.78)#98 | 6.84%(+4.25)#3,139 |
| 27. | Easton | 10.53% | 2.31%(+8.21)#99 | 6.84%(+3.69)#3,140 |
| 28. | West Grove Borough | 10.49% | 2.31%(+8.17)#100 | 6.84%(+3.65)#3,141 |
| 29. | Sheppton | 10.48% | 2.31%(+8.17)#101 | 6.84%(+3.64)#3,142 |
| 30. | Rehrersburg | 10.40% | 2.31%(+8.09)#102 | 6.84%(+3.56)#3,143 |
| 31. | Fountain Hill Borough | 10.38% | 2.31%(+8.06)#103 | 6.84%(+3.53)#3,144 |
| 32. | Troy Borough | 9.78% | 2.31%(+7.47)#104 | 6.84%(+2.94)#3,145 |
| 33. | Saw Creek | 9.78% | 2.31%(+7.46)#105 | 6.84%(+2.94)#3,146 |
| 34. | Mont Clare | 9.12% | 2.31%(+6.80)#106 | 6.84%(+2.28)#3,147 |
| 35. | West Nanticoke | 9.09% | 2.31%(+6.78)#107 | 6.84%(+2.25)#3,148 |
| 36. | York | 8.76% | 2.31%(+6.45)#108 | 6.84%(+1.92)#3,149 |
| 37. | Mount Pocono Borough | 8.62% | 2.31%(+6.30)#109 | 6.84%(+1.78)#3,150 |
| 38. | Chambersburg Borough | 8.56% | 2.31%(+6.25)#110 | 6.84%(+1.72)#3,151 |
| 39. | Freemansburg Borough | 8.49% | 2.31%(+6.18)#111 | 6.84%(+1.65)#3,152 |
| 40. | Raubsville | 8.45% | 2.31%(+6.14)#112 | 6.84%(+1.61)#3,153 |
| 41. | Souderton Borough | 8.34% | 2.31%(+6.03)#113 | 6.84%(+1.50)#3,154 |
| 42. | Clinton | 8.33% | 2.31%(+6.02)#114 | 6.84%(+1.49)#3,155 |
| 43. | New Oxford Borough | 8.26% | 2.31%(+5.94)#115 | 6.84%(+1.42)#3,156 |
| 44. | Shenandoah Heights | 8.24% | 2.31%(+5.93)#116 | 6.84%(+1.40)#3,157 |
| 45. | Beaver Meadows Borough | 8.11% | 2.31%(+5.80)#117 | 6.84%(+1.27)#3,158 |
| 46. | Arlington Heights | 8.04% | 2.31%(+5.72)#118 | 6.84%(+1.20)#3,159 |
| 47. | Fullerton | 7.95% | 2.31%(+5.63)#119 | 6.84%(+1.11)#3,160 |
| 48. | Horsham | 7.84% | 2.31%(+5.52)#120 | 6.84%(+0.996)#3,161 |
| 49. | South Temple | 7.74% | 2.31%(+5.42)#121 | 6.84%(+0.897)#3,162 |
| 50. | Coatesville | 7.50% | 2.31%(+5.19)#122 | 6.84%(+0.662)#3,163 |
| 51. | Lancaster | 7.50% | 2.31%(+5.18)#123 | 6.84%(+0.655)#3,164 |
| 52. | Wilson Borough | 7.41% | 2.31%(+5.09)#124 | 6.84%(+0.567)#3,165 |
| 53. | West York Borough | 7.38% | 2.31%(+5.06)#125 | 6.84%(+0.537)#3,166 |
| 54. | Freeland Borough | 7.33% | 2.31%(+5.01)#126 | 6.84%(+0.488)#3,167 |
| 55. | Sheatown | 7.31% | 2.31%(+5.00)#127 | 6.84%(+0.469)#3,168 |
| 56. | Shillington Borough | 7.27% | 2.31%(+4.96)#128 | 6.84%(+0.433)#3,169 |
| 57. | Pennside | 7.24% | 2.31%(+4.93)#129 | 6.84%(+0.399)#3,170 |
| 58. | Springmont | 7.23% | 2.31%(+4.92)#130 | 6.84%(+0.392)#3,171 |
| 59. | Towamensing Trails | 7.18% | 2.31%(+4.87)#131 | 6.84%(+0.344)#3,172 |
| 60. | Sand Hill | 7.01% | 2.31%(+4.69)#132 | 6.84%(+0.166)#3,173 |
| 61. | Le Raysville Borough | 6.92% | 2.31%(+4.61)#133 | 6.84%(+0.080)#3,174 |
| 62. | Caln | 6.70% | 2.31%(+4.38)#134 | 6.84%(-0.142)#3,175 |
| 63. | Fairhope | 6.66% | 2.31%(+4.34)#135 | 6.84%(-0.185)#3,176 |
| 64. | East Lansdowne Borough | 6.59% | 2.31%(+4.27)#136 | 6.84%(-0.255)#3,177 |
| 65. | Hershey | 6.52% | 2.31%(+4.21)#137 | 6.84%(-0.316)#3,178 |
| 66. | West Wyomissing | 6.52% | 2.31%(+4.21)#138 | 6.84%(-0.321)#3,179 |
| 67. | Shenandoah Borough | 6.51% | 2.31%(+4.19)#139 | 6.84%(-0.334)#3,180 |
| 68. | Collingdale Borough | 6.49% | 2.31%(+4.17)#140 | 6.84%(-0.355)#3,181 |
| 69. | Yeadon Borough | 6.37% | 2.31%(+4.05)#141 | 6.84%(-0.475)#3,182 |
| 70. | Catawissa Borough | 6.27% | 2.31%(+3.96)#142 | 6.84%(-0.568)#3,183 |
| 71. | Needmore | 6.25% | 2.31%(+3.94)#143 | 6.84%(-0.591)#3,184 |
| 72. | Tyler Run | 6.23% | 2.31%(+3.91)#144 | 6.84%(-0.613)#3,185 |
| 73. | Breinigsville | 6.18% | 2.31%(+3.86)#145 | 6.84%(-0.665)#3,186 |
| 74. | Mount Aetna | 5.98% | 2.31%(+3.67)#146 | 6.84%(-0.858)#3,187 |
| 75. | Pine Ridge | 5.94% | 2.31%(+3.63)#147 | 6.84%(-0.897)#3,188 |
| 76. | Cochranville | 5.94% | 2.31%(+3.63)#148 | 6.84%(-0.898)#3,189 |
| 77. | Biglerville Borough | 5.94% | 2.31%(+3.62)#149 | 6.84%(-0.905)#3,190 |
| 78. | Hayti | 5.92% | 2.31%(+3.61)#150 | 6.84%(-0.918)#3,191 |
| 79. | Cove Forge | 5.88% | 2.31%(+3.57)#151 | 6.84%(-0.958)#3,192 |
| 80. | Lebanon | 5.66% | 2.31%(+3.35)#152 | 6.84%(-1.18)#3,193 |
| 81. | Lake Winola | 5.48% | 2.31%(+3.17)#153 | 6.84%(-1.36)#3,194 |
| 82. | Roslyn | 5.43% | 2.31%(+3.12)#154 | 6.84%(-1.41)#3,195 |
| 83. | Bethlehem | 5.37% | 2.31%(+3.06)#155 | 6.84%(-1.47)#3,196 |
| 84. | Port Royal Borough | 5.35% | 2.31%(+3.04)#156 | 6.84%(-1.49)#3,197 |
| 85. | Quakertown Borough | 5.30% | 2.31%(+2.98)#157 | 6.84%(-1.54)#3,198 |
| 86. | Laceyville Borough | 5.28% | 2.31%(+2.96)#158 | 6.84%(-1.56)#3,199 |
| 87. | Emerald Lakes | 5.17% | 2.31%(+2.86)#159 | 6.84%(-1.67)#3,200 |
| 88. | Bridgeport Borough | 5.12% | 2.31%(+2.81)#160 | 6.84%(-1.72)#3,201 |
| 89. | Enhaut | 5.11% | 2.31%(+2.80)#161 | 6.84%(-1.73)#3,202 |
| 90. | Guilford | 5.11% | 2.31%(+2.79)#162 | 6.84%(-1.73)#3,203 |
| 91. | Philadelphia | 5.09% | 2.31%(+2.77)#163 | 6.84%(-1.75)#3,204 |
| 92. | White Mills | 4.96% | 2.31%(+2.65)#164 | 6.84%(-1.88)#3,205 |
| 93. | Port Trevorton | 4.93% | 2.31%(+2.61)#165 | 6.84%(-1.91)#3,206 |
| 94. | Pennville | 4.92% | 2.31%(+2.60)#166 | 6.84%(-1.92)#3,207 |
| 95. | Telford Borough | 4.74% | 2.31%(+2.43)#167 | 6.84%(-2.10)#3,208 |
| 96. | Parkesburg Borough | 4.71% | 2.31%(+2.39)#168 | 6.84%(-2.14)#3,209 |
| 97. | Moosic Borough | 4.69% | 2.31%(+2.37)#169 | 6.84%(-2.15)#3,210 |
| 98. | Hudson | 4.65% | 2.31%(+2.33)#170 | 6.84%(-2.19)#3,211 |
| 99. | Haverford College | 4.58% | 2.31%(+2.27)#171 | 6.84%(-2.26)#3,212 |
| 100. | Stroudsburg Borough | 4.54% | 2.31%(+2.23)#172 | 6.84%(-2.30)#3,213 |
Common Questions
What are the Top 10 Cities with the Highest Percentage of Immigrants from Latin America in Pennsylvania?
Top 10 Cities with the Highest Percentage of Immigrants from Latin America in Pennsylvania are:
#1
46.11%
#2
33.57%
#3
29.15%
#4
27.84%
#5
22.30%
#6
19.53%
#7
18.84%
#8
17.79%
#9
16.13%
#10
15.68%
What city has the Highest Percentage of Immigrants from Latin America in Pennsylvania?
Toughkenamon has the Highest Percentage of Immigrants from Latin America in Pennsylvania with 46.11%.
What is the Percentage of Immigrants from Latin America in the State of Pennsylvania?
Percentage of Immigrants from Latin America in Pennsylvania is 2.31%.
What is the Percentage of Immigrants from Latin America in the United States?
Percentage of Immigrants from Latin America in the United States is 6.84%.