Cities with the Highest Percentage of Immigrants from Latin America in Maryland
RELATED REPORTS & OPTIONS
Latin America
Maryland
Compare Cities
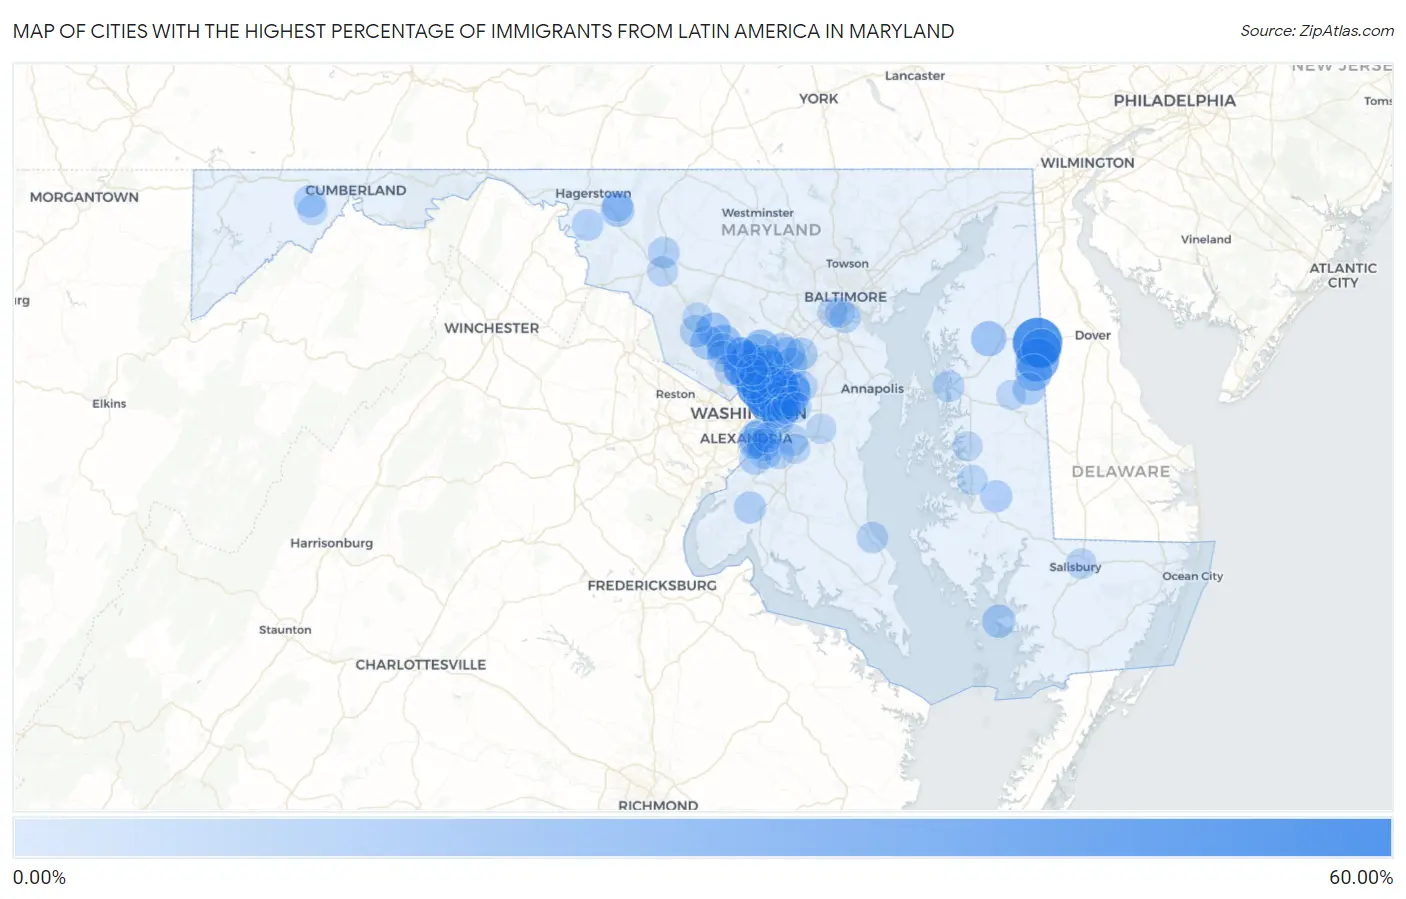
Map of Cities with the Highest Percentage of Immigrants from Latin America in Maryland
0.00%
60.00%
Cities with the Highest Percentage of Immigrants from Latin America in Maryland
| City | Latin America | vs State | vs National | |
| 1. | Langley Park | 58.50% | 6.12%(+52.4)#-1 | 6.84%(+51.7)#0 |
| 2. | Templeville | 58.24% | 6.12%(+52.1)#0 | 6.84%(+51.4)#1 |
| 3. | East Riverdale | 42.94% | 6.12%(+36.8)#6 | 6.84%(+36.1)#678 |
| 4. | Henderson | 40.94% | 6.12%(+34.8)#7 | 6.84%(+34.1)#679 |
| 5. | Cottage City | 39.01% | 6.12%(+32.9)#8 | 6.84%(+32.2)#680 |
| 6. | Riverdale Park | 37.62% | 6.12%(+31.5)#9 | 6.84%(+30.8)#681 |
| 7. | Edmonston | 35.18% | 6.12%(+29.1)#10 | 6.84%(+28.3)#682 |
| 8. | Adelphi | 34.21% | 6.12%(+28.1)#11 | 6.84%(+27.4)#683 |
| 9. | Woodlawn Cdp Prince George S County | 34.21% | 6.12%(+28.1)#12 | 6.84%(+27.4)#684 |
| 10. | Chillum | 34.17% | 6.12%(+28.0)#13 | 6.84%(+27.3)#685 |
| 11. | Brentwood | 33.34% | 6.12%(+27.2)#14 | 6.84%(+26.5)#686 |
| 12. | Marydel | 32.56% | 6.12%(+26.4)#15 | 6.84%(+25.7)#687 |
| 13. | Berwyn Heights | 30.74% | 6.12%(+24.6)#16 | 6.84%(+23.9)#688 |
| 14. | Burnt Mills | 29.58% | 6.12%(+23.5)#17 | 6.84%(+22.7)#689 |
| 15. | Colmar Manor | 27.31% | 6.12%(+21.2)#18 | 6.84%(+20.5)#690 |
| 16. | North Brentwood | 27.28% | 6.12%(+21.2)#19 | 6.84%(+20.4)#691 |
| 17. | Landover Hills | 27.20% | 6.12%(+21.1)#20 | 6.84%(+20.4)#692 |
| 18. | Glenmont | 26.50% | 6.12%(+20.4)#21 | 6.84%(+19.7)#693 |
| 19. | Mount Rainier | 25.80% | 6.12%(+19.7)#22 | 6.84%(+19.0)#694 |
| 20. | Wheaton | 25.27% | 6.12%(+19.1)#23 | 6.84%(+18.4)#695 |
| 21. | Beltsville | 24.68% | 6.12%(+18.6)#24 | 6.84%(+17.8)#696 |
| 22. | Lanham | 24.19% | 6.12%(+18.1)#25 | 6.84%(+17.3)#697 |
| 23. | Goldsboro | 24.17% | 6.12%(+18.0)#26 | 6.84%(+17.3)#698 |
| 24. | Hyattsville | 23.08% | 6.12%(+17.0)#39 | 6.84%(+16.2)#2,261 |
| 25. | Flower Hill | 22.37% | 6.12%(+16.2)#57 | 6.84%(+15.5)#2,889 |
| 26. | Aspen Hill | 22.35% | 6.12%(+16.2)#65 | 6.84%(+15.5)#3,092 |
| 27. | Spencerville | 21.69% | 6.12%(+15.6)#66 | 6.84%(+14.9)#3,093 |
| 28. | Redland | 20.63% | 6.12%(+14.5)#67 | 6.84%(+13.8)#3,094 |
| 29. | Hillandale | 20.03% | 6.12%(+13.9)#68 | 6.84%(+13.2)#3,095 |
| 30. | Church Hill | 19.83% | 6.12%(+13.7)#69 | 6.84%(+13.0)#3,096 |
| 31. | Forest Heights | 19.35% | 6.12%(+13.2)#70 | 6.84%(+12.5)#3,097 |
| 32. | Seabrook | 18.59% | 6.12%(+12.5)#71 | 6.84%(+11.7)#3,098 |
| 33. | Montgomery Village | 18.27% | 6.12%(+12.2)#72 | 6.84%(+11.4)#3,099 |
| 34. | Bladensburg | 17.59% | 6.12%(+11.5)#73 | 6.84%(+10.7)#3,100 |
| 35. | Calverton | 17.32% | 6.12%(+11.2)#74 | 6.84%(+10.5)#3,101 |
| 36. | Gaithersburg | 17.26% | 6.12%(+11.1)#75 | 6.84%(+10.4)#3,102 |
| 37. | New Carrollton | 17.18% | 6.12%(+11.1)#76 | 6.84%(+10.3)#3,103 |
| 38. | Landover | 15.83% | 6.12%(+9.71)#77 | 6.84%(+8.99)#3,104 |
| 39. | Bagtown | 15.74% | 6.12%(+9.62)#78 | 6.84%(+8.90)#3,105 |
| 40. | Chance | 14.98% | 6.12%(+8.86)#79 | 6.84%(+8.14)#3,106 |
| 41. | Glassmanor | 14.98% | 6.12%(+8.86)#80 | 6.84%(+8.14)#3,107 |
| 42. | Forest Glen | 14.89% | 6.12%(+8.76)#81 | 6.84%(+8.04)#3,108 |
| 43. | Capitol Heights | 14.63% | 6.12%(+8.51)#82 | 6.84%(+7.79)#3,109 |
| 44. | Fairmount Heights | 14.50% | 6.12%(+8.38)#83 | 6.84%(+7.66)#3,110 |
| 45. | Silver Spring | 14.18% | 6.12%(+8.06)#84 | 6.84%(+7.34)#3,111 |
| 46. | Laurel | 14.14% | 6.12%(+8.02)#85 | 6.84%(+7.30)#3,112 |
| 47. | Colesville | 13.92% | 6.12%(+7.80)#86 | 6.84%(+7.08)#3,113 |
| 48. | Friendly | 13.78% | 6.12%(+7.66)#87 | 6.84%(+6.94)#3,114 |
| 49. | North Kensington | 13.41% | 6.12%(+7.29)#88 | 6.84%(+6.57)#3,115 |
| 50. | Oxon Hill | 13.20% | 6.12%(+7.08)#89 | 6.84%(+6.36)#3,116 |
| 51. | Greensboro | 13.13% | 6.12%(+7.01)#90 | 6.84%(+6.29)#3,117 |
| 52. | Germantown | 12.91% | 6.12%(+6.79)#91 | 6.84%(+6.07)#3,118 |
| 53. | Glenarden | 12.90% | 6.12%(+6.78)#92 | 6.84%(+6.06)#3,119 |
| 54. | Layhill | 12.66% | 6.12%(+6.54)#93 | 6.84%(+5.82)#3,120 |
| 55. | South Laurel | 12.63% | 6.12%(+6.51)#94 | 6.84%(+5.79)#3,121 |
| 56. | Maryland City | 12.55% | 6.12%(+6.43)#95 | 6.84%(+5.71)#3,122 |
| 57. | White Oak | 12.16% | 6.12%(+6.04)#96 | 6.84%(+5.32)#3,123 |
| 58. | Fort Washington | 11.92% | 6.12%(+5.80)#97 | 6.84%(+5.08)#3,124 |
| 59. | Klondike | 11.84% | 6.12%(+5.72)#98 | 6.84%(+5.00)#3,125 |
| 60. | Pomfret | 11.81% | 6.12%(+5.69)#99 | 6.84%(+4.97)#3,126 |
| 61. | Cloverly | 11.37% | 6.12%(+5.25)#100 | 6.84%(+4.53)#3,127 |
| 62. | Secretary | 11.37% | 6.12%(+5.25)#101 | 6.84%(+4.53)#3,128 |
| 63. | Peppermill Village | 11.18% | 6.12%(+5.06)#102 | 6.84%(+4.34)#3,129 |
| 64. | College Park | 10.68% | 6.12%(+4.56)#103 | 6.84%(+3.84)#3,130 |
| 65. | Fairplay | 10.50% | 6.12%(+4.38)#104 | 6.84%(+3.66)#3,131 |
| 66. | Queenstown | 10.43% | 6.12%(+4.31)#105 | 6.84%(+3.59)#3,132 |
| 67. | West Laurel | 10.34% | 6.12%(+4.22)#106 | 6.84%(+3.50)#3,133 |
| 68. | Frederick | 10.31% | 6.12%(+4.19)#107 | 6.84%(+3.47)#3,134 |
| 69. | Takoma Park | 10.29% | 6.12%(+4.17)#108 | 6.84%(+3.45)#3,135 |
| 70. | Melwood | 10.21% | 6.12%(+4.09)#109 | 6.84%(+3.37)#3,136 |
| 71. | St Leonard | 9.59% | 6.12%(+3.47)#110 | 6.84%(+2.75)#3,137 |
| 72. | Derwood | 9.51% | 6.12%(+3.39)#111 | 6.84%(+2.67)#3,138 |
| 73. | Brooklyn Park | 9.46% | 6.12%(+3.34)#112 | 6.84%(+2.62)#3,139 |
| 74. | Rockville | 9.25% | 6.12%(+3.13)#113 | 6.84%(+2.41)#3,140 |
| 75. | Greenbelt | 9.24% | 6.12%(+3.12)#114 | 6.84%(+2.40)#3,141 |
| 76. | National Harbor | 9.11% | 6.12%(+2.99)#115 | 6.84%(+2.27)#3,142 |
| 77. | Mount Aetna | 9.01% | 6.12%(+2.89)#116 | 6.84%(+2.17)#3,143 |
| 78. | North Bethesda | 8.91% | 6.12%(+2.79)#117 | 6.84%(+2.07)#3,144 |
| 79. | Four Corners | 8.43% | 6.12%(+2.31)#118 | 6.84%(+1.59)#3,145 |
| 80. | Fairland | 8.34% | 6.12%(+2.22)#119 | 6.84%(+1.50)#3,146 |
| 81. | Springdale | 8.12% | 6.12%(+2.00)#120 | 6.84%(+1.28)#3,147 |
| 82. | Ballenger Creek | 8.08% | 6.12%(+1.96)#121 | 6.84%(+1.24)#3,148 |
| 83. | Kemp Mill | 7.91% | 6.12%(+1.79)#122 | 6.84%(+1.07)#3,149 |
| 84. | Salisbury | 7.89% | 6.12%(+1.77)#123 | 6.84%(+1.05)#3,150 |
| 85. | Lansdowne | 7.62% | 6.12%(+1.50)#124 | 6.84%(+0.778)#3,151 |
| 86. | Clinton | 7.59% | 6.12%(+1.47)#125 | 6.84%(+0.752)#3,152 |
| 87. | Summerfield | 7.58% | 6.12%(+1.46)#126 | 6.84%(+0.744)#3,153 |
| 88. | Leisure World | 7.48% | 6.12%(+1.36)#127 | 6.84%(+0.636)#3,154 |
| 89. | Trappe | 7.46% | 6.12%(+1.34)#128 | 6.84%(+0.618)#3,155 |
| 90. | Glenn Dale | 7.38% | 6.12%(+1.26)#129 | 6.84%(+0.539)#3,156 |
| 91. | Baltimore Highlands | 7.29% | 6.12%(+1.17)#130 | 6.84%(+0.453)#3,157 |
| 92. | Gilmore | 7.24% | 6.12%(+1.12)#131 | 6.84%(+0.402)#3,158 |
| 93. | Marlboro Meadows | 7.05% | 6.12%(+0.933)#132 | 6.84%(+0.213)#3,159 |
| 94. | Temple Hills | 6.94% | 6.12%(+0.823)#133 | 6.84%(+0.103)#3,160 |
| 95. | Ten Mile Creek | 6.83% | 6.12%(+0.713)#134 | 6.84%(-0.007)#3,161 |
| 96. | Ridgely | 6.83% | 6.12%(+0.712)#135 | 6.84%(-0.008)#3,162 |
| 97. | Lake Arbor | 6.73% | 6.12%(+0.610)#136 | 6.84%(-0.110)#3,163 |
| 98. | Clarksburg | 6.64% | 6.12%(+0.521)#137 | 6.84%(-0.199)#3,164 |
| 99. | Rosaryville | 6.54% | 6.12%(+0.415)#138 | 6.84%(-0.305)#3,165 |
| 100. | Easton | 6.46% | 6.12%(+0.340)#139 | 6.84%(-0.380)#3,166 |
Common Questions
What are the Top 10 Cities with the Highest Percentage of Immigrants from Latin America in Maryland?
Top 10 Cities with the Highest Percentage of Immigrants from Latin America in Maryland are:
#1
58.50%
#2
58.24%
#3
42.94%
#4
40.94%
#5
39.01%
#6
37.62%
#7
35.18%
#8
34.21%
#9
34.17%
#10
33.34%
What city has the Highest Percentage of Immigrants from Latin America in Maryland?
Langley Park has the Highest Percentage of Immigrants from Latin America in Maryland with 58.50%.
What is the Percentage of Immigrants from Latin America in the State of Maryland?
Percentage of Immigrants from Latin America in Maryland is 6.12%.
What is the Percentage of Immigrants from Latin America in the United States?
Percentage of Immigrants from Latin America in the United States is 6.84%.