Cities with the Highest Percentage of Immigrants from Latin America in Colorado
RELATED REPORTS & OPTIONS
Latin America
Colorado
Compare Cities
Map of Cities with the Highest Percentage of Immigrants from Latin America in Colorado
0.00%
50.00%
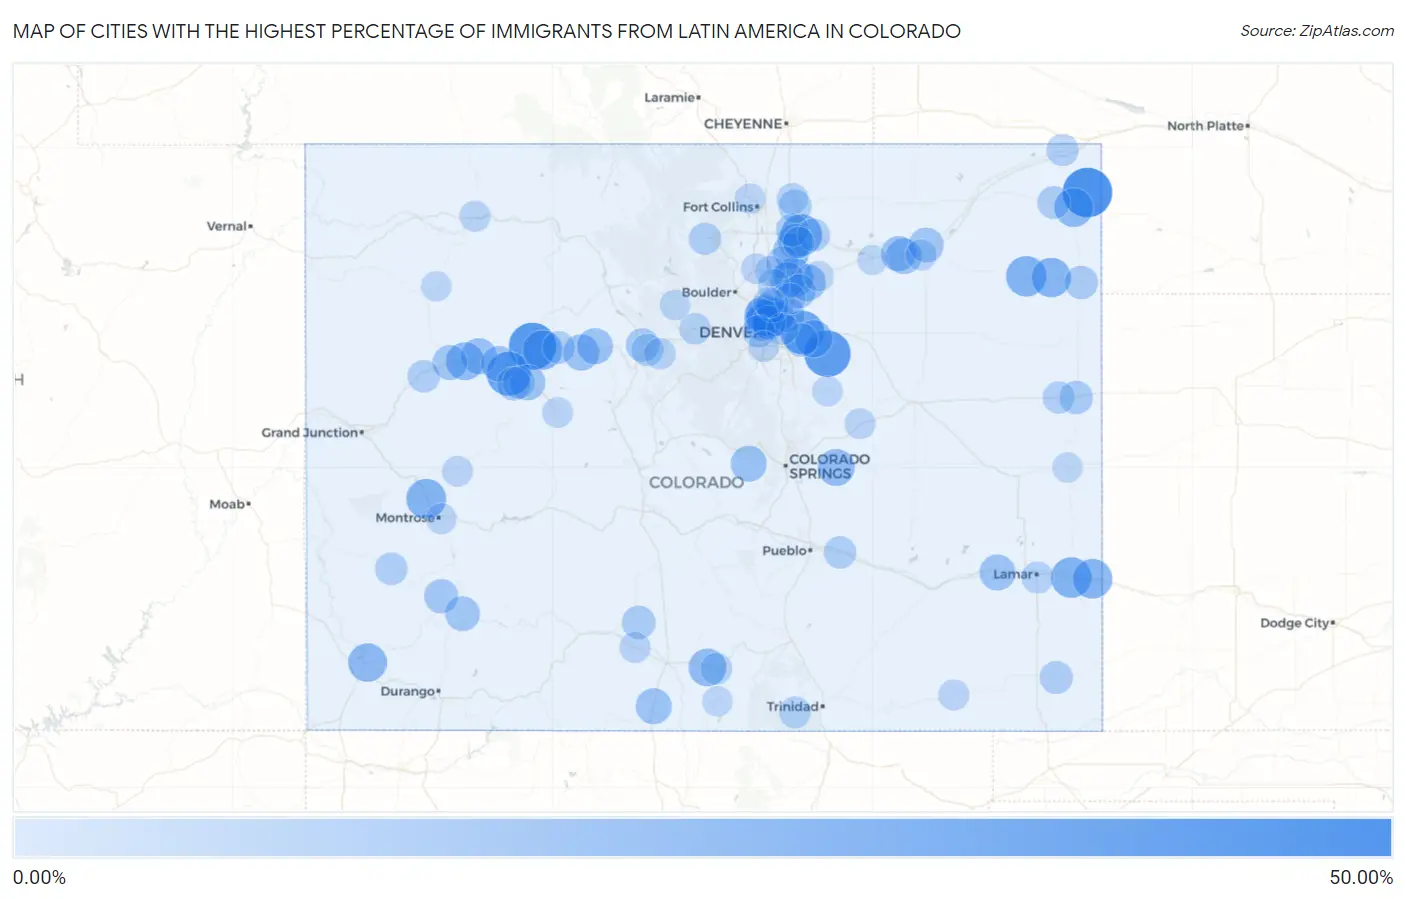
Cities with the Highest Percentage of Immigrants from Latin America in Colorado
| City | Latin America | vs State | vs National | |
| 1. | Amherst | 41.56% | 4.80% (+36.8)#-1 | 6.84% (+34.7)#0 |
| 2. | Dotsero | 37.09% | 4.80% (+32.3)#0 | 6.84% (+30.2)#1 |
| 3. | Brick Center | 35.23% | 4.80% (+30.4)#1 | 6.84% (+28.4)#2 |
| 4. | Cattle Creek | 30.86% | 4.80% (+26.1)#2 | 6.84% (+24.0)#3 |
| 5. | Aetna Estates | 29.73% | 4.80% (+24.9)#3 | 6.84% (+22.9)#4 |
| 6. | Garden City | 26.06% | 4.80% (+21.3)#4 | 6.84% (+19.2)#5 |
| 7. | Granada | 23.86% | 4.80% (+19.1)#5 | 6.84% (+17.0)#6 |
| 8. | Yuma | 23.79% | 4.80% (+19.0)#6 | 6.84% (+16.9)#7 |
| 9. | Olathe | 22.51% | 4.80% (+17.7)#42 | 6.84% (+15.7)#1,693 |
| 10. | Holly | 22.44% | 4.80% (+17.6)#43 | 6.84% (+15.6)#1,694 |
| 11. | Gypsum | 22.14% | 4.80% (+17.3)#44 | 6.84% (+15.3)#1,695 |
| 12. | Eckley | 21.89% | 4.80% (+17.1)#45 | 6.84% (+15.1)#1,696 |
| 13. | Aristocrat Ranchettes | 21.39% | 4.80% (+16.6)#46 | 6.84% (+14.5)#1,697 |
| 14. | Holyoke | 20.62% | 4.80% (+15.8)#47 | 6.84% (+13.8)#1,698 |
| 15. | Welby | 20.40% | 4.80% (+15.6)#48 | 6.84% (+13.6)#1,699 |
| 16. | Dolores | 20.19% | 4.80% (+15.4)#49 | 6.84% (+13.3)#1,700 |
| 17. | Derby | 19.19% | 4.80% (+14.4)#50 | 6.84% (+12.4)#1,701 |
| 18. | Silt | 19.10% | 4.80% (+14.3)#51 | 6.84% (+12.3)#1,702 |
| 19. | Federal Heights | 18.90% | 4.80% (+14.1)#52 | 6.84% (+12.1)#1,703 |
| 20. | Blanca | 18.69% | 4.80% (+13.9)#53 | 6.84% (+11.9)#1,704 |
| 21. | Watkins | 17.96% | 4.80% (+13.2)#54 | 6.84% (+11.1)#1,705 |
| 22. | Ellicott | 17.16% | 4.80% (+12.4)#55 | 6.84% (+10.3)#1,706 |
| 23. | Hudson | 16.66% | 4.80% (+11.9)#56 | 6.84% (+9.82)#1,707 |
| 24. | Sherrelwood | 16.48% | 4.80% (+11.7)#57 | 6.84% (+9.64)#1,708 |
| 25. | Twin Lakes Cdp Adams County | 16.39% | 4.80% (+11.6)#58 | 6.84% (+9.55)#1,709 |
| 26. | Berkley | 16.36% | 4.80% (+11.6)#59 | 6.84% (+9.52)#1,710 |
| 27. | Gilcrest | 15.99% | 4.80% (+11.2)#60 | 6.84% (+9.15)#1,711 |
| 28. | Edwards | 15.74% | 4.80% (+10.9)#61 | 6.84% (+8.90)#1,800 |
| 29. | New Castle | 15.59% | 4.80% (+10.8)#62 | 6.84% (+8.75)#1,801 |
| 30. | Avon | 15.47% | 4.80% (+10.7)#63 | 6.84% (+8.63)#1,802 |
| 31. | Romeo | 15.34% | 4.80% (+10.5)#64 | 6.84% (+8.50)#1,803 |
| 32. | Midland | 15.29% | 4.80% (+10.5)#65 | 6.84% (+8.45)#1,804 |
| 33. | Hasty | 15.22% | 4.80% (+10.4)#66 | 6.84% (+8.38)#1,805 |
| 34. | Fort Lupton | 14.93% | 4.80% (+10.1)#67 | 6.84% (+8.09)#1,806 |
| 35. | El Jebel | 14.88% | 4.80% (+10.1)#68 | 6.84% (+8.04)#1,807 |
| 36. | Fort Morgan | 14.76% | 4.80% (+9.96)#69 | 6.84% (+7.91)#1,808 |
| 37. | Glenwood Springs | 14.48% | 4.80% (+9.68)#70 | 6.84% (+7.63)#1,809 |
| 38. | Log Lane Village | 14.23% | 4.80% (+9.44)#71 | 6.84% (+7.39)#1,810 |
| 39. | Evans | 13.73% | 4.80% (+8.94)#72 | 6.84% (+6.89)#1,811 |
| 40. | Rifle | 13.30% | 4.80% (+8.50)#73 | 6.84% (+6.46)#1,812 |
| 41. | Snyder | 13.21% | 4.80% (+8.41)#74 | 6.84% (+6.37)#1,813 |
| 42. | Silverton | 13.05% | 4.80% (+8.25)#75 | 6.84% (+6.21)#1,814 |
| 43. | Commerce City | 12.64% | 4.80% (+7.84)#79 | 6.84% (+5.80)#3,020 |
| 44. | Mountain Village | 12.26% | 4.80% (+7.47)#80 | 6.84% (+5.42)#3,021 |
| 45. | Shaw Heights | 11.93% | 4.80% (+7.13)#81 | 6.84% (+5.09)#3,022 |
| 46. | Lochbuie | 11.73% | 4.80% (+6.93)#82 | 6.84% (+4.89)#3,023 |
| 47. | North Washington | 11.21% | 4.80% (+6.41)#83 | 6.84% (+4.37)#3,024 |
| 48. | Carbondale | 10.88% | 4.80% (+6.08)#84 | 6.84% (+4.04)#3,025 |
| 49. | Center | 10.73% | 4.80% (+5.93)#85 | 6.84% (+3.89)#3,026 |
| 50. | Aurora | 10.72% | 4.80% (+5.92)#86 | 6.84% (+3.88)#3,027 |
| 51. | Silverthorne | 10.51% | 4.80% (+5.71)#87 | 6.84% (+3.66)#3,028 |
| 52. | Wray | 10.44% | 4.80% (+5.65)#88 | 6.84% (+3.60)#3,029 |
| 53. | Burlington | 10.43% | 4.80% (+5.63)#89 | 6.84% (+3.59)#3,030 |
| 54. | Vilas | 9.91% | 4.80% (+5.11)#90 | 6.84% (+3.07)#3,031 |
| 55. | Ault | 9.87% | 4.80% (+5.07)#91 | 6.84% (+3.03)#3,032 |
| 56. | Greeley | 9.63% | 4.80% (+4.83)#92 | 6.84% (+2.79)#3,072 |
| 57. | Paoli | 9.52% | 4.80% (+4.73)#93 | 6.84% (+2.68)#3,073 |
| 58. | Eagle | 9.12% | 4.80% (+4.32)#94 | 6.84% (+2.28)#3,074 |
| 59. | Mulford | 9.09% | 4.80% (+4.29)#95 | 6.84% (+2.25)#3,075 |
| 60. | Thornton | 8.98% | 4.80% (+4.19)#96 | 6.84% (+2.14)#3,076 |
| 61. | Norwood | 8.78% | 4.80% (+3.98)#97 | 6.84% (+1.94)#3,077 |
| 62. | Edgewater | 8.76% | 4.80% (+3.96)#98 | 6.84% (+1.92)#3,078 |
| 63. | Kersey | 8.74% | 4.80% (+3.94)#99 | 6.84% (+1.90)#3,079 |
| 64. | Avondale | 8.71% | 4.80% (+3.91)#100 | 6.84% (+1.87)#3,080 |
| 65. | Battlement Mesa | 8.70% | 4.80% (+3.90)#101 | 6.84% (+1.86)#3,081 |
| 66. | Dillon | 8.54% | 4.80% (+3.75)#102 | 6.84% (+1.70)#3,082 |
| 67. | Platteville | 8.43% | 4.80% (+3.64)#103 | 6.84% (+1.59)#3,083 |
| 68. | Bethune | 8.29% | 4.80% (+3.50)#104 | 6.84% (+1.45)#3,084 |
| 69. | Estes Park | 8.25% | 4.80% (+3.45)#105 | 6.84% (+1.41)#3,085 |
| 70. | Ovid | 8.08% | 4.80% (+3.28)#106 | 6.84% (+1.24)#3,086 |
| 71. | Denver | 7.78% | 4.80% (+2.99)#107 | 6.84% (+0.944)#3,087 |
| 72. | Lamar | 7.68% | 4.80% (+2.88)#108 | 6.84% (+0.842)#3,088 |
| 73. | Fort Garland | 7.56% | 4.80% (+2.76)#109 | 6.84% (+0.719)#3,089 |
| 74. | Segundo | 7.56% | 4.80% (+2.76)#110 | 6.84% (+0.717)#3,090 |
| 75. | Dacono | 7.44% | 4.80% (+2.65)#111 | 6.84% (+0.603)#3,091 |
| 76. | Downieville Lawson Dumont | 6.99% | 4.80% (+2.19)#112 | 6.84% (+0.149)#3,092 |
| 77. | Keystone | 6.73% | 4.80% (+1.94)#113 | 6.84% (-0.107)#3,093 |
| 78. | Pierce | 6.68% | 4.80% (+1.88)#114 | 6.84% (-0.161)#3,094 |
| 79. | La Salle | 6.61% | 4.80% (+1.81)#115 | 6.84% (-0.230)#3,095 |
| 80. | Brighton | 6.52% | 4.80% (+1.72)#116 | 6.84% (-0.319)#3,136 |
| 81. | Brush | 6.22% | 4.80% (+1.42)#117 | 6.84% (-0.619)#3,137 |
| 82. | Craig | 6.19% | 4.80% (+1.39)#118 | 6.84% (-0.650)#3,138 |
| 83. | Monte Vista | 6.05% | 4.80% (+1.25)#119 | 6.84% (-0.795)#3,139 |
| 84. | Sheridan | 5.89% | 4.80% (+1.09)#120 | 6.84% (-0.952)#3,140 |
| 85. | Kim | 5.88% | 4.80% (+1.08)#121 | 6.84% (-0.958)#3,141 |
| 86. | Northglenn | 5.75% | 4.80% (+0.952)#122 | 6.84% (-1.09)#3,142 |
| 87. | Ramah | 5.75% | 4.80% (+0.949)#123 | 6.84% (-1.09)#3,143 |
| 88. | Hotchkiss | 5.72% | 4.80% (+0.927)#124 | 6.84% (-1.12)#3,144 |
| 89. | Aspen | 5.61% | 4.80% (+0.812)#125 | 6.84% (-1.23)#3,145 |
| 90. | Montrose | 5.45% | 4.80% (+0.655)#126 | 6.84% (-1.39)#3,146 |
| 91. | Laporte | 5.37% | 4.80% (+0.576)#127 | 6.84% (-1.47)#3,147 |
| 92. | Longmont | 5.36% | 4.80% (+0.560)#128 | 6.84% (-1.48)#3,148 |
| 93. | Fraser | 5.25% | 4.80% (+0.448)#129 | 6.84% (-1.59)#3,149 |
| 94. | Kiowa | 5.09% | 4.80% (+0.293)#130 | 6.84% (-1.75)#3,150 |
| 95. | Firestone | 4.98% | 4.80% (+0.183)#131 | 6.84% (-1.86)#3,151 |
| 96. | Meeker | 4.88% | 4.80% (+0.082)#132 | 6.84% (-1.96)#3,152 |
| 97. | Keenesburg | 4.85% | 4.80% (+0.056)#133 | 6.84% (-1.99)#3,153 |
| 98. | Cheyenne Wells | 4.83% | 4.80% (+0.031)#134 | 6.84% (-2.01)#3,154 |
| 99. | San Luis | 4.81% | 4.80% (+0.012)#135 | 6.84% (-2.03)#3,155 |
| 100. | Wiggins | 4.57% | 4.80% (-0.228)#136 | 6.84% (-2.27)#3,156 |
Common Questions
What are the Top 10 Cities with the Highest Percentage of Immigrants from Latin America in Colorado?
Top 10 Cities with the Highest Percentage of Immigrants from Latin America in Colorado are:
#1
41.56%
#2
37.09%
#3
35.23%
#4
30.86%
#5
29.73%
#6
26.06%
#7
23.86%
#8
23.79%
#9
22.51%
#10
22.44%
What city has the Highest Percentage of Immigrants from Latin America in Colorado?
Amherst has the Highest Percentage of Immigrants from Latin America in Colorado with 41.56%.
What is the Percentage of Immigrants from Latin America in the State of Colorado?
Percentage of Immigrants from Latin America in Colorado is 4.80%.
What is the Percentage of Immigrants from Latin America in the United States?
Percentage of Immigrants from Latin America in the United States is 6.84%.