Cities with the Highest Percentage of Population Employed in Healthcare Support in Tennessee
RELATED REPORTS & OPTIONS
Healthcare Support
Tennessee
Compare Cities
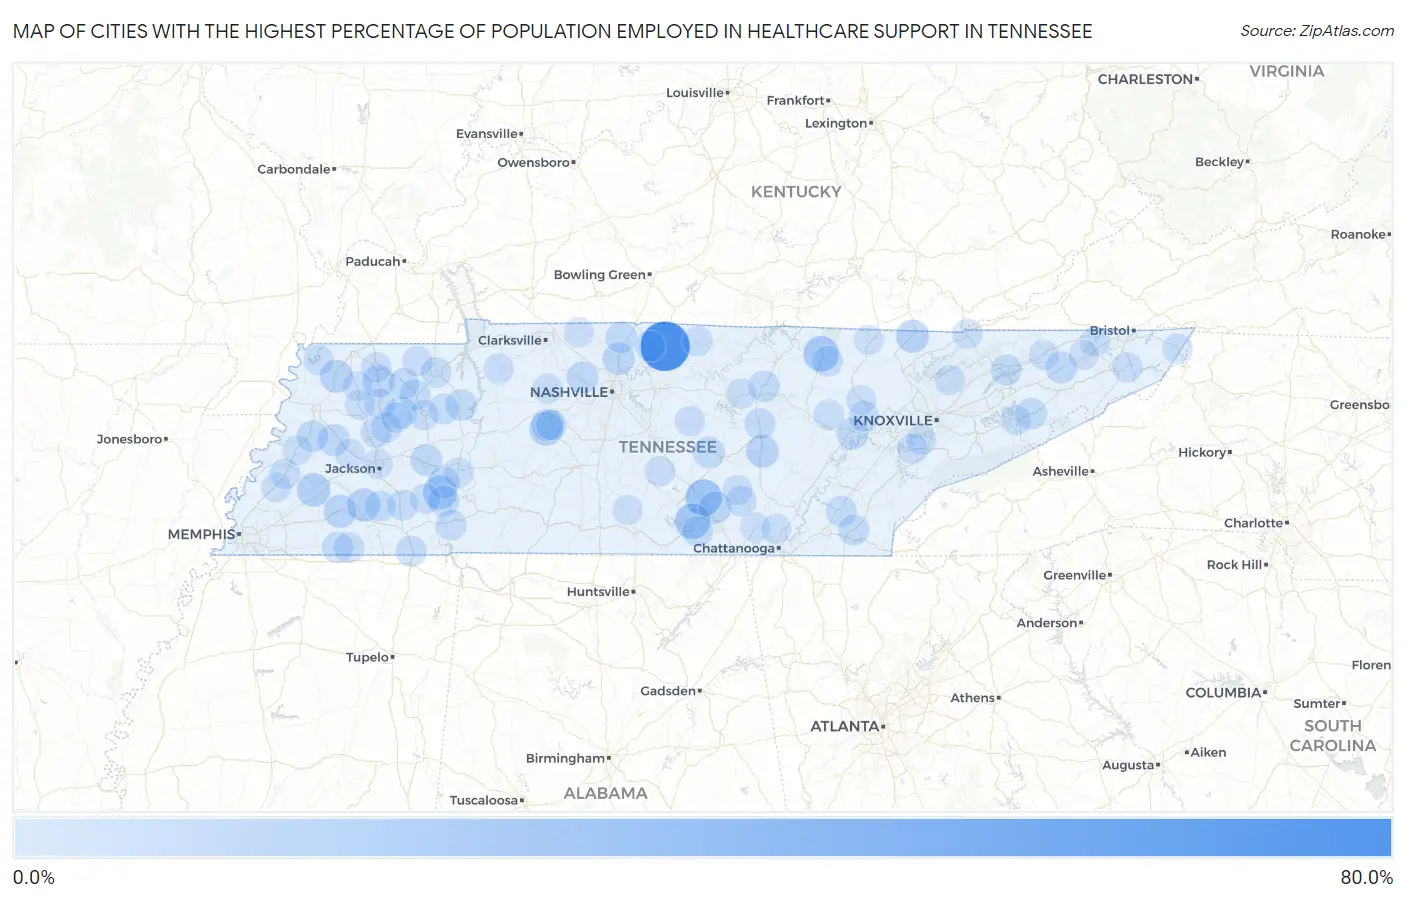
Map of Cities with the Highest Percentage of Population Employed in Healthcare Support in Tennessee
0.0%
80.0%
Cities with the Highest Percentage of Population Employed in Healthcare Support in Tennessee
| City | % Employed | vs State | vs National | |
| 1. | Bethpage | 61.2% | 2.6%(+58.6)#1 | 3.3%(+57.9)#49 |
| 2. | Kahite | 40.5% | 2.6%(+37.9)#2 | 3.3%(+37.3)#136 |
| 3. | Hillsboro | 22.6% | 2.6%(+20.0)#3 | 3.3%(+19.4)#423 |
| 4. | Taft | 21.3% | 2.6%(+18.7)#4 | 3.3%(+18.1)#481 |
| 5. | Jamestown | 20.3% | 2.6%(+17.7)#5 | 3.3%(+17.0)#526 |
| 6. | Decherd | 20.2% | 2.6%(+17.5)#6 | 3.3%(+16.9)#533 |
| 7. | Sardis | 15.9% | 2.6%(+13.3)#7 | 3.3%(+12.6)#830 |
| 8. | Wrigley | 15.1% | 2.6%(+12.5)#8 | 3.3%(+11.8)#935 |
| 9. | Stanton | 14.4% | 2.6%(+11.8)#9 | 3.3%(+11.1)#1,038 |
| 10. | Jellico | 13.1% | 2.6%(+10.5)#10 | 3.3%(+9.81)#1,308 |
| 11. | Toone | 12.9% | 2.6%(+10.3)#11 | 3.3%(+9.67)#1,334 |
| 12. | Obion | 12.7% | 2.6%(+10.1)#12 | 3.3%(+9.46)#1,383 |
| 13. | Whiteville | 12.6% | 2.6%(+9.94)#13 | 3.3%(+9.30)#1,423 |
| 14. | Spencer | 12.0% | 2.6%(+9.37)#14 | 3.3%(+8.73)#1,581 |
| 15. | Millersville | 11.1% | 2.6%(+8.44)#15 | 3.3%(+7.80)#1,881 |
| 16. | Sharon | 10.9% | 2.6%(+8.30)#16 | 3.3%(+7.66)#1,922 |
| 17. | Pelham | 10.7% | 2.6%(+8.07)#17 | 3.3%(+7.43)#2,003 |
| 18. | Lyles | 10.3% | 2.6%(+7.69)#18 | 3.3%(+7.05)#2,166 |
| 19. | Lexington | 10.0% | 2.6%(+7.39)#19 | 3.3%(+6.75)#2,295 |
| 20. | Maury City | 10.0% | 2.6%(+7.33)#20 | 3.3%(+6.69)#2,334 |
| 21. | Ashland City | 10.0% | 2.6%(+7.32)#21 | 3.3%(+6.68)#2,343 |
| 22. | Gates | 9.4% | 2.6%(+6.78)#22 | 3.3%(+6.14)#2,609 |
| 23. | Scotts Hill | 9.4% | 2.6%(+6.74)#23 | 3.3%(+6.10)#2,627 |
| 24. | Rockwood | 9.4% | 2.6%(+6.74)#24 | 3.3%(+6.10)#2,630 |
| 25. | Baileyton | 9.4% | 2.6%(+6.72)#25 | 3.3%(+6.08)#2,645 |
| 26. | Trezevant | 9.1% | 2.6%(+6.49)#26 | 3.3%(+5.85)#2,751 |
| 27. | Cross Plains | 9.0% | 2.6%(+6.37)#27 | 3.3%(+5.73)#2,850 |
| 28. | Hampton | 9.0% | 2.6%(+6.34)#28 | 3.3%(+5.71)#2,858 |
| 29. | Centertown | 9.0% | 2.6%(+6.31)#29 | 3.3%(+5.68)#2,868 |
| 30. | Parrottsville | 8.9% | 2.6%(+6.26)#30 | 3.3%(+5.62)#2,892 |
| 31. | Algood | 8.8% | 2.6%(+6.19)#31 | 3.3%(+5.55)#2,936 |
| 32. | Camden | 8.6% | 2.6%(+5.93)#32 | 3.3%(+5.29)#3,121 |
| 33. | Fowlkes | 8.5% | 2.6%(+5.86)#33 | 3.3%(+5.23)#3,158 |
| 34. | Valley Forge | 8.1% | 2.6%(+5.46)#34 | 3.3%(+4.82)#3,467 |
| 35. | Gibson | 8.0% | 2.6%(+5.32)#35 | 3.3%(+4.68)#3,564 |
| 36. | Mckenzie | 8.0% | 2.6%(+5.31)#36 | 3.3%(+4.67)#3,577 |
| 37. | Guys | 7.9% | 2.6%(+5.29)#37 | 3.3%(+4.65)#3,598 |
| 38. | Calhoun | 7.9% | 2.6%(+5.25)#38 | 3.3%(+4.61)#3,620 |
| 39. | Bean Station | 7.8% | 2.6%(+5.14)#39 | 3.3%(+4.50)#3,725 |
| 40. | Saltillo | 7.7% | 2.6%(+5.03)#40 | 3.3%(+4.39)#3,833 |
| 41. | Sparta | 7.5% | 2.6%(+4.87)#41 | 3.3%(+4.23)#3,968 |
| 42. | Gleason | 7.4% | 2.6%(+4.81)#42 | 3.3%(+4.17)#4,029 |
| 43. | Grand Junction | 7.4% | 2.6%(+4.80)#43 | 3.3%(+4.16)#4,035 |
| 44. | Benton | 7.4% | 2.6%(+4.78)#44 | 3.3%(+4.14)#4,055 |
| 45. | Cowan | 7.3% | 2.6%(+4.68)#45 | 3.3%(+4.04)#4,154 |
| 46. | Silerton | 7.3% | 2.6%(+4.68)#46 | 3.3%(+4.04)#4,159 |
| 47. | Finger | 7.3% | 2.6%(+4.64)#47 | 3.3%(+4.00)#4,174 |
| 48. | Allardt | 7.2% | 2.6%(+4.59)#48 | 3.3%(+3.95)#4,242 |
| 49. | Graball | 7.0% | 2.6%(+4.40)#49 | 3.3%(+3.76)#4,445 |
| 50. | Bradford | 7.0% | 2.6%(+4.36)#50 | 3.3%(+3.72)#4,491 |
| 51. | Olivet | 6.9% | 2.6%(+4.26)#51 | 3.3%(+3.62)#4,599 |
| 52. | Bruceton | 6.8% | 2.6%(+4.19)#52 | 3.3%(+3.55)#4,678 |
| 53. | Westpoint | 6.8% | 2.6%(+4.18)#53 | 3.3%(+3.54)#4,694 |
| 54. | Oakdale | 6.8% | 2.6%(+4.18)#54 | 3.3%(+3.54)#4,695 |
| 55. | Saulsbury | 6.7% | 2.6%(+4.03)#55 | 3.3%(+3.39)#4,868 |
| 56. | Covington | 6.5% | 2.6%(+3.83)#56 | 3.3%(+3.19)#5,114 |
| 57. | Paris | 6.4% | 2.6%(+3.80)#57 | 3.3%(+3.16)#5,180 |
| 58. | Bon Aqua Junction | 6.4% | 2.6%(+3.75)#58 | 3.3%(+3.11)#5,244 |
| 59. | Gruetli Laager | 6.4% | 2.6%(+3.72)#59 | 3.3%(+3.08)#5,277 |
| 60. | Milan | 6.3% | 2.6%(+3.65)#60 | 3.3%(+3.01)#5,378 |
| 61. | Cottage Grove | 6.2% | 2.6%(+3.61)#61 | 3.3%(+2.97)#5,438 |
| 62. | Mountain City | 6.2% | 2.6%(+3.55)#62 | 3.3%(+2.91)#5,498 |
| 63. | Huntingdon | 6.2% | 2.6%(+3.55)#63 | 3.3%(+2.91)#5,502 |
| 64. | Atwood | 6.1% | 2.6%(+3.45)#64 | 3.3%(+2.81)#5,660 |
| 65. | Samburg | 6.0% | 2.6%(+3.31)#65 | 3.3%(+2.67)#5,881 |
| 66. | Lafayette | 5.9% | 2.6%(+3.28)#66 | 3.3%(+2.64)#5,928 |
| 67. | Tennessee Ridge | 5.8% | 2.6%(+3.18)#67 | 3.3%(+2.54)#6,073 |
| 68. | Friendsville | 5.8% | 2.6%(+3.15)#68 | 3.3%(+2.51)#6,121 |
| 69. | Bell Buckle | 5.7% | 2.6%(+3.10)#69 | 3.3%(+2.46)#6,193 |
| 70. | Beersheba Springs | 5.7% | 2.6%(+3.08)#70 | 3.3%(+2.45)#6,226 |
| 71. | Harrogate | 5.7% | 2.6%(+3.04)#71 | 3.3%(+2.40)#6,311 |
| 72. | Auburntown | 5.6% | 2.6%(+2.98)#72 | 3.3%(+2.34)#6,427 |
| 73. | Fairfield Glade | 5.6% | 2.6%(+2.95)#73 | 3.3%(+2.31)#6,462 |
| 74. | Martin | 5.6% | 2.6%(+2.92)#74 | 3.3%(+2.28)#6,504 |
| 75. | Enville | 5.6% | 2.6%(+2.92)#75 | 3.3%(+2.28)#6,530 |
| 76. | John Sevier | 5.5% | 2.6%(+2.90)#76 | 3.3%(+2.26)#6,553 |
| 77. | Kingsport | 5.5% | 2.6%(+2.85)#77 | 3.3%(+2.21)#6,620 |
| 78. | Newport | 5.5% | 2.6%(+2.84)#78 | 3.3%(+2.20)#6,629 |
| 79. | Biltmore | 5.5% | 2.6%(+2.83)#79 | 3.3%(+2.19)#6,648 |
| 80. | Elizabethton | 5.4% | 2.6%(+2.79)#80 | 3.3%(+2.15)#6,731 |
| 81. | Rogersville | 5.4% | 2.6%(+2.77)#81 | 3.3%(+2.13)#6,760 |
| 82. | Jackson | 5.3% | 2.6%(+2.71)#82 | 3.3%(+2.07)#6,876 |
| 83. | Charlotte | 5.3% | 2.6%(+2.69)#83 | 3.3%(+2.05)#6,903 |
| 84. | Louisville | 5.3% | 2.6%(+2.69)#84 | 3.3%(+2.05)#6,916 |
| 85. | Baxter | 5.3% | 2.6%(+2.67)#85 | 3.3%(+2.03)#6,952 |
| 86. | Oneida | 5.3% | 2.6%(+2.62)#86 | 3.3%(+1.98)#7,038 |
| 87. | Wartburg | 5.2% | 2.6%(+2.58)#87 | 3.3%(+1.94)#7,135 |
| 88. | Dyer | 5.2% | 2.6%(+2.55)#88 | 3.3%(+1.91)#7,190 |
| 89. | Decaturville | 5.2% | 2.6%(+2.55)#89 | 3.3%(+1.91)#7,193 |
| 90. | Petersburg | 5.2% | 2.6%(+2.51)#90 | 3.3%(+1.87)#7,265 |
| 91. | Bells | 5.1% | 2.6%(+2.48)#91 | 3.3%(+1.84)#7,334 |
| 92. | Adams | 5.1% | 2.6%(+2.45)#92 | 3.3%(+1.81)#7,403 |
| 93. | Ripley | 5.1% | 2.6%(+2.44)#93 | 3.3%(+1.80)#7,440 |
| 94. | Powell | 5.1% | 2.6%(+2.42)#94 | 3.3%(+1.78)#7,466 |
| 95. | Whitwell | 5.0% | 2.6%(+2.40)#95 | 3.3%(+1.77)#7,512 |
| 96. | Brighton | 5.0% | 2.6%(+2.38)#96 | 3.3%(+1.74)#7,572 |
| 97. | Maynardville | 5.0% | 2.6%(+2.33)#97 | 3.3%(+1.69)#7,685 |
| 98. | Kenton | 4.9% | 2.6%(+2.31)#98 | 3.3%(+1.67)#7,719 |
| 99. | Fairmount | 4.9% | 2.6%(+2.30)#99 | 3.3%(+1.66)#7,730 |
| 100. | Fall Branch | 4.9% | 2.6%(+2.30)#100 | 3.3%(+1.66)#7,732 |
Common Questions
What are the Top 10 Cities with the Highest Percentage of Population Employed in Healthcare Support in Tennessee?
Top 10 Cities with the Highest Percentage of Population Employed in Healthcare Support in Tennessee are:
What city has the Highest Percentage of Population Employed in Healthcare Support in Tennessee?
Bethpage has the Highest Percentage of Population Employed in Healthcare Support in Tennessee with 61.2%.
What is the Percentage of Population Employed in Healthcare Support in the State of Tennessee?
Percentage of Population Employed in Healthcare Support in Tennessee is 2.6%.
What is the Percentage of Population Employed in Healthcare Support in the United States?
Percentage of Population Employed in Healthcare Support in the United States is 3.3%.