Cities with the Highest Percentage of Population Employed in Healthcare Support in Pennsylvania
RELATED REPORTS & OPTIONS
Healthcare Support
Pennsylvania
Compare Cities
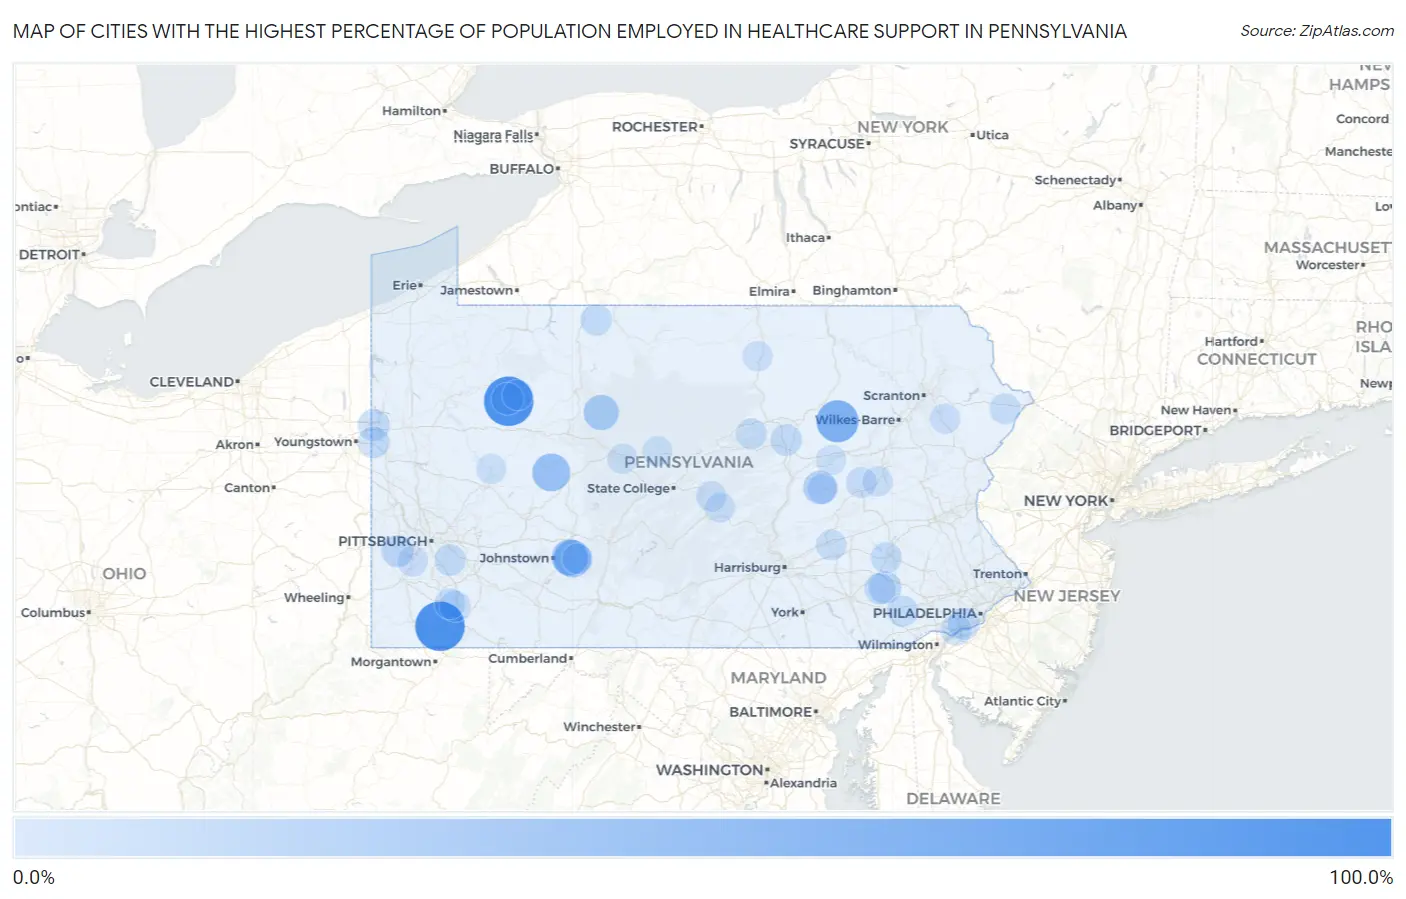
Map of Cities with the Highest Percentage of Population Employed in Healthcare Support in Pennsylvania
0.0%
100.0%
Cities with the Highest Percentage of Population Employed in Healthcare Support in Pennsylvania
| City | % Employed | vs State | vs National | |
| 1. | Leeper | 100.0% | 3.9%(+96.1)#1 | 3.3%(+96.7)#4 |
| 2. | Ronco | 100.0% | 3.9%(+96.1)#2 | 3.3%(+96.7)#13 |
| 3. | Point View | 66.7% | 3.9%(+62.8)#3 | 3.3%(+63.4)#38 |
| 4. | Waller | 64.7% | 3.9%(+60.8)#4 | 3.3%(+61.4)#40 |
| 5. | Frankstown | 51.1% | 3.9%(+47.2)#5 | 3.3%(+47.8)#79 |
| 6. | Rossiter | 46.0% | 3.9%(+42.1)#6 | 3.3%(+42.8)#108 |
| 7. | Sidman | 43.4% | 3.9%(+39.5)#7 | 3.3%(+40.2)#119 |
| 8. | Ore Hill | 41.0% | 3.9%(+37.1)#8 | 3.3%(+37.7)#132 |
| 9. | St Michael | 39.0% | 3.9%(+35.1)#9 | 3.3%(+35.7)#142 |
| 10. | Geeseytown | 37.0% | 3.9%(+33.1)#10 | 3.3%(+33.8)#155 |
| 11. | Byrnedale | 34.2% | 3.9%(+30.3)#11 | 3.3%(+31.0)#192 |
| 12. | Royer | 31.8% | 3.9%(+27.9)#12 | 3.3%(+28.5)#225 |
| 13. | Olivia | 27.9% | 3.9%(+24.0)#13 | 3.3%(+24.6)#296 |
| 14. | Tharptown Uniontown | 26.7% | 3.9%(+22.8)#14 | 3.3%(+23.4)#318 |
| 15. | Maxatawny | 25.0% | 3.9%(+21.1)#15 | 3.3%(+21.7)#353 |
| 16. | Colwyn Borough | 24.3% | 3.9%(+20.4)#16 | 3.3%(+21.0)#373 |
| 17. | Morea | 23.5% | 3.9%(+19.6)#17 | 3.3%(+20.2)#390 |
| 18. | Darby Borough | 22.9% | 3.9%(+19.0)#18 | 3.3%(+19.6)#413 |
| 19. | East Pittsburgh Borough | 21.8% | 3.9%(+17.9)#19 | 3.3%(+18.5)#453 |
| 20. | Goodville | 21.3% | 3.9%(+17.4)#20 | 3.3%(+18.1)#480 |
| 21. | West Middletown Borough | 21.1% | 3.9%(+17.2)#21 | 3.3%(+17.8)#493 |
| 22. | Newell Borough | 21.0% | 3.9%(+17.1)#22 | 3.3%(+17.7)#497 |
| 23. | Midway | 19.8% | 3.9%(+15.9)#23 | 3.3%(+16.5)#559 |
| 24. | Hop Bottom Borough | 19.7% | 3.9%(+15.8)#24 | 3.3%(+16.4)#563 |
| 25. | Tylersburg | 19.4% | 3.9%(+15.5)#25 | 3.3%(+16.1)#590 |
| 26. | Farrell | 19.1% | 3.9%(+15.2)#26 | 3.3%(+15.8)#603 |
| 27. | Prospect Park | 18.8% | 3.9%(+14.9)#27 | 3.3%(+15.5)#619 |
| 28. | New Bedford | 17.5% | 3.9%(+13.6)#28 | 3.3%(+14.2)#705 |
| 29. | Worthville Borough | 17.5% | 3.9%(+13.6)#29 | 3.3%(+14.2)#707 |
| 30. | Dewart | 17.3% | 3.9%(+13.4)#30 | 3.3%(+14.0)#717 |
| 31. | Boston | 17.1% | 3.9%(+13.2)#31 | 3.3%(+13.9)#723 |
| 32. | Rew | 16.7% | 3.9%(+12.8)#32 | 3.3%(+13.4)#757 |
| 33. | New Washington Borough | 16.7% | 3.9%(+12.8)#33 | 3.3%(+13.4)#763 |
| 34. | Conneautville Borough | 16.6% | 3.9%(+12.7)#34 | 3.3%(+13.3)#768 |
| 35. | Vintondale Borough | 16.6% | 3.9%(+12.7)#35 | 3.3%(+13.3)#771 |
| 36. | Blue Ball | 16.5% | 3.9%(+12.6)#36 | 3.3%(+13.2)#774 |
| 37. | West Lawn | 16.4% | 3.9%(+12.5)#37 | 3.3%(+13.1)#779 |
| 38. | Spartansburg Borough | 16.4% | 3.9%(+12.5)#38 | 3.3%(+13.1)#782 |
| 39. | Dushore Borough | 16.2% | 3.9%(+12.3)#39 | 3.3%(+12.9)#793 |
| 40. | Chester | 16.2% | 3.9%(+12.3)#40 | 3.3%(+12.9)#795 |
| 41. | East Conemaugh Borough | 16.2% | 3.9%(+12.3)#41 | 3.3%(+12.9)#796 |
| 42. | Birmingham Borough | 16.1% | 3.9%(+12.2)#42 | 3.3%(+12.8)#804 |
| 43. | Misericordia University | 16.1% | 3.9%(+12.2)#43 | 3.3%(+12.8)#806 |
| 44. | Smock | 15.9% | 3.9%(+12.0)#44 | 3.3%(+12.7)#825 |
| 45. | Westwood | 15.8% | 3.9%(+11.9)#45 | 3.3%(+12.5)#850 |
| 46. | Callensburg Borough | 14.9% | 3.9%(+11.0)#46 | 3.3%(+11.6)#956 |
| 47. | Gold Key Lake | 14.7% | 3.9%(+10.8)#47 | 3.3%(+11.4)#988 |
| 48. | Gallitzin Borough | 14.7% | 3.9%(+10.8)#48 | 3.3%(+11.4)#993 |
| 49. | Grindstone | 14.6% | 3.9%(+10.7)#49 | 3.3%(+11.4)#998 |
| 50. | Newburg | 14.6% | 3.9%(+10.7)#50 | 3.3%(+11.4)#999 |
| 51. | Ehrenfeld Borough | 14.5% | 3.9%(+10.6)#51 | 3.3%(+11.2)#1,028 |
| 52. | Shenandoah Heights | 14.3% | 3.9%(+10.4)#52 | 3.3%(+11.0)#1,050 |
| 53. | Jonestown | 14.3% | 3.9%(+10.4)#53 | 3.3%(+11.0)#1,066 |
| 54. | South Coatesville Borough | 14.2% | 3.9%(+10.3)#54 | 3.3%(+10.9)#1,085 |
| 55. | Oval | 14.2% | 3.9%(+10.3)#55 | 3.3%(+10.9)#1,086 |
| 56. | Lawrenceville Borough | 14.1% | 3.9%(+10.2)#56 | 3.3%(+10.8)#1,104 |
| 57. | Shirleysburg Borough | 14.0% | 3.9%(+10.1)#57 | 3.3%(+10.8)#1,112 |
| 58. | Conneaut Lake Borough | 13.9% | 3.9%(+10.0)#58 | 3.3%(+10.7)#1,128 |
| 59. | Girardville Borough | 13.9% | 3.9%(+9.99)#59 | 3.3%(+10.6)#1,141 |
| 60. | Sylvania Borough | 13.8% | 3.9%(+9.90)#60 | 3.3%(+10.5)#1,154 |
| 61. | Shamokin | 13.7% | 3.9%(+9.85)#61 | 3.3%(+10.5)#1,162 |
| 62. | Siglerville | 13.6% | 3.9%(+9.74)#62 | 3.3%(+10.4)#1,186 |
| 63. | New Morgan Borough | 13.6% | 3.9%(+9.74)#63 | 3.3%(+10.4)#1,190 |
| 64. | Mount Oliver Borough | 13.5% | 3.9%(+9.64)#64 | 3.3%(+10.3)#1,208 |
| 65. | Beaverdale | 13.5% | 3.9%(+9.59)#65 | 3.3%(+10.2)#1,221 |
| 66. | Hendersonville | 13.4% | 3.9%(+9.54)#66 | 3.3%(+10.2)#1,228 |
| 67. | South Fork Borough | 13.3% | 3.9%(+9.44)#67 | 3.3%(+10.1)#1,243 |
| 68. | Mount Jewett Borough | 13.1% | 3.9%(+9.22)#68 | 3.3%(+9.83)#1,303 |
| 69. | Ford City Borough | 13.1% | 3.9%(+9.21)#69 | 3.3%(+9.82)#1,305 |
| 70. | Homestead Borough | 13.0% | 3.9%(+9.06)#70 | 3.3%(+9.67)#1,333 |
| 71. | Bowmanstown Borough | 12.9% | 3.9%(+9.03)#71 | 3.3%(+9.65)#1,339 |
| 72. | Warrior Run Borough | 12.8% | 3.9%(+8.93)#72 | 3.3%(+9.54)#1,356 |
| 73. | Allenport Borough | 12.8% | 3.9%(+8.86)#73 | 3.3%(+9.48)#1,378 |
| 74. | Delano | 12.7% | 3.9%(+8.83)#74 | 3.3%(+9.45)#1,387 |
| 75. | East Side Borough | 12.7% | 3.9%(+8.80)#75 | 3.3%(+9.42)#1,395 |
| 76. | Seward Borough | 12.7% | 3.9%(+8.76)#76 | 3.3%(+9.38)#1,404 |
| 77. | Salladasburg Borough | 12.6% | 3.9%(+8.74)#77 | 3.3%(+9.35)#1,408 |
| 78. | Braddock Borough | 12.6% | 3.9%(+8.72)#78 | 3.3%(+9.34)#1,412 |
| 79. | Mill Run | 12.5% | 3.9%(+8.61)#79 | 3.3%(+9.22)#1,457 |
| 80. | Adamsburg Borough | 12.5% | 3.9%(+8.61)#80 | 3.3%(+9.22)#1,459 |
| 81. | Big Bass Lake | 12.4% | 3.9%(+8.47)#81 | 3.3%(+9.08)#1,488 |
| 82. | Hastings Borough | 12.3% | 3.9%(+8.39)#82 | 3.3%(+9.00)#1,503 |
| 83. | Alfarata | 12.3% | 3.9%(+8.37)#83 | 3.3%(+8.98)#1,511 |
| 84. | Vowinckel | 12.2% | 3.9%(+8.35)#84 | 3.3%(+8.97)#1,517 |
| 85. | Tunnelhill Borough | 12.1% | 3.9%(+8.18)#85 | 3.3%(+8.79)#1,567 |
| 86. | Northern Cambria Borough | 12.1% | 3.9%(+8.17)#86 | 3.3%(+8.78)#1,570 |
| 87. | Clarendon Borough | 12.1% | 3.9%(+8.17)#87 | 3.3%(+8.78)#1,571 |
| 88. | Moshannon | 11.9% | 3.9%(+8.03)#88 | 3.3%(+8.65)#1,600 |
| 89. | Bigler | 11.9% | 3.9%(+8.01)#89 | 3.3%(+8.62)#1,604 |
| 90. | Rupert | 11.9% | 3.9%(+7.99)#90 | 3.3%(+8.60)#1,616 |
| 91. | Middleport Borough | 11.9% | 3.9%(+7.97)#91 | 3.3%(+8.58)#1,620 |
| 92. | Cokeburg Borough | 11.8% | 3.9%(+7.92)#92 | 3.3%(+8.54)#1,627 |
| 93. | Arnot | 11.8% | 3.9%(+7.92)#93 | 3.3%(+8.53)#1,628 |
| 94. | Dawson Borough | 11.8% | 3.9%(+7.91)#94 | 3.3%(+8.52)#1,631 |
| 95. | Templeton | 11.8% | 3.9%(+7.87)#95 | 3.3%(+8.48)#1,640 |
| 96. | Mahanoy City Borough | 11.8% | 3.9%(+7.86)#96 | 3.3%(+8.48)#1,652 |
| 97. | Olyphant Borough | 11.8% | 3.9%(+7.86)#97 | 3.3%(+8.47)#1,653 |
| 98. | Everson Borough | 11.7% | 3.9%(+7.86)#98 | 3.3%(+8.47)#1,654 |
| 99. | Wall Borough | 11.7% | 3.9%(+7.84)#99 | 3.3%(+8.46)#1,658 |
| 100. | Jamestown Borough | 11.6% | 3.9%(+7.69)#100 | 3.3%(+8.31)#1,699 |
Common Questions
What are the Top 10 Cities with the Highest Percentage of Population Employed in Healthcare Support in Pennsylvania?
Top 10 Cities with the Highest Percentage of Population Employed in Healthcare Support in Pennsylvania are:
#1
100.0%
#2
100.0%
#3
64.7%
#4
46.0%
#5
43.4%
#6
39.0%
#7
34.2%
#8
26.7%
#9
21.3%
#10
19.8%
What city has the Highest Percentage of Population Employed in Healthcare Support in Pennsylvania?
Leeper has the Highest Percentage of Population Employed in Healthcare Support in Pennsylvania with 100.0%.
What is the Percentage of Population Employed in Healthcare Support in the State of Pennsylvania?
Percentage of Population Employed in Healthcare Support in Pennsylvania is 3.9%.
What is the Percentage of Population Employed in Healthcare Support in the United States?
Percentage of Population Employed in Healthcare Support in the United States is 3.3%.