Cities with the Highest Percentage of Population Employed in Healthcare Support in Massachusetts
RELATED REPORTS & OPTIONS
Healthcare Support
Massachusetts
Compare Cities
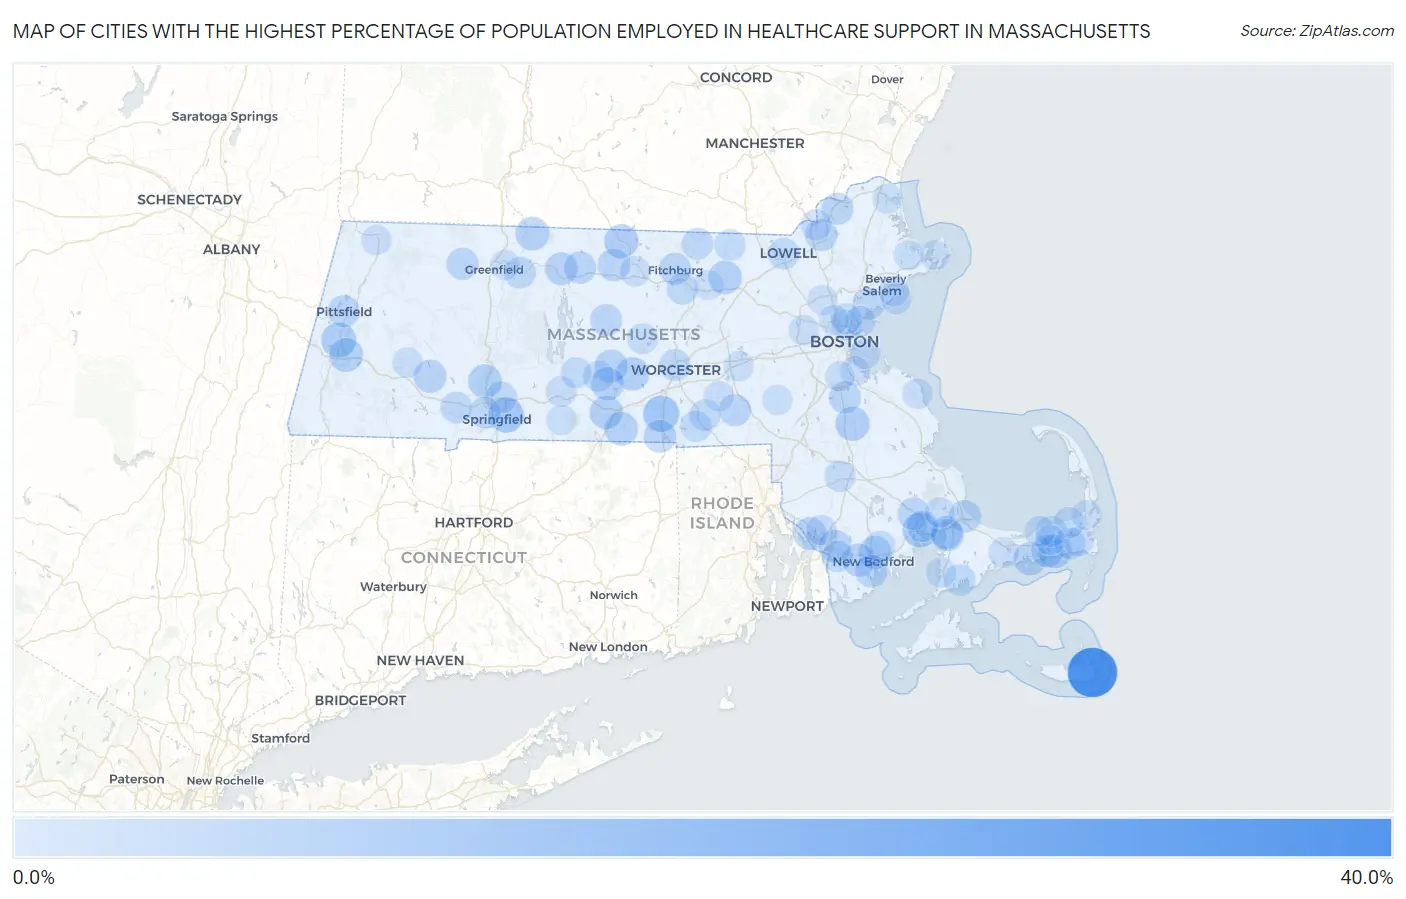
Map of Cities with the Highest Percentage of Population Employed in Healthcare Support in Massachusetts
0.0%
40.0%
Cities with the Highest Percentage of Population Employed in Healthcare Support in Massachusetts
| City | % Employed | vs State | vs National | |
| 1. | Siasconset | 34.6% | 3.3%(+31.3)#1 | 3.3%(+31.3)#188 |
| 2. | Oxford | 12.6% | 3.3%(+9.26)#2 | 3.3%(+9.33)#1,415 |
| 3. | Springfield | 11.2% | 3.3%(+7.87)#3 | 3.3%(+7.94)#1,824 |
| 4. | Lenox | 10.6% | 3.3%(+7.25)#4 | 3.3%(+7.32)#2,038 |
| 5. | Weweantic | 10.4% | 3.3%(+7.06)#5 | 3.3%(+7.12)#2,127 |
| 6. | Winchendon | 9.3% | 3.3%(+6.00)#6 | 3.3%(+6.07)#2,654 |
| 7. | Brockton | 9.3% | 3.3%(+6.00)#7 | 3.3%(+6.06)#2,655 |
| 8. | Lee | 8.7% | 3.3%(+5.36)#8 | 3.3%(+5.42)#3,017 |
| 9. | Holyoke | 8.7% | 3.3%(+5.33)#9 | 3.3%(+5.40)#3,043 |
| 10. | Northfield | 8.7% | 3.3%(+5.33)#10 | 3.3%(+5.39)#3,045 |
| 11. | Dennis Port | 8.6% | 3.3%(+5.30)#11 | 3.3%(+5.36)#3,064 |
| 12. | Ayer | 8.3% | 3.3%(+4.99)#12 | 3.3%(+5.06)#3,256 |
| 13. | Southbridge Town | 8.3% | 3.3%(+4.99)#13 | 3.3%(+5.06)#3,257 |
| 14. | Spencer | 8.2% | 3.3%(+4.83)#14 | 3.3%(+4.89)#3,395 |
| 15. | Fiskdale | 8.1% | 3.3%(+4.78)#15 | 3.3%(+4.84)#3,448 |
| 16. | North Brookfield | 7.9% | 3.3%(+4.57)#16 | 3.3%(+4.64)#3,609 |
| 17. | West Yarmouth | 7.8% | 3.3%(+4.49)#17 | 3.3%(+4.55)#3,673 |
| 18. | Brookfield | 7.8% | 3.3%(+4.41)#18 | 3.3%(+4.48)#3,738 |
| 19. | New Bedford | 7.7% | 3.3%(+4.39)#19 | 3.3%(+4.46)#3,750 |
| 20. | Smith Mills | 7.7% | 3.3%(+4.33)#20 | 3.3%(+4.40)#3,824 |
| 21. | Ocean Grove | 7.5% | 3.3%(+4.15)#21 | 3.3%(+4.22)#3,982 |
| 22. | Huntington | 7.5% | 3.3%(+4.12)#22 | 3.3%(+4.19)#4,009 |
| 23. | Webster | 7.3% | 3.3%(+3.92)#23 | 3.3%(+3.98)#4,201 |
| 24. | Orange | 7.2% | 3.3%(+3.88)#24 | 3.3%(+3.94)#4,252 |
| 25. | Fall River | 7.0% | 3.3%(+3.65)#25 | 3.3%(+3.72)#4,495 |
| 26. | Bourne | 6.9% | 3.3%(+3.55)#26 | 3.3%(+3.62)#4,598 |
| 27. | Athol | 6.9% | 3.3%(+3.51)#27 | 3.3%(+3.58)#4,647 |
| 28. | West Wareham | 6.8% | 3.3%(+3.49)#28 | 3.3%(+3.55)#4,681 |
| 29. | Sagamore | 6.8% | 3.3%(+3.45)#29 | 3.3%(+3.51)#4,724 |
| 30. | Baldwinville | 6.8% | 3.3%(+3.44)#30 | 3.3%(+3.51)#4,726 |
| 31. | Bliss Corner | 6.7% | 3.3%(+3.38)#31 | 3.3%(+3.44)#4,798 |
| 32. | Greenfield | 6.7% | 3.3%(+3.35)#32 | 3.3%(+3.41)#4,829 |
| 33. | West Dennis | 6.7% | 3.3%(+3.34)#33 | 3.3%(+3.41)#4,833 |
| 34. | Monument Beach | 6.6% | 3.3%(+3.21)#34 | 3.3%(+3.27)#5,009 |
| 35. | Lawrence | 6.5% | 3.3%(+3.14)#35 | 3.3%(+3.20)#5,100 |
| 36. | Hopedale | 6.2% | 3.3%(+2.89)#36 | 3.3%(+2.95)#5,447 |
| 37. | Pittsfield | 6.1% | 3.3%(+2.79)#37 | 3.3%(+2.86)#5,584 |
| 38. | Shelburne Falls | 6.1% | 3.3%(+2.73)#38 | 3.3%(+2.79)#5,680 |
| 39. | Fitchburg | 6.0% | 3.3%(+2.69)#39 | 3.3%(+2.76)#5,732 |
| 40. | Haverhill | 6.0% | 3.3%(+2.63)#40 | 3.3%(+2.70)#5,834 |
| 41. | Randolph Town | 5.9% | 3.3%(+2.60)#41 | 3.3%(+2.66)#5,900 |
| 42. | Barre | 5.9% | 3.3%(+2.55)#42 | 3.3%(+2.62)#5,949 |
| 43. | Lynn | 5.8% | 3.3%(+2.41)#43 | 3.3%(+2.48)#6,178 |
| 44. | Chicopee | 5.6% | 3.3%(+2.29)#44 | 3.3%(+2.36)#6,392 |
| 45. | Townsend | 5.6% | 3.3%(+2.26)#45 | 3.3%(+2.33)#6,442 |
| 46. | West Springfield Town | 5.5% | 3.3%(+2.11)#46 | 3.3%(+2.18)#6,678 |
| 47. | Westfield | 5.4% | 3.3%(+2.10)#47 | 3.3%(+2.16)#6,697 |
| 48. | Worcester | 5.4% | 3.3%(+2.10)#48 | 3.3%(+2.16)#6,698 |
| 49. | Millers Falls | 5.4% | 3.3%(+2.06)#49 | 3.3%(+2.13)#6,756 |
| 50. | Leominster | 5.4% | 3.3%(+2.04)#50 | 3.3%(+2.10)#6,821 |
| 51. | Whitinsville | 5.3% | 3.3%(+2.00)#51 | 3.3%(+2.07)#6,875 |
| 52. | Lowell | 5.3% | 3.3%(+1.99)#52 | 3.3%(+2.05)#6,913 |
| 53. | Wareham Center | 5.3% | 3.3%(+1.95)#53 | 3.3%(+2.02)#6,976 |
| 54. | East Falmouth | 5.2% | 3.3%(+1.89)#54 | 3.3%(+1.96)#7,099 |
| 55. | Harwich Center | 5.1% | 3.3%(+1.76)#55 | 3.3%(+1.82)#7,372 |
| 56. | North Westport | 5.1% | 3.3%(+1.73)#56 | 3.3%(+1.80)#7,442 |
| 57. | East Douglas | 5.0% | 3.3%(+1.67)#57 | 3.3%(+1.73)#7,591 |
| 58. | Taunton | 4.8% | 3.3%(+1.49)#58 | 3.3%(+1.55)#7,969 |
| 59. | East Pepperell | 4.8% | 3.3%(+1.49)#59 | 3.3%(+1.55)#7,970 |
| 60. | Methuen Town | 4.8% | 3.3%(+1.43)#60 | 3.3%(+1.49)#8,105 |
| 61. | West Brookfield | 4.7% | 3.3%(+1.38)#61 | 3.3%(+1.45)#8,208 |
| 62. | Everett | 4.7% | 3.3%(+1.33)#62 | 3.3%(+1.39)#8,356 |
| 63. | East Dennis | 4.5% | 3.3%(+1.20)#63 | 3.3%(+1.26)#8,670 |
| 64. | Marblehead | 4.5% | 3.3%(+1.19)#64 | 3.3%(+1.25)#8,690 |
| 65. | Malden | 4.5% | 3.3%(+1.14)#65 | 3.3%(+1.20)#8,808 |
| 66. | Acushnet Center | 4.5% | 3.3%(+1.13)#66 | 3.3%(+1.19)#8,833 |
| 67. | Ware | 4.5% | 3.3%(+1.10)#67 | 3.3%(+1.17)#8,884 |
| 68. | Brewster | 4.4% | 3.3%(+1.06)#68 | 3.3%(+1.13)#8,988 |
| 69. | Revere | 4.3% | 3.3%(+0.912)#69 | 3.3%(+0.978)#9,385 |
| 70. | Palmer Town | 4.0% | 3.3%(+0.669)#70 | 3.3%(+0.735)#10,058 |
| 71. | Rutland | 3.9% | 3.3%(+0.597)#71 | 3.3%(+0.663)#10,255 |
| 72. | Dennis | 3.8% | 3.3%(+0.462)#72 | 3.3%(+0.527)#10,634 |
| 73. | North Attleborough | 3.7% | 3.3%(+0.398)#73 | 3.3%(+0.463)#10,803 |
| 74. | Scituate | 3.7% | 3.3%(+0.345)#74 | 3.3%(+0.410)#10,965 |
| 75. | Boston | 3.7% | 3.3%(+0.326)#75 | 3.3%(+0.392)#11,010 |
| 76. | White Island Shores | 3.7% | 3.3%(+0.318)#76 | 3.3%(+0.384)#11,033 |
| 77. | Salem | 3.6% | 3.3%(+0.300)#77 | 3.3%(+0.365)#11,083 |
| 78. | Upton | 3.6% | 3.3%(+0.266)#78 | 3.3%(+0.331)#11,190 |
| 79. | Somerset | 3.6% | 3.3%(+0.242)#79 | 3.3%(+0.308)#11,263 |
| 80. | East Harwich | 3.6% | 3.3%(+0.221)#80 | 3.3%(+0.287)#11,327 |
| 81. | Gardner | 3.5% | 3.3%(+0.170)#81 | 3.3%(+0.236)#11,487 |
| 82. | Barnstable Town | 3.5% | 3.3%(+0.170)#82 | 3.3%(+0.236)#11,488 |
| 83. | North Adams | 3.5% | 3.3%(+0.139)#83 | 3.3%(+0.205)#11,600 |
| 84. | West Falmouth | 3.4% | 3.3%(+0.034)#84 | 3.3%(+0.099)#11,948 |
| 85. | Chester | 3.4% | 3.3%(+0.006)#85 | 3.3%(+0.072)#12,033 |
| 86. | Essex | 3.3% | 3.3%(-0.006)#86 | 3.3%(+0.060)#12,061 |
| 87. | Waltham | 3.3% | 3.3%(-0.022)#87 | 3.3%(+0.044)#12,131 |
| 88. | Millis Clicquot | 3.3% | 3.3%(-0.046)#88 | 3.3%(+0.019)#12,183 |
| 89. | Monson Center | 3.3% | 3.3%(-0.062)#89 | 3.3%(+0.003)#12,241 |
| 90. | Cordaville | 3.3% | 3.3%(-0.090)#90 | 3.3%(-0.024)#12,354 |
| 91. | Woburn | 3.3% | 3.3%(-0.095)#91 | 3.3%(-0.029)#12,364 |
| 92. | Newburyport | 3.2% | 3.3%(-0.109)#92 | 3.3%(-0.043)#12,410 |
| 93. | Gloucester | 3.2% | 3.3%(-0.126)#93 | 3.3%(-0.061)#12,486 |
| 94. | Medford | 3.2% | 3.3%(-0.132)#94 | 3.3%(-0.067)#12,507 |
| 95. | South Dennis | 3.2% | 3.3%(-0.149)#95 | 3.3%(-0.084)#12,585 |
| 96. | Quincy | 3.2% | 3.3%(-0.171)#96 | 3.3%(-0.105)#12,664 |
| 97. | Turners Falls | 3.1% | 3.3%(-0.215)#97 | 3.3%(-0.149)#12,825 |
| 98. | Orleans | 3.1% | 3.3%(-0.216)#98 | 3.3%(-0.151)#12,827 |
| 99. | Shirley | 3.1% | 3.3%(-0.286)#99 | 3.3%(-0.220)#13,069 |
| 100. | Milton | 3.0% | 3.3%(-0.351)#100 | 3.3%(-0.285)#13,337 |
Common Questions
What are the Top 10 Cities with the Highest Percentage of Population Employed in Healthcare Support in Massachusetts?
Top 10 Cities with the Highest Percentage of Population Employed in Healthcare Support in Massachusetts are:
#1
34.6%
#2
12.6%
#3
11.2%
#4
10.6%
#5
10.4%
#6
9.3%
#7
9.3%
#8
8.7%
#9
8.7%
#10
8.7%
What city has the Highest Percentage of Population Employed in Healthcare Support in Massachusetts?
Siasconset has the Highest Percentage of Population Employed in Healthcare Support in Massachusetts with 34.6%.
What is the Percentage of Population Employed in Healthcare Support in the State of Massachusetts?
Percentage of Population Employed in Healthcare Support in Massachusetts is 3.3%.
What is the Percentage of Population Employed in Healthcare Support in the United States?
Percentage of Population Employed in Healthcare Support in the United States is 3.3%.