Cities with the Highest Percentage of Population Employed in Healthcare Support in Delaware

RELATED REPORTS & OPTIONS

Healthcare Support
Population
Families and Households
Female Fertility
Female Fertility (Unmarried)
Race (Community Size)
Race (Percentage)
Ancestry (Community Size)
AfghanAfricanAlaska NativeAlaskan AthabascanAlbanianAleutAlsatianAmericanApacheArabArapahoArgentineanArmenianAssyrian / Chaldean / SyriacAustralianAustrianBahamianBangladeshiBarbadianBasqueBelgianBelizeanBermudanBhutaneseBlackfeetBolivianBrazilianBritishBritish West IndianBulgarianBurmeseCajunCambodianCanadianCape VerdeanCarpatho RusynCelticCentral AmericanCentral American IndianCherokeeCheyenneChickasawChileanChineseChippewaChoctawColombianColvilleComancheCosta RicanCreeCreekCroatianCrowCubanCypriotCzechCzechoslovakianDanishDelawareDominicanDutchDutch West IndianEastern EuropeanEcuadorianEgyptianEnglishEstonianEthiopianEuropeanFijianFilipinoFinnishFrenchFrench American IndianFrench CanadianGermanGerman RussianGhanaianGreekGuamanian / ChamorroGuatemalanGuyaneseHaitianHmongHonduranHopiHoumaHungarianIcelanderIndian (Asian)IndonesianInupiatIranianIraqiIrishIroquoisIsraeliItalianJamaicanJapaneseJordanianKenyanKiowaKoreanLaotianLatvianLebaneseLiberianLithuanianLumbeeLuxembourgerMacedonianMalaysianMalteseMarshalleseMenomineeMexicanMexican American IndianMongolianMoroccanNative HawaiianNavajoNepaleseNew ZealanderNicaraguanNigerianNorthern EuropeanNorwegianOkinawanOsageOttawaPaiutePakistaniPalestinianPanamanianParaguayanPennsylvania GermanPeruvianPimaPolishPortuguesePotawatomiPuebloPuerto RicanPuget Sound SalishRomanianRussianSalvadoranSamoanScandinavianScotch-IrishScottishSeminoleSenegaleseSerbianShoshoneSierra LeoneanSiouxSlavicSlovakSloveneSomaliSouth AfricanSouth AmericanSouth American IndianSoviet UnionSpaniardSpanishSpanish AmericanSpanish American IndianSri LankanSubsaharan AfricanSudaneseSwedishSwissSyrianTaiwaneseThaiTlingit-HaidaTohono O'OdhamTonganTrinidadian and TobagonianTsimshianTurkishU.S. Virgin IslanderUgandanUkrainianUruguayanUteVenezuelanVietnameseWelshWest IndianYakamaYaquiYugoslavianYumanYup'ikZimbabwean
Ancestry (Percentage)
AfghanAfricanAlaska NativeAlaskan AthabascanAlbanianAleutAlsatianAmericanApacheArabArapahoArgentineanArmenianAssyrian / Chaldean / SyriacAustralianAustrianBahamianBangladeshiBarbadianBasqueBelgianBelizeanBermudanBhutaneseBlackfeetBolivianBrazilianBritishBritish West IndianBulgarianBurmeseCajunCambodianCanadianCape VerdeanCarpatho RusynCelticCentral AmericanCentral American IndianCherokeeCheyenneChickasawChileanChineseChippewaChoctawColombianColvilleComancheCosta RicanCreeCreekCroatianCrowCubanCypriotCzechCzechoslovakianDanishDelawareDominicanDutchDutch West IndianEastern EuropeanEcuadorianEgyptianEnglishEstonianEthiopianEuropeanFijianFilipinoFinnishFrenchFrench American IndianFrench CanadianGermanGerman RussianGhanaianGreekGuamanian / ChamorroGuatemalanGuyaneseHaitianHmongHonduranHopiHoumaHungarianIcelanderIndian (Asian)IndonesianInupiatIranianIraqiIrishIroquoisIsraeliItalianJamaicanJapaneseJordanianKenyanKiowaKoreanLaotianLatvianLebaneseLiberianLithuanianLumbeeLuxembourgerMacedonianMalaysianMalteseMarshalleseMenomineeMexicanMexican American IndianMongolianMoroccanNative HawaiianNavajoNepaleseNew ZealanderNicaraguanNigerianNorthern EuropeanNorwegianOkinawanOsageOttawaPaiutePakistaniPalestinianPanamanianParaguayanPennsylvania GermanPeruvianPimaPolishPortuguesePotawatomiPuebloPuerto RicanPuget Sound SalishRomanianRussianSalvadoranSamoanScandinavianScotch-IrishScottishSeminoleSenegaleseSerbianShoshoneSierra LeoneanSiouxSlavicSlovakSloveneSomaliSouth AfricanSouth AmericanSouth American IndianSoviet UnionSpaniardSpanishSpanish AmericanSpanish American IndianSri LankanSubsaharan AfricanSudaneseSwedishSwissSyrianTaiwaneseThaiTlingit-HaidaTohono O'OdhamTonganTrinidadian and TobagonianTsimshianTurkishU.S. Virgin IslanderUgandanUkrainianUruguayanUteVenezuelanVietnameseWelshWest IndianYakamaYaquiYugoslavianYumanYup'ikZimbabwean
Immigrant Origin (Total)
AfghanistanAfricaAlbaniaArgentinaArmeniaAsiaAustraliaAustriaAzoresBahamasBangladeshBarbadosBelarusBelgiumBelizeBoliviaBosnia and HerzegovinaBrazilBulgariaBurma / MyanmarCabo VerdeCambodiaCameroonCanadaCaribbeanCentral AmericaChileChinaColombiaCongoCosta RicaCroatiaCubaCzechoslovakiaDenmarkDominicaDominican RepublicEastern AfricaEastern AsiaEastern EuropeEcuadorEgyptEl SalvadorEnglandEritreaEthiopiaEuropeFijiFranceGermanyGhanaGreeceGrenadaGuatemalaGuyanaHaitiHondurasHong KongHungaryIndiaIndonesiaIranIraqIrelandIsraelItalyJamaicaJapanJordanKazakhstanKenyaKoreaKuwaitLaosLatin AmericaLatviaLebanonLiberiaLithuaniaMalaysiaMexicoMicronesiaMiddle AfricaMoldovaMoroccoNepalNetherlandsNicaraguaNigeriaNorth MacedoniaNorthern AfricaNorthern EuropeNorwayOceaniaPakistanPanamaPeruPhilippinesPolandPortugalRomaniaRussiaSaudi ArabiaScotlandSenegalSerbiaSierra LeoneSingaporeSomaliaSouth AfricaSouth AmericaSouth Central AsiaSouth Eastern AsiaSouthern EuropeSpainSri LankaSt. Vincent and the GrenadinesSudanSwedenSwitzerlandSyriaTaiwanThailandTrinidad and TobagoTurkeyUgandaUkraineUruguayUzbekistanVenezuelaVietnamWest IndiesWestern AfricaWestern AsiaWestern EuropeYemenZaireZimbabwe
Immigrant Origin (Percentage)
AfghanistanAfricaAlbaniaArgentinaArmeniaAsiaAustraliaAustriaAzoresBahamasBangladeshBarbadosBelarusBelgiumBelizeBoliviaBosnia and HerzegovinaBrazilBulgariaBurma / MyanmarCabo VerdeCambodiaCameroonCanadaCaribbeanCentral AmericaChileChinaColombiaCongoCosta RicaCroatiaCubaCzechoslovakiaDenmarkDominicaDominican RepublicEastern AfricaEastern AsiaEastern EuropeEcuadorEgyptEl SalvadorEnglandEritreaEthiopiaEuropeFijiFranceGermanyGhanaGreeceGrenadaGuatemalaGuyanaHaitiHondurasHong KongHungaryIndiaIndonesiaIranIraqIrelandIsraelItalyJamaicaJapanJordanKazakhstanKenyaKoreaKuwaitLaosLatin AmericaLatviaLebanonLiberiaLithuaniaMalaysiaMexicoMicronesiaMiddle AfricaMoldovaMoroccoNepalNetherlandsNicaraguaNigeriaNorth MacedoniaNorthern AfricaNorthern EuropeNorwayOceaniaPakistanPanamaPeruPhilippinesPolandPortugalRomaniaRussiaSaudi ArabiaScotlandSenegalSerbiaSierra LeoneSingaporeSomaliaSouth AfricaSouth AmericaSouth Central AsiaSouth Eastern AsiaSouthern EuropeSpainSri LankaSt. Vincent and the GrenadinesSudanSwedenSwitzerlandSyriaTaiwanThailandTrinidad and TobagoTurkeyUgandaUkraineUruguayUzbekistanVenezuelaVietnamWest IndiesWestern AfricaWestern AsiaWestern EuropeYemenZaireZimbabwe
Income
Income (Families)
Income (Households)
Poverty
Poverty (Families)
Unemployment
Employment Occupations
Employment Industries
Employer Class
Commute Time
Commute Means
School Enrollment
Education by Degree Field
Occupancy
Finances
Physical Characteristics
Delaware
Compare Cities
Comparison Subject

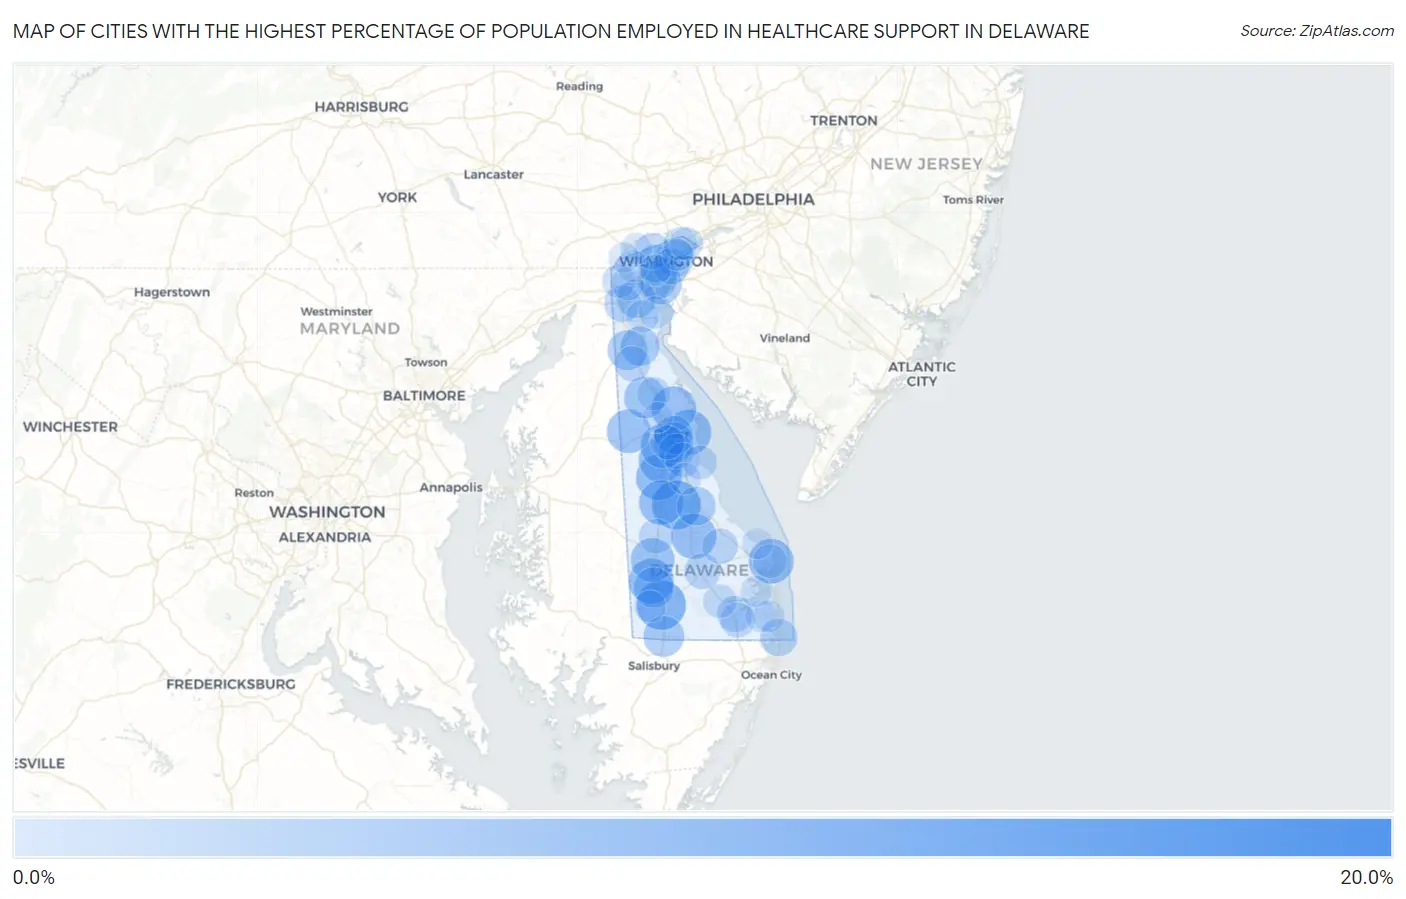
Map of Cities with the Highest Percentage of Population Employed in Healthcare Support in Delaware

0.0%
20.0%
Cities with the Highest Percentage of Population Employed in Healthcare Support in Delaware Map

Cities with the Highest Percentage of Population Employed in Healthcare Support in Delaware

City % Employed vs State vs National
1.Lincoln19.4%3.3%(+16.1)#13.3%(+16.1)#586
2.Laurel10.3%3.3%(+6.99)#23.3%(+6.99)#2,190
3.Houston9.9%3.3%(+6.64)#33.3%(+6.64)#2,361
4.Felton8.2%3.3%(+4.92)#43.3%(+4.92)#3,374
5.Little Creek8.1%3.3%(+4.81)#53.3%(+4.81)#3,474
6.Woodside8.0%3.3%(+4.76)#63.3%(+4.76)#3,513
7.Seaford8.0%3.3%(+4.71)#73.3%(+4.71)#3,551
8.Ellendale8.0%3.3%(+4.70)#83.3%(+4.70)#3,556
9.Leipsic7.9%3.3%(+4.59)#93.3%(+4.59)#3,645
10.Henlopen Acres7.8%3.3%(+4.53)#103.3%(+4.53)#3,691
11.Harrington7.7%3.3%(+4.41)#113.3%(+4.41)#3,819
12.Wyoming7.4%3.3%(+4.14)#123.3%(+4.14)#4,059
13.Bridgeville7.3%3.3%(+4.04)#133.3%(+4.04)#4,155
14.Hartly7.2%3.3%(+3.97)#143.3%(+3.97)#4,224
15.Clayton6.1%3.3%(+2.87)#153.3%(+2.87)#5,565
16.New Castle5.9%3.3%(+2.60)#163.3%(+2.60)#5,994
17.Delmar5.6%3.3%(+2.28)#173.3%(+2.28)#6,509
18.Blades5.5%3.3%(+2.20)#183.3%(+2.20)#6,631
19.Kent Acres5.4%3.3%(+2.08)#193.3%(+2.08)#6,860
20.Middletown5.2%3.3%(+1.88)#203.3%(+1.88)#7,247
21.Odessa4.8%3.3%(+1.54)#213.3%(+1.54)#7,997
22.Wilmington Manor4.7%3.3%(+1.40)#223.3%(+1.40)#8,327
23.Milford4.6%3.3%(+1.30)#233.3%(+1.30)#8,574
24.Bear4.6%3.3%(+1.29)#243.3%(+1.29)#8,598
25.Edgemoor4.5%3.3%(+1.20)#253.3%(+1.20)#8,812
26.Dover4.5%3.3%(+1.19)#263.3%(+1.18)#8,853
27.Elsmere4.2%3.3%(+0.949)#273.3%(+0.948)#9,460
28.Fenwick Island3.7%3.3%(+0.459)#283.3%(+0.459)#10,819
29.Greenville3.4%3.3%(+0.152)#293.3%(+0.151)#11,792
30.Glasgow3.3%3.3%(-0.013)#303.3%(-0.014)#12,311
31.Wilmington3.2%3.3%(-0.062)#313.3%(-0.062)#12,495
32.Georgetown3.0%3.3%(-0.251)#323.3%(-0.251)#13,192
33.Dagsboro3.0%3.3%(-0.263)#333.3%(-0.264)#13,235
34.Milton2.8%3.3%(-0.450)#343.3%(-0.451)#13,977
35.Townsend2.7%3.3%(-0.543)#353.3%(-0.544)#14,368
36.Rising Sun Lebanon2.7%3.3%(-0.625)#363.3%(-0.625)#14,620
37.Frankford2.5%3.3%(-0.742)#373.3%(-0.743)#15,094
38.Greenwood2.5%3.3%(-0.770)#383.3%(-0.771)#15,201
39.Magnolia2.3%3.3%(-0.980)#393.3%(-0.981)#16,000
40.Rodney Village2.0%3.3%(-1.27)#403.3%(-1.27)#17,078
41.Rehoboth Beach2.0%3.3%(-1.31)#413.3%(-1.31)#17,243
42.Bowers2.0%3.3%(-1.32)#423.3%(-1.32)#17,278
43.Millsboro1.9%3.3%(-1.38)#433.3%(-1.38)#17,551
44.Ardencroft1.8%3.3%(-1.52)#443.3%(-1.53)#18,151
45.Newark1.7%3.3%(-1.56)#453.3%(-1.56)#18,302
46.Smyrna1.6%3.3%(-1.63)#463.3%(-1.63)#18,557
47.Brookside1.6%3.3%(-1.66)#473.3%(-1.66)#18,661
48.Claymont1.6%3.3%(-1.72)#483.3%(-1.72)#18,898
49.St Georges1.2%3.3%(-2.06)#493.3%(-2.06)#20,156
50.Delaware City1.1%3.3%(-2.17)#503.3%(-2.17)#20,510
51.Pike Creek Valley0.93%3.3%(-2.35)#513.3%(-2.35)#21,121
52.Millville0.90%3.3%(-2.38)#523.3%(-2.38)#21,247
53.Ocean View0.88%3.3%(-2.40)#533.3%(-2.40)#21,314
54.Bethel0.84%3.3%(-2.44)#543.3%(-2.44)#21,442
55.Frederica0.83%3.3%(-2.45)#553.3%(-2.45)#21,480
56.Hockessin0.75%3.3%(-2.53)#563.3%(-2.53)#21,726
57.Bellefonte0.73%3.3%(-2.55)#573.3%(-2.55)#21,808
58.Newport0.55%3.3%(-2.72)#583.3%(-2.73)#22,218
59.Long Neck0.45%3.3%(-2.83)#593.3%(-2.83)#22,448
60.Cheswold0.41%3.3%(-2.86)#603.3%(-2.86)#22,527
61.Lewes0.34%3.3%(-2.94)#613.3%(-2.94)#22,668
62.North Star0.14%3.3%(-3.14)#623.3%(-3.14)#22,861

Common Questions

What are the Top 10 Cities with the Highest Percentage of Population Employed in Healthcare Support in Delaware?
Top 10 Cities with the Highest Percentage of Population Employed in Healthcare Support in Delaware are:
#1
10.3%
#2
9.9%
#3
8.2%
#4
8.1%
#5
8.0%
#6
8.0%
#7
8.0%
#8
7.9%
#9
7.8%
#10
7.7%
What city has the Highest Percentage of Population Employed in Healthcare Support in Delaware?
Laurel has the Highest Percentage of Population Employed in Healthcare Support in Delaware with 10.3%.
What is the Percentage of Population Employed in Healthcare Support in the State of Delaware?
Percentage of Population Employed in Healthcare Support in Delaware is 3.3%.
What is the Percentage of Population Employed in Healthcare Support in the United States?
Percentage of Population Employed in Healthcare Support in the United States is 3.3%.