Cities with the Highest Percentage of Population Employed in Healthcare Support in Indiana
RELATED REPORTS & OPTIONS
Healthcare Support
Indiana
Compare Cities
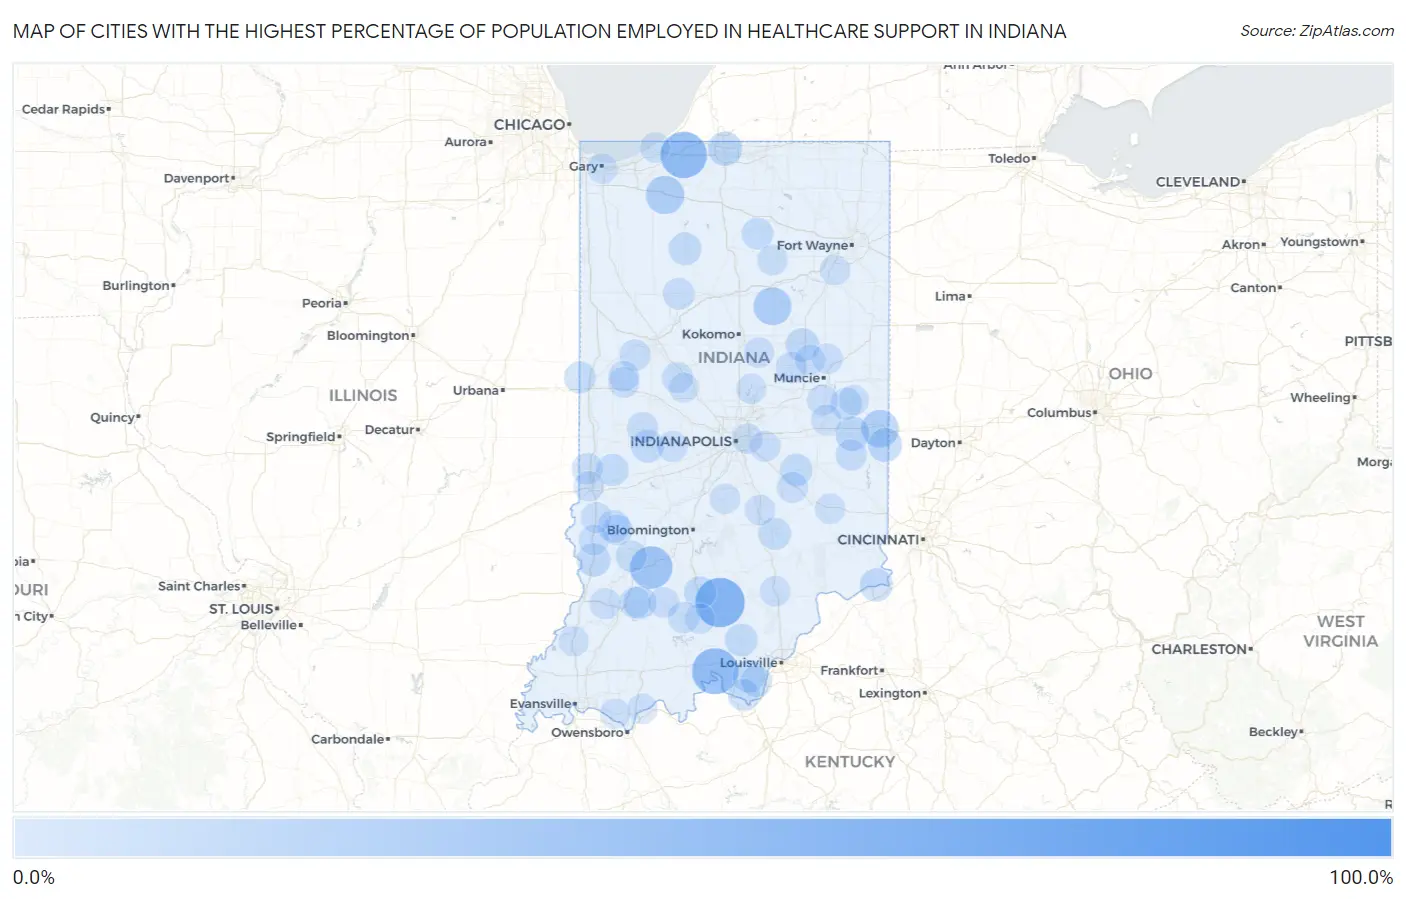
Map of Cities with the Highest Percentage of Population Employed in Healthcare Support in Indiana
0.0%
100.0%
Cities with the Highest Percentage of Population Employed in Healthcare Support in Indiana
| City | % Employed | vs State | vs National | |
| 1. | Burney | 100.0% | 3.0%(+97.0)#1 | 3.3%(+96.7)#16 |
| 2. | Judson | 62.5% | 3.0%(+59.5)#2 | 3.3%(+59.2)#45 |
| 3. | Saltillo | 57.4% | 3.0%(+54.4)#3 | 3.3%(+54.1)#58 |
| 4. | Lincoln | 56.0% | 3.0%(+53.0)#4 | 3.3%(+52.7)#61 |
| 5. | Rolling Prairie | 49.4% | 3.0%(+46.4)#5 | 3.3%(+46.1)#95 |
| 6. | Leavenworth | 48.4% | 3.0%(+45.4)#6 | 3.3%(+45.1)#97 |
| 7. | Scotland | 39.1% | 3.0%(+36.1)#7 | 3.3%(+35.9)#141 |
| 8. | Depauw | 38.5% | 3.0%(+35.5)#8 | 3.3%(+35.2)#145 |
| 9. | New Lisbon | 37.1% | 3.0%(+34.1)#9 | 3.3%(+33.9)#154 |
| 10. | Mays | 28.6% | 3.0%(+25.6)#10 | 3.3%(+25.3)#278 |
| 11. | Hanna | 28.4% | 3.0%(+25.4)#11 | 3.3%(+25.1)#284 |
| 12. | Somerset | 27.1% | 3.0%(+24.1)#12 | 3.3%(+23.8)#312 |
| 13. | Spring Grove | 26.1% | 3.0%(+23.1)#13 | 3.3%(+22.9)#332 |
| 14. | Grammer | 25.0% | 3.0%(+22.0)#14 | 3.3%(+21.7)#348 |
| 15. | Palestine | 22.5% | 3.0%(+19.5)#15 | 3.3%(+19.2)#429 |
| 16. | Needmore | 22.5% | 3.0%(+19.5)#16 | 3.3%(+19.2)#431 |
| 17. | Laotto | 20.5% | 3.0%(+17.5)#17 | 3.3%(+17.2)#516 |
| 18. | Williamsburg | 19.1% | 3.0%(+16.1)#18 | 3.3%(+15.8)#602 |
| 19. | Lyford | 18.7% | 3.0%(+15.7)#19 | 3.3%(+15.4)#623 |
| 20. | East Germantown | 18.0% | 3.0%(+15.0)#20 | 3.3%(+14.7)#672 |
| 21. | Roseland | 17.8% | 3.0%(+14.8)#21 | 3.3%(+14.5)#685 |
| 22. | Boston | 17.3% | 3.0%(+14.3)#22 | 3.3%(+14.0)#719 |
| 23. | Arthur | 17.1% | 3.0%(+14.1)#23 | 3.3%(+13.9)#725 |
| 24. | South Milford | 16.3% | 3.0%(+13.3)#24 | 3.3%(+13.0)#786 |
| 25. | Eden | 16.3% | 3.0%(+13.3)#25 | 3.3%(+13.0)#790 |
| 26. | Mongo | 16.1% | 3.0%(+13.1)#26 | 3.3%(+12.8)#799 |
| 27. | Fowlerton | 16.0% | 3.0%(+13.1)#27 | 3.3%(+12.8)#813 |
| 28. | Carlisle | 15.9% | 3.0%(+12.9)#28 | 3.3%(+12.6)#828 |
| 29. | Linn Grove | 15.6% | 3.0%(+12.6)#29 | 3.3%(+12.3)#873 |
| 30. | Florence | 15.0% | 3.0%(+12.0)#30 | 3.3%(+11.7)#953 |
| 31. | Cannelburg | 14.5% | 3.0%(+11.6)#31 | 3.3%(+11.3)#1,014 |
| 32. | Van Bibber Lake | 14.4% | 3.0%(+11.4)#32 | 3.3%(+11.2)#1,035 |
| 33. | Winamac | 14.3% | 3.0%(+11.3)#33 | 3.3%(+11.0)#1,077 |
| 34. | Everton | 14.2% | 3.0%(+11.2)#34 | 3.3%(+10.9)#1,088 |
| 35. | Palmyra | 14.1% | 3.0%(+11.1)#35 | 3.3%(+10.9)#1,095 |
| 36. | New Middletown | 13.9% | 3.0%(+10.9)#36 | 3.3%(+10.6)#1,140 |
| 37. | Prairie Creek | 13.8% | 3.0%(+10.9)#37 | 3.3%(+10.6)#1,146 |
| 38. | Manilla | 13.7% | 3.0%(+10.7)#38 | 3.3%(+10.4)#1,176 |
| 39. | Putnamville | 13.6% | 3.0%(+10.6)#39 | 3.3%(+10.3)#1,198 |
| 40. | Coalmont | 13.4% | 3.0%(+10.4)#40 | 3.3%(+10.1)#1,230 |
| 41. | Mitchell | 13.4% | 3.0%(+10.4)#41 | 3.3%(+10.1)#1,231 |
| 42. | Fontanet | 13.0% | 3.0%(+9.99)#42 | 3.3%(+9.71)#1,325 |
| 43. | Elizabethtown | 12.7% | 3.0%(+9.73)#43 | 3.3%(+9.45)#1,386 |
| 44. | Losantville | 11.9% | 3.0%(+8.86)#44 | 3.3%(+8.57)#1,621 |
| 45. | Burket | 11.8% | 3.0%(+8.77)#45 | 3.3%(+8.48)#1,643 |
| 46. | Laconia | 11.8% | 3.0%(+8.77)#46 | 3.3%(+8.48)#1,648 |
| 47. | State Line City | 11.7% | 3.0%(+8.69)#47 | 3.3%(+8.41)#1,670 |
| 48. | Sardinia | 11.5% | 3.0%(+8.54)#48 | 3.3%(+8.26)#1,720 |
| 49. | Idaville | 11.5% | 3.0%(+8.52)#49 | 3.3%(+8.24)#1,730 |
| 50. | West Baden Springs | 11.2% | 3.0%(+8.22)#50 | 3.3%(+7.94)#1,823 |
| 51. | Harrison Lake | 11.2% | 3.0%(+8.21)#51 | 3.3%(+7.93)#1,829 |
| 52. | Lamb | 11.2% | 3.0%(+8.21)#52 | 3.3%(+7.92)#1,832 |
| 53. | Hoffman Lake | 11.1% | 3.0%(+8.12)#53 | 3.3%(+7.83)#1,861 |
| 54. | Lyons | 10.9% | 3.0%(+7.92)#54 | 3.3%(+7.63)#1,929 |
| 55. | Elizabeth | 10.8% | 3.0%(+7.77)#55 | 3.3%(+7.49)#1,986 |
| 56. | New Goshen | 10.7% | 3.0%(+7.69)#56 | 3.3%(+7.40)#2,013 |
| 57. | Montgomery | 10.6% | 3.0%(+7.62)#57 | 3.3%(+7.33)#2,030 |
| 58. | West Point | 10.4% | 3.0%(+7.42)#58 | 3.3%(+7.14)#2,121 |
| 59. | Homer | 10.4% | 3.0%(+7.38)#59 | 3.3%(+7.10)#2,137 |
| 60. | Colfax | 10.3% | 3.0%(+7.35)#60 | 3.3%(+7.07)#2,145 |
| 61. | Connersville | 10.3% | 3.0%(+7.30)#61 | 3.3%(+7.02)#2,176 |
| 62. | Alexandria | 10.2% | 3.0%(+7.22)#62 | 3.3%(+6.93)#2,218 |
| 63. | Wellsboro | 10.1% | 3.0%(+7.06)#63 | 3.3%(+6.77)#2,292 |
| 64. | Waldron | 10.0% | 3.0%(+6.96)#64 | 3.3%(+6.67)#2,346 |
| 65. | Wheatland | 9.9% | 3.0%(+6.91)#65 | 3.3%(+6.63)#2,372 |
| 66. | Springport | 9.9% | 3.0%(+6.86)#66 | 3.3%(+6.58)#2,400 |
| 67. | Heritage Lake | 9.8% | 3.0%(+6.82)#67 | 3.3%(+6.53)#2,412 |
| 68. | Jasonville | 9.8% | 3.0%(+6.76)#68 | 3.3%(+6.48)#2,441 |
| 69. | Malden | 9.7% | 3.0%(+6.66)#69 | 3.3%(+6.38)#2,490 |
| 70. | Russellville | 9.6% | 3.0%(+6.65)#70 | 3.3%(+6.36)#2,498 |
| 71. | Raub | 9.5% | 3.0%(+6.53)#71 | 3.3%(+6.24)#2,560 |
| 72. | Underwood | 9.5% | 3.0%(+6.47)#72 | 3.3%(+6.18)#2,586 |
| 73. | Shoals | 9.4% | 3.0%(+6.43)#73 | 3.3%(+6.14)#2,605 |
| 74. | Mellott | 9.4% | 3.0%(+6.38)#74 | 3.3%(+6.10)#2,634 |
| 75. | Farmersburg | 9.1% | 3.0%(+6.15)#75 | 3.3%(+5.86)#2,745 |
| 76. | Eaton | 9.0% | 3.0%(+6.03)#76 | 3.3%(+5.75)#2,840 |
| 77. | Newtown | 9.0% | 3.0%(+6.01)#77 | 3.3%(+5.73)#2,849 |
| 78. | Laketon | 9.0% | 3.0%(+5.99)#78 | 3.3%(+5.70)#2,859 |
| 79. | Gaston | 8.8% | 3.0%(+5.85)#79 | 3.3%(+5.56)#2,930 |
| 80. | New Palestine | 8.8% | 3.0%(+5.79)#80 | 3.3%(+5.51)#2,964 |
| 81. | Sullivan | 8.6% | 3.0%(+5.64)#81 | 3.3%(+5.36)#3,067 |
| 82. | Austin | 8.6% | 3.0%(+5.57)#82 | 3.3%(+5.29)#3,120 |
| 83. | Warren Park | 8.6% | 3.0%(+5.57)#83 | 3.3%(+5.28)#3,124 |
| 84. | Taylorsville | 8.5% | 3.0%(+5.50)#84 | 3.3%(+5.21)#3,169 |
| 85. | Windfall City | 8.5% | 3.0%(+5.48)#85 | 3.3%(+5.19)#3,192 |
| 86. | New Castle | 8.4% | 3.0%(+5.44)#86 | 3.3%(+5.16)#3,211 |
| 87. | Hatfield | 8.4% | 3.0%(+5.43)#87 | 3.3%(+5.15)#3,217 |
| 88. | New Point | 8.3% | 3.0%(+5.34)#88 | 3.3%(+5.05)#3,270 |
| 89. | Modoc | 8.3% | 3.0%(+5.34)#89 | 3.3%(+5.05)#3,276 |
| 90. | Paoli | 8.2% | 3.0%(+5.19)#90 | 3.3%(+4.90)#3,390 |
| 91. | Morgantown | 8.2% | 3.0%(+5.18)#91 | 3.3%(+4.90)#3,394 |
| 92. | Zanesville | 8.2% | 3.0%(+5.16)#92 | 3.3%(+4.87)#3,421 |
| 93. | Pottawattamie Park | 8.1% | 3.0%(+5.11)#93 | 3.3%(+4.83)#3,463 |
| 94. | West Terre Haute | 8.1% | 3.0%(+5.11)#94 | 3.3%(+4.82)#3,468 |
| 95. | Cicero | 7.9% | 3.0%(+4.94)#95 | 3.3%(+4.65)#3,592 |
| 96. | Gary | 7.9% | 3.0%(+4.93)#96 | 3.3%(+4.65)#3,599 |
| 97. | Grandview | 7.8% | 3.0%(+4.80)#97 | 3.3%(+4.51)#3,712 |
| 98. | Thorntown | 7.7% | 3.0%(+4.74)#98 | 3.3%(+4.45)#3,761 |
| 99. | Patoka | 7.7% | 3.0%(+4.71)#99 | 3.3%(+4.43)#3,776 |
| 100. | Hortonville | 7.7% | 3.0%(+4.70)#100 | 3.3%(+4.41)#3,798 |
Common Questions
What are the Top 10 Cities with the Highest Percentage of Population Employed in Healthcare Support in Indiana?
Top 10 Cities with the Highest Percentage of Population Employed in Healthcare Support in Indiana are:
#1
57.4%
#2
49.4%
#3
48.4%
#4
39.1%
#5
28.4%
#6
27.1%
#7
26.1%
#8
18.0%
#9
17.8%
#10
17.3%
What city has the Highest Percentage of Population Employed in Healthcare Support in Indiana?
Saltillo has the Highest Percentage of Population Employed in Healthcare Support in Indiana with 57.4%.
What is the Percentage of Population Employed in Healthcare Support in the State of Indiana?
Percentage of Population Employed in Healthcare Support in Indiana is 3.0%.
What is the Percentage of Population Employed in Healthcare Support in the United States?
Percentage of Population Employed in Healthcare Support in the United States is 3.3%.