Cities with the Highest Percentage of Population Employed in Healthcare Support in Texas
RELATED REPORTS & OPTIONS
Healthcare Support
Texas
Compare Cities
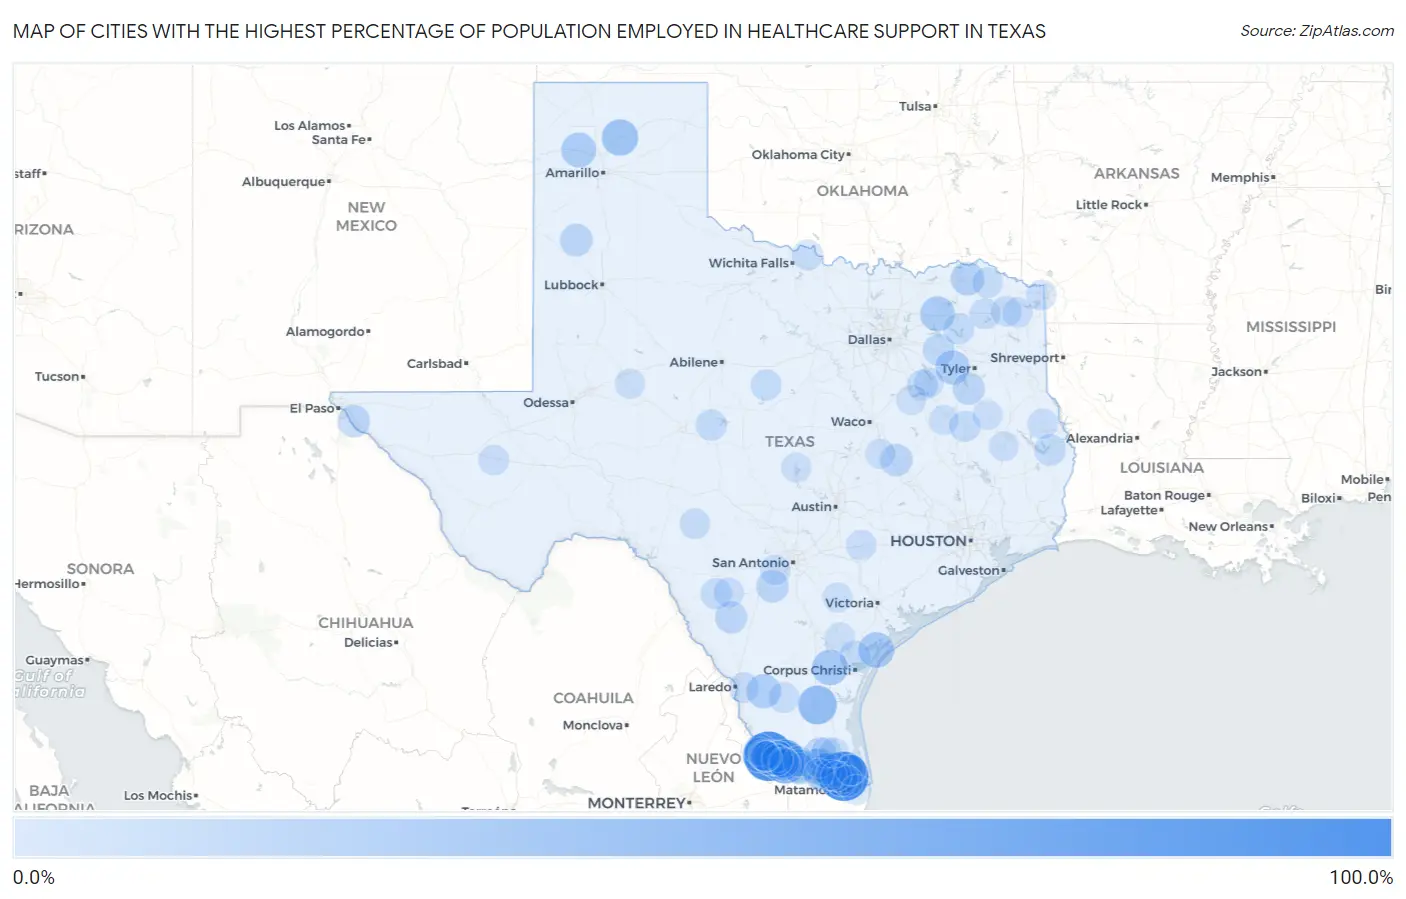
Map of Cities with the Highest Percentage of Population Employed in Healthcare Support in Texas
0.0%
100.0%
Cities with the Highest Percentage of Population Employed in Healthcare Support in Texas
| City | % Employed | vs State | vs National | |
| 1. | La Chuparosa | 100.0% | 2.9%(+97.1)#1 | 3.3%(+96.7)#12 |
| 2. | Lago | 100.0% | 2.9%(+97.1)#2 | 3.3%(+96.7)#19 |
| 3. | Alto Bonito Heights | 64.7% | 2.9%(+61.7)#3 | 3.3%(+61.4)#41 |
| 4. | Chula Vista Cdp Zavala County | 63.2% | 2.9%(+60.2)#4 | 3.3%(+59.9)#44 |
| 5. | La Victoria | 61.4% | 2.9%(+58.4)#5 | 3.3%(+58.1)#48 |
| 6. | Brookston | 53.8% | 2.9%(+50.9)#6 | 3.3%(+50.6)#73 |
| 7. | Flowella | 50.0% | 2.9%(+47.1)#7 | 3.3%(+46.7)#90 |
| 8. | Lockett | 46.5% | 2.9%(+43.6)#8 | 3.3%(+43.2)#105 |
| 9. | Santa Rosa | 45.2% | 2.9%(+42.3)#9 | 3.3%(+41.9)#110 |
| 10. | Ben Arnold | 40.9% | 2.9%(+38.0)#10 | 3.3%(+37.6)#133 |
| 11. | Sanford | 40.0% | 2.9%(+37.1)#11 | 3.3%(+36.7)#137 |
| 12. | Villa Del Sol | 37.5% | 2.9%(+34.6)#12 | 3.3%(+34.2)#150 |
| 13. | Fluvanna | 37.5% | 2.9%(+34.6)#13 | 3.3%(+34.2)#152 |
| 14. | Fulton | 36.9% | 2.9%(+34.0)#14 | 3.3%(+33.7)#157 |
| 15. | Deerwood | 36.7% | 2.9%(+33.8)#15 | 3.3%(+33.5)#160 |
| 16. | Rancho Banquete | 36.6% | 2.9%(+33.7)#16 | 3.3%(+33.3)#162 |
| 17. | El Quiote | 35.7% | 2.9%(+32.8)#17 | 3.3%(+32.4)#170 |
| 18. | Fronton | 33.3% | 2.9%(+30.4)#18 | 3.3%(+30.1)#197 |
| 19. | Boys Ranch | 33.3% | 2.9%(+30.4)#19 | 3.3%(+30.1)#198 |
| 20. | Campbell | 33.2% | 2.9%(+30.3)#20 | 3.3%(+30.0)#207 |
| 21. | Heidelberg | 33.1% | 2.9%(+30.1)#21 | 3.3%(+29.8)#209 |
| 22. | Callender Lake | 30.6% | 2.9%(+27.7)#22 | 3.3%(+27.3)#244 |
| 23. | Muniz | 30.5% | 2.9%(+27.6)#23 | 3.3%(+27.3)#246 |
| 24. | Mirando City | 30.5% | 2.9%(+27.6)#24 | 3.3%(+27.2)#247 |
| 25. | Juarez | 30.3% | 2.9%(+27.4)#25 | 3.3%(+27.0)#254 |
| 26. | Perezville | 27.6% | 2.9%(+24.7)#26 | 3.3%(+24.3)#300 |
| 27. | Sun Valley | 27.3% | 2.9%(+24.3)#27 | 3.3%(+24.0)#307 |
| 28. | La Escondida | 27.0% | 2.9%(+24.0)#28 | 3.3%(+23.7)#315 |
| 29. | Springlake | 23.8% | 2.9%(+20.9)#29 | 3.3%(+20.5)#382 |
| 30. | Calvert | 23.7% | 2.9%(+20.8)#30 | 3.3%(+20.4)#384 |
| 31. | Bixby | 23.3% | 2.9%(+20.4)#31 | 3.3%(+20.0)#398 |
| 32. | Bigfoot | 23.1% | 2.9%(+20.2)#32 | 3.3%(+19.8)#406 |
| 33. | Morning Glory | 22.8% | 2.9%(+19.9)#33 | 3.3%(+19.5)#416 |
| 34. | Hargill | 22.6% | 2.9%(+19.7)#34 | 3.3%(+19.3)#424 |
| 35. | Encantada Ranchito El Calaboz | 22.5% | 2.9%(+19.5)#35 | 3.3%(+19.2)#432 |
| 36. | Cuney | 22.4% | 2.9%(+19.5)#36 | 3.3%(+19.1)#436 |
| 37. | Big Wells | 21.3% | 2.9%(+18.4)#37 | 3.3%(+18.0)#482 |
| 38. | Salineno | 20.8% | 2.9%(+17.9)#38 | 3.3%(+17.6)#504 |
| 39. | Progreso | 20.4% | 2.9%(+17.5)#39 | 3.3%(+17.1)#522 |
| 40. | Myrtle Springs | 19.9% | 2.9%(+17.0)#40 | 3.3%(+16.7)#555 |
| 41. | Las Lomas | 19.6% | 2.9%(+16.7)#41 | 3.3%(+16.4)#567 |
| 42. | La Minita | 19.4% | 2.9%(+16.5)#42 | 3.3%(+16.1)#583 |
| 43. | La Coma Heights | 19.3% | 2.9%(+16.4)#43 | 3.3%(+16.0)#592 |
| 44. | Salineno North | 19.0% | 2.9%(+16.1)#44 | 3.3%(+15.8)#606 |
| 45. | La Grulla | 19.0% | 2.9%(+16.0)#45 | 3.3%(+15.7)#610 |
| 46. | Palmview South | 18.7% | 2.9%(+15.7)#46 | 3.3%(+15.4)#625 |
| 47. | Browndell | 18.5% | 2.9%(+15.6)#47 | 3.3%(+15.2)#633 |
| 48. | La Pryor | 18.0% | 2.9%(+15.1)#48 | 3.3%(+14.7)#664 |
| 49. | Taft Southwest | 17.8% | 2.9%(+14.9)#49 | 3.3%(+14.5)#683 |
| 50. | Yantis | 17.6% | 2.9%(+14.7)#50 | 3.3%(+14.4)#692 |
| 51. | Grapeland | 17.1% | 2.9%(+14.1)#51 | 3.3%(+13.8)#735 |
| 52. | Paint Rock | 17.0% | 2.9%(+14.0)#52 | 3.3%(+13.7)#743 |
| 53. | Rising Star | 17.0% | 2.9%(+14.0)#53 | 3.3%(+13.7)#745 |
| 54. | El Rancho Vela | 16.9% | 2.9%(+13.9)#54 | 3.3%(+13.6)#748 |
| 55. | Arroyo Gardens | 16.9% | 2.9%(+13.9)#55 | 3.3%(+13.6)#749 |
| 56. | Miller S Cove | 16.7% | 2.9%(+13.7)#56 | 3.3%(+13.4)#761 |
| 57. | Goodlow | 16.3% | 2.9%(+13.3)#57 | 3.3%(+13.0)#789 |
| 58. | Petrolia | 16.2% | 2.9%(+13.2)#58 | 3.3%(+12.9)#797 |
| 59. | Ranchitos East | 16.1% | 2.9%(+13.2)#59 | 3.3%(+12.8)#800 |
| 60. | Las Lomitas | 16.1% | 2.9%(+13.2)#60 | 3.3%(+12.8)#805 |
| 61. | Clarksville | 16.0% | 2.9%(+13.1)#61 | 3.3%(+12.8)#815 |
| 62. | East Alto Bonito | 15.8% | 2.9%(+12.9)#62 | 3.3%(+12.5)#840 |
| 63. | Sunset Cdp Montague County | 15.5% | 2.9%(+12.6)#63 | 3.3%(+12.3)#875 |
| 64. | Indian Hills | 15.5% | 2.9%(+12.6)#64 | 3.3%(+12.3)#878 |
| 65. | Omaha | 15.5% | 2.9%(+12.6)#65 | 3.3%(+12.2)#879 |
| 66. | Palmer | 15.4% | 2.9%(+12.5)#66 | 3.3%(+12.2)#892 |
| 67. | Rocksprings | 15.4% | 2.9%(+12.4)#67 | 3.3%(+12.1)#905 |
| 68. | Citrus City | 15.3% | 2.9%(+12.4)#68 | 3.3%(+12.0)#908 |
| 69. | Garza Salinas Ii | 15.0% | 2.9%(+12.1)#69 | 3.3%(+11.7)#952 |
| 70. | Roma | 14.9% | 2.9%(+12.0)#70 | 3.3%(+11.6)#958 |
| 71. | Balmorhea | 14.8% | 2.9%(+11.8)#71 | 3.3%(+11.5)#981 |
| 72. | Mesquite | 14.8% | 2.9%(+11.8)#72 | 3.3%(+11.5)#983 |
| 73. | Lacoste | 14.7% | 2.9%(+11.7)#73 | 3.3%(+11.4)#994 |
| 74. | San Augustine | 14.5% | 2.9%(+11.5)#74 | 3.3%(+11.2)#1,032 |
| 75. | Nash | 14.4% | 2.9%(+11.4)#75 | 3.3%(+11.1)#1,044 |
| 76. | Marietta | 14.3% | 2.9%(+11.4)#76 | 3.3%(+11.0)#1,061 |
| 77. | Olmito | 14.2% | 2.9%(+11.3)#77 | 3.3%(+11.0)#1,080 |
| 78. | Waelder | 14.2% | 2.9%(+11.3)#78 | 3.3%(+11.0)#1,081 |
| 79. | La Blanca | 14.2% | 2.9%(+11.2)#79 | 3.3%(+10.9)#1,091 |
| 80. | Lasara | 14.1% | 2.9%(+11.2)#80 | 3.3%(+10.8)#1,099 |
| 81. | La Feria | 14.0% | 2.9%(+11.1)#81 | 3.3%(+10.7)#1,118 |
| 82. | La Tina Ranch | 14.0% | 2.9%(+11.1)#82 | 3.3%(+10.7)#1,120 |
| 83. | Batesville | 13.9% | 2.9%(+11.0)#83 | 3.3%(+10.6)#1,135 |
| 84. | Oak Ridge Town Cooke County | 13.8% | 2.9%(+10.8)#84 | 3.3%(+10.5)#1,158 |
| 85. | Buchanan Lake Village | 13.7% | 2.9%(+10.8)#85 | 3.3%(+10.4)#1,171 |
| 86. | Skidmore | 13.7% | 2.9%(+10.7)#86 | 3.3%(+10.4)#1,177 |
| 87. | Scissors | 13.6% | 2.9%(+10.7)#87 | 3.3%(+10.4)#1,182 |
| 88. | Forsan | 13.5% | 2.9%(+10.6)#88 | 3.3%(+10.2)#1,222 |
| 89. | Richland | 13.4% | 2.9%(+10.5)#89 | 3.3%(+10.1)#1,236 |
| 90. | West Alto Bonito | 13.4% | 2.9%(+10.4)#90 | 3.3%(+10.1)#1,239 |
| 91. | Runge | 13.3% | 2.9%(+10.4)#91 | 3.3%(+10.1)#1,242 |
| 92. | Raymondville | 13.3% | 2.9%(+10.4)#92 | 3.3%(+10.0)#1,253 |
| 93. | South Point | 13.3% | 2.9%(+10.4)#93 | 3.3%(+10.0)#1,254 |
| 94. | Oakwood | 13.3% | 2.9%(+10.3)#94 | 3.3%(+9.98)#1,268 |
| 95. | Rangerville | 13.2% | 2.9%(+10.3)#95 | 3.3%(+9.93)#1,279 |
| 96. | Escobares | 13.2% | 2.9%(+10.3)#96 | 3.3%(+9.92)#1,280 |
| 97. | Trinidad | 13.1% | 2.9%(+10.2)#97 | 3.3%(+9.86)#1,295 |
| 98. | Alto | 13.1% | 2.9%(+10.2)#98 | 3.3%(+9.83)#1,302 |
| 99. | Diboll | 13.1% | 2.9%(+10.2)#99 | 3.3%(+9.82)#1,307 |
| 100. | Rosebud | 13.1% | 2.9%(+10.1)#100 | 3.3%(+9.78)#1,312 |
Common Questions
What are the Top 10 Cities with the Highest Percentage of Population Employed in Healthcare Support in Texas?
Top 10 Cities with the Highest Percentage of Population Employed in Healthcare Support in Texas are:
#1
100.0%
#2
100.0%
#3
64.7%
#4
61.4%
#5
50.0%
#6
45.2%
#7
40.0%
#8
37.5%
#9
36.9%
#10
36.6%
What city has the Highest Percentage of Population Employed in Healthcare Support in Texas?
La Chuparosa has the Highest Percentage of Population Employed in Healthcare Support in Texas with 100.0%.
What is the Percentage of Population Employed in Healthcare Support in the State of Texas?
Percentage of Population Employed in Healthcare Support in Texas is 2.9%.
What is the Percentage of Population Employed in Healthcare Support in the United States?
Percentage of Population Employed in Healthcare Support in the United States is 3.3%.