Cities with the Highest Percentage of Population Employed in Healthcare Support in Michigan
RELATED REPORTS & OPTIONS
Healthcare Support
Michigan
Compare Cities
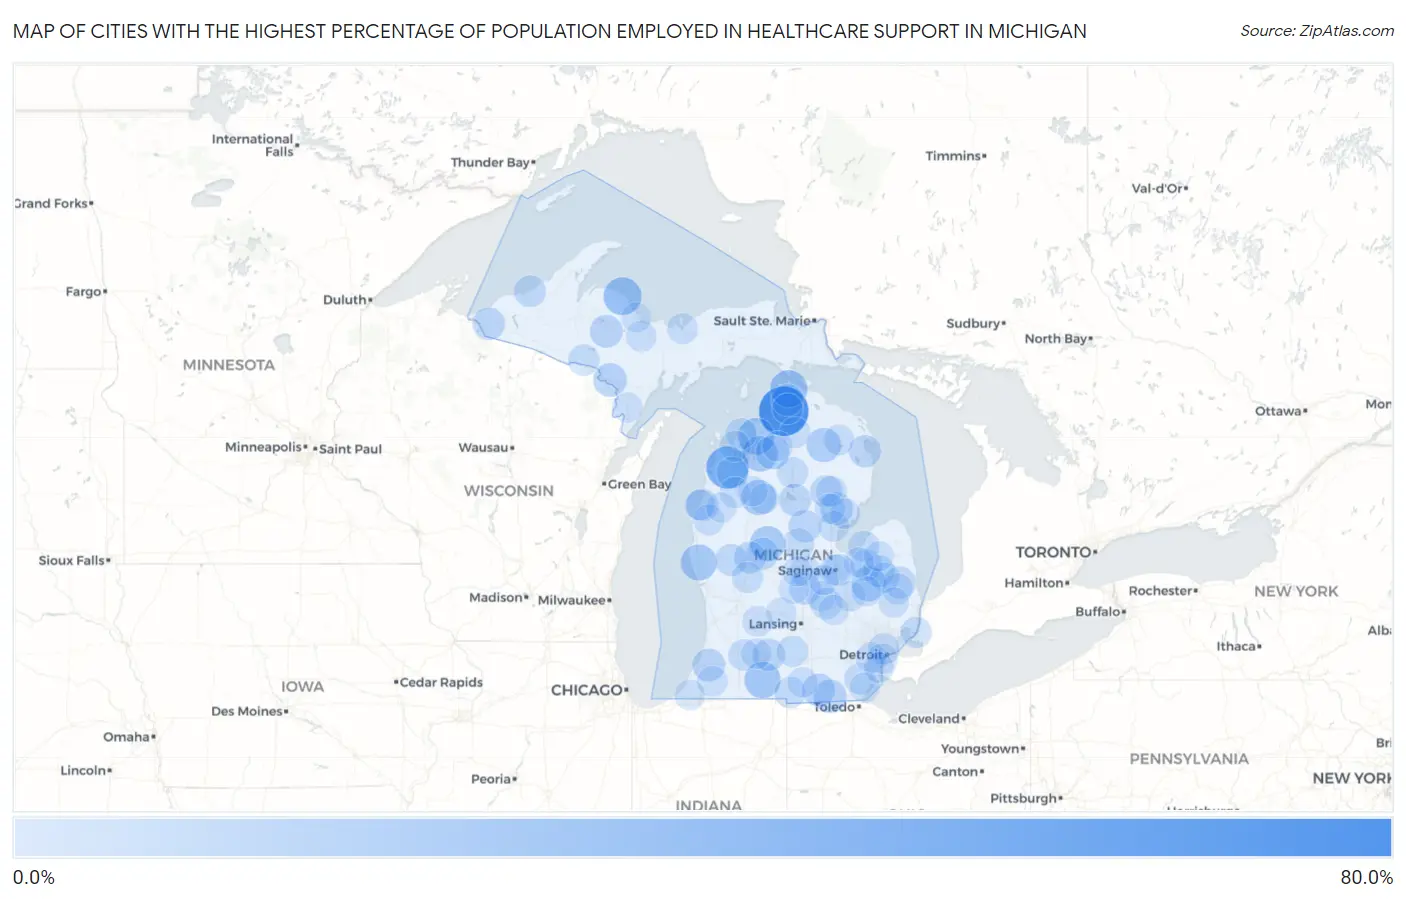
Map of Cities with the Highest Percentage of Population Employed in Healthcare Support in Michigan
0.0%
80.0%
Cities with the Highest Percentage of Population Employed in Healthcare Support in Michigan
| City | % Employed | vs State | vs National | |
| 1. | Conway | 61.5% | 3.5%(+58.0)#1 | 3.3%(+58.3)#47 |
| 2. | Maple Grove | 40.9% | 3.5%(+37.4)#2 | 3.3%(+37.6)#135 |
| 3. | Rockland | 28.8% | 3.5%(+25.3)#3 | 3.3%(+25.5)#272 |
| 4. | Big Bay | 28.3% | 3.5%(+24.8)#4 | 3.3%(+25.0)#288 |
| 5. | Carp Lake | 26.4% | 3.5%(+22.9)#5 | 3.3%(+23.2)#325 |
| 6. | Eastport | 24.5% | 3.5%(+21.0)#6 | 3.3%(+21.2)#365 |
| 7. | Sherwood | 23.7% | 3.5%(+20.2)#7 | 3.3%(+20.4)#385 |
| 8. | Rothbury | 23.2% | 3.5%(+19.7)#8 | 3.3%(+19.9)#401 |
| 9. | Alden | 22.0% | 3.5%(+18.5)#9 | 3.3%(+18.7)#449 |
| 10. | Barryton | 21.2% | 3.5%(+17.7)#10 | 3.3%(+17.9)#486 |
| 11. | Jennings | 21.2% | 3.5%(+17.7)#11 | 3.3%(+17.9)#488 |
| 12. | Fostoria | 19.8% | 3.5%(+16.3)#12 | 3.3%(+16.5)#557 |
| 13. | Atlanta | 18.8% | 3.5%(+15.3)#13 | 3.3%(+15.5)#616 |
| 14. | Nunica | 18.4% | 3.5%(+14.9)#14 | 3.3%(+15.2)#640 |
| 15. | Mancelona | 17.4% | 3.5%(+13.9)#15 | 3.3%(+14.1)#713 |
| 16. | Norway | 16.8% | 3.5%(+13.3)#16 | 3.3%(+13.5)#755 |
| 17. | Jasper | 16.0% | 3.5%(+12.5)#17 | 3.3%(+12.8)#817 |
| 18. | Greenland | 15.8% | 3.5%(+12.3)#18 | 3.3%(+12.5)#847 |
| 19. | Republic | 14.8% | 3.5%(+11.3)#19 | 3.3%(+11.5)#971 |
| 20. | Prescott | 14.7% | 3.5%(+11.1)#20 | 3.3%(+11.4)#992 |
| 21. | Clayton | 14.6% | 3.5%(+11.1)#21 | 3.3%(+11.3)#1,009 |
| 22. | Hartford | 14.5% | 3.5%(+11.0)#22 | 3.3%(+11.2)#1,019 |
| 23. | Dodgeville | 14.1% | 3.5%(+10.6)#23 | 3.3%(+10.8)#1,103 |
| 24. | Gladwin | 13.9% | 3.5%(+10.4)#24 | 3.3%(+10.6)#1,134 |
| 25. | Brownlee Park | 13.9% | 3.5%(+10.4)#25 | 3.3%(+10.6)#1,142 |
| 26. | Bessemer | 13.6% | 3.5%(+10.1)#26 | 3.3%(+10.4)#1,181 |
| 27. | Eastlake | 13.5% | 3.5%(+9.99)#27 | 3.3%(+10.2)#1,219 |
| 28. | Ossineke | 13.2% | 3.5%(+9.64)#28 | 3.3%(+9.87)#1,293 |
| 29. | Prudenville | 13.1% | 3.5%(+9.64)#29 | 3.3%(+9.87)#1,294 |
| 30. | Mecosta | 13.0% | 3.5%(+9.45)#30 | 3.3%(+9.67)#1,332 |
| 31. | Pellston | 12.6% | 3.5%(+9.12)#31 | 3.3%(+9.34)#1,409 |
| 32. | White Cloud | 12.5% | 3.5%(+8.99)#32 | 3.3%(+9.22)#1,438 |
| 33. | Rose City | 12.5% | 3.5%(+8.99)#33 | 3.3%(+9.22)#1,440 |
| 34. | Buena Vista | 12.4% | 3.5%(+8.89)#34 | 3.3%(+9.12)#1,480 |
| 35. | Interlochen | 12.3% | 3.5%(+8.80)#35 | 3.3%(+9.03)#1,499 |
| 36. | Peck | 12.1% | 3.5%(+8.63)#36 | 3.3%(+8.86)#1,543 |
| 37. | Stanwood | 12.1% | 3.5%(+8.62)#37 | 3.3%(+8.84)#1,551 |
| 38. | Caro | 12.1% | 3.5%(+8.59)#38 | 3.3%(+8.81)#1,560 |
| 39. | Kingston | 11.8% | 3.5%(+8.30)#39 | 3.3%(+8.52)#1,632 |
| 40. | Ontonagon | 11.7% | 3.5%(+8.19)#40 | 3.3%(+8.41)#1,669 |
| 41. | Ashley | 11.7% | 3.5%(+8.18)#41 | 3.3%(+8.40)#1,671 |
| 42. | Ramsay | 11.4% | 3.5%(+7.86)#42 | 3.3%(+8.08)#1,776 |
| 43. | Highland Park | 11.1% | 3.5%(+7.64)#43 | 3.3%(+7.86)#1,845 |
| 44. | Maybee | 11.1% | 3.5%(+7.61)#44 | 3.3%(+7.83)#1,849 |
| 45. | Corunna | 10.8% | 3.5%(+7.27)#45 | 3.3%(+7.49)#1,981 |
| 46. | Alpha | 10.6% | 3.5%(+7.13)#46 | 3.3%(+7.36)#2,026 |
| 47. | Parchment | 10.6% | 3.5%(+7.10)#47 | 3.3%(+7.32)#2,035 |
| 48. | Grayling | 10.5% | 3.5%(+7.02)#48 | 3.3%(+7.25)#2,056 |
| 49. | Northport | 10.5% | 3.5%(+6.95)#49 | 3.3%(+7.18)#2,098 |
| 50. | Reading | 10.4% | 3.5%(+6.93)#50 | 3.3%(+7.15)#2,112 |
| 51. | Pierson | 10.2% | 3.5%(+6.70)#51 | 3.3%(+6.92)#2,222 |
| 52. | Sebewaing | 10.2% | 3.5%(+6.68)#52 | 3.3%(+6.91)#2,227 |
| 53. | Algonac | 10.2% | 3.5%(+6.67)#53 | 3.3%(+6.89)#2,232 |
| 54. | Springport | 10.2% | 3.5%(+6.66)#54 | 3.3%(+6.89)#2,233 |
| 55. | Trimountain | 10.0% | 3.5%(+6.49)#55 | 3.3%(+6.72)#2,312 |
| 56. | Lake Leelanau | 10.0% | 3.5%(+6.49)#56 | 3.3%(+6.72)#2,315 |
| 57. | Mesick | 9.8% | 3.5%(+6.27)#57 | 3.3%(+6.49)#2,436 |
| 58. | Munising | 9.7% | 3.5%(+6.16)#58 | 3.3%(+6.39)#2,484 |
| 59. | Vanderbilt | 9.6% | 3.5%(+6.12)#59 | 3.3%(+6.34)#2,506 |
| 60. | Coleman | 9.6% | 3.5%(+6.08)#60 | 3.3%(+6.30)#2,533 |
| 61. | Fountain | 9.5% | 3.5%(+5.95)#61 | 3.3%(+6.18)#2,588 |
| 62. | Lupton | 9.4% | 3.5%(+5.91)#62 | 3.3%(+6.13)#2,616 |
| 63. | Melvin | 9.2% | 3.5%(+5.70)#63 | 3.3%(+5.93)#2,710 |
| 64. | Standish | 9.1% | 3.5%(+5.57)#64 | 3.3%(+5.80)#2,803 |
| 65. | Hillman | 9.1% | 3.5%(+5.55)#65 | 3.3%(+5.78)#2,813 |
| 66. | K I Sawyer | 9.0% | 3.5%(+5.54)#66 | 3.3%(+5.76)#2,823 |
| 67. | Manistee | 9.0% | 3.5%(+5.52)#67 | 3.3%(+5.75)#2,838 |
| 68. | Alanson | 9.0% | 3.5%(+5.51)#68 | 3.3%(+5.74)#2,844 |
| 69. | Saginaw | 9.0% | 3.5%(+5.47)#69 | 3.3%(+5.69)#2,864 |
| 70. | Hermansville | 8.9% | 3.5%(+5.41)#70 | 3.3%(+5.63)#2,889 |
| 71. | Freeport | 8.8% | 3.5%(+5.34)#71 | 3.3%(+5.57)#2,926 |
| 72. | Breckenridge | 8.7% | 3.5%(+5.23)#72 | 3.3%(+5.45)#2,999 |
| 73. | Henderson | 8.7% | 3.5%(+5.19)#73 | 3.3%(+5.42)#3,022 |
| 74. | Inkster | 8.7% | 3.5%(+5.18)#74 | 3.3%(+5.40)#3,037 |
| 75. | Alba | 8.6% | 3.5%(+5.12)#75 | 3.3%(+5.35)#3,079 |
| 76. | Beecher | 8.4% | 3.5%(+4.94)#76 | 3.3%(+5.17)#3,208 |
| 77. | Dowagiac | 8.4% | 3.5%(+4.88)#77 | 3.3%(+5.11)#3,235 |
| 78. | St Charles | 8.3% | 3.5%(+4.84)#78 | 3.3%(+5.06)#3,255 |
| 79. | Augusta | 8.3% | 3.5%(+4.83)#79 | 3.3%(+5.05)#3,261 |
| 80. | North Adams | 8.3% | 3.5%(+4.83)#80 | 3.3%(+5.05)#3,265 |
| 81. | Turner | 8.3% | 3.5%(+4.83)#81 | 3.3%(+5.05)#3,290 |
| 82. | Lake City | 8.3% | 3.5%(+4.75)#82 | 3.3%(+4.97)#3,341 |
| 83. | River Rouge | 8.2% | 3.5%(+4.67)#83 | 3.3%(+4.89)#3,400 |
| 84. | Riverview | 8.2% | 3.5%(+4.66)#84 | 3.3%(+4.89)#3,401 |
| 85. | Galien | 8.1% | 3.5%(+4.57)#85 | 3.3%(+4.80)#3,483 |
| 86. | Skidway Lake | 8.0% | 3.5%(+4.50)#86 | 3.3%(+4.73)#3,530 |
| 87. | Marlette | 8.0% | 3.5%(+4.49)#87 | 3.3%(+4.72)#3,531 |
| 88. | Wellston | 8.0% | 3.5%(+4.49)#88 | 3.3%(+4.72)#3,535 |
| 89. | Capac | 8.0% | 3.5%(+4.46)#89 | 3.3%(+4.69)#3,560 |
| 90. | Columbiaville | 8.0% | 3.5%(+4.46)#90 | 3.3%(+4.68)#3,563 |
| 91. | Portland | 7.9% | 3.5%(+4.44)#91 | 3.3%(+4.67)#3,582 |
| 92. | South Monroe | 7.8% | 3.5%(+4.31)#92 | 3.3%(+4.53)#3,688 |
| 93. | Durand | 7.8% | 3.5%(+4.30)#93 | 3.3%(+4.53)#3,695 |
| 94. | Trowbridge Park | 7.8% | 3.5%(+4.30)#94 | 3.3%(+4.52)#3,704 |
| 95. | Daggett | 7.8% | 3.5%(+4.29)#95 | 3.3%(+4.51)#3,714 |
| 96. | Fairgrove | 7.8% | 3.5%(+4.27)#96 | 3.3%(+4.50)#3,726 |
| 97. | Perrinton | 7.8% | 3.5%(+4.27)#97 | 3.3%(+4.49)#3,731 |
| 98. | St Louis | 7.7% | 3.5%(+4.21)#98 | 3.3%(+4.44)#3,772 |
| 99. | Cass City | 7.6% | 3.5%(+4.14)#99 | 3.3%(+4.37)#3,845 |
| 100. | Manton | 7.6% | 3.5%(+4.13)#100 | 3.3%(+4.36)#3,859 |
Common Questions
What are the Top 10 Cities with the Highest Percentage of Population Employed in Healthcare Support in Michigan?
Top 10 Cities with the Highest Percentage of Population Employed in Healthcare Support in Michigan are:
What city has the Highest Percentage of Population Employed in Healthcare Support in Michigan?
Conway has the Highest Percentage of Population Employed in Healthcare Support in Michigan with 61.5%.
What is the Percentage of Population Employed in Healthcare Support in the State of Michigan?
Percentage of Population Employed in Healthcare Support in Michigan is 3.5%.
What is the Percentage of Population Employed in Healthcare Support in the United States?
Percentage of Population Employed in Healthcare Support in the United States is 3.3%.