Cities with the Highest Percentage of Population Employed in Healthcare Support in Ohio
RELATED REPORTS & OPTIONS
Healthcare Support
Ohio
Compare Cities
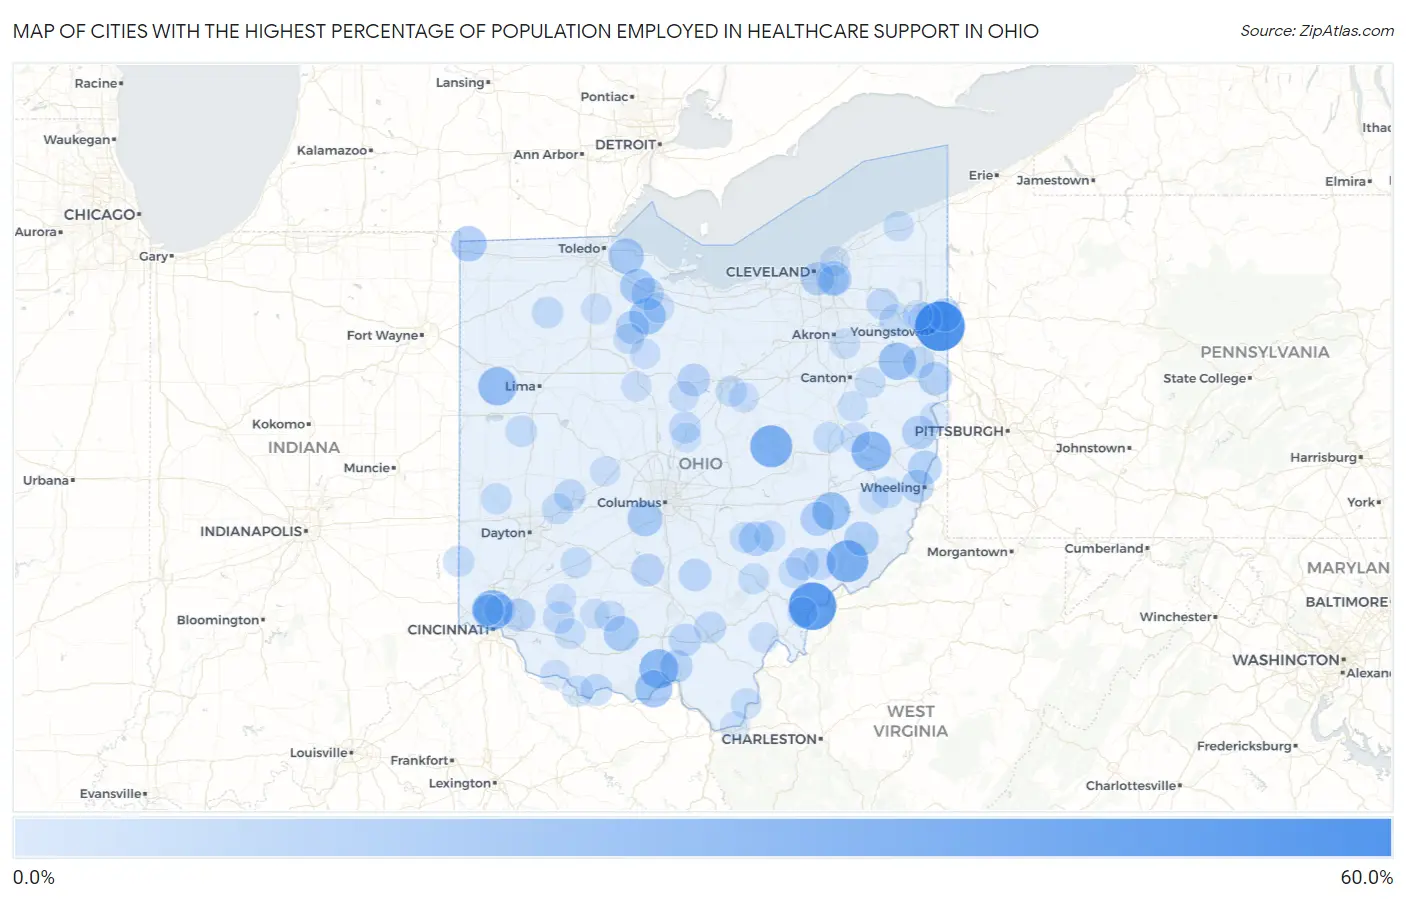
Map of Cities with the Highest Percentage of Population Employed in Healthcare Support in Ohio
0.0%
60.0%
Cities with the Highest Percentage of Population Employed in Healthcare Support in Ohio
| City | % Employed | vs State | vs National | |
| 1. | Maplewood Park | 52.3% | 3.4%(+49.0)#1 | 3.3%(+49.1)#75 |
| 2. | Little Hocking | 47.6% | 3.4%(+44.2)#2 | 3.3%(+44.3)#99 |
| 3. | Nellie | 35.1% | 3.4%(+31.7)#3 | 3.3%(+31.8)#179 |
| 4. | Lower Salem | 34.6% | 3.4%(+31.2)#4 | 3.3%(+31.3)#187 |
| 5. | Pleasant Hills | 30.4% | 3.4%(+27.1)#5 | 3.3%(+27.2)#249 |
| 6. | Deersville | 29.6% | 3.4%(+26.3)#6 | 3.3%(+26.3)#262 |
| 7. | Mcdermott | 28.5% | 3.4%(+25.1)#7 | 3.3%(+25.2)#282 |
| 8. | Elgin | 27.1% | 3.4%(+23.8)#8 | 3.3%(+23.9)#311 |
| 9. | East Alliance | 27.1% | 3.4%(+23.7)#9 | 3.3%(+23.8)#314 |
| 10. | Pleasant City | 25.7% | 3.4%(+22.4)#10 | 3.3%(+22.5)#337 |
| 11. | Madison Place | 25.4% | 3.4%(+22.0)#11 | 3.3%(+22.1)#342 |
| 12. | Damascus | 24.3% | 3.4%(+21.0)#12 | 3.3%(+21.0)#370 |
| 13. | Friendship | 24.1% | 3.4%(+20.7)#13 | 3.3%(+20.8)#376 |
| 14. | Fort Seneca | 22.5% | 3.4%(+19.1)#14 | 3.3%(+19.2)#428 |
| 15. | Williston | 20.7% | 3.4%(+17.3)#15 | 3.3%(+17.4)#511 |
| 16. | Nettle Lake | 20.2% | 3.4%(+16.9)#16 | 3.3%(+17.0)#530 |
| 17. | Darbydale | 19.9% | 3.4%(+16.5)#17 | 3.3%(+16.6)#556 |
| 18. | Sinking Spring | 19.7% | 3.4%(+16.3)#18 | 3.3%(+16.4)#566 |
| 19. | Highland Hills | 19.6% | 3.4%(+16.2)#19 | 3.3%(+16.3)#570 |
| 20. | Hessville | 19.5% | 3.4%(+16.1)#20 | 3.3%(+16.2)#576 |
| 21. | Stafford | 17.9% | 3.4%(+14.5)#21 | 3.3%(+14.6)#679 |
| 22. | New Lexington | 17.7% | 3.4%(+14.4)#22 | 3.3%(+14.4)#689 |
| 23. | Fort Mckinley | 17.6% | 3.4%(+14.2)#23 | 3.3%(+14.3)#697 |
| 24. | Cumberland | 17.5% | 3.4%(+14.2)#24 | 3.3%(+14.3)#704 |
| 25. | Connorville | 17.1% | 3.4%(+13.7)#25 | 3.3%(+13.8)#734 |
| 26. | Bascom | 16.4% | 3.4%(+13.0)#26 | 3.3%(+13.1)#780 |
| 27. | Rogers | 16.2% | 3.4%(+12.8)#27 | 3.3%(+12.9)#792 |
| 28. | Masury | 16.1% | 3.4%(+12.8)#28 | 3.3%(+12.8)#798 |
| 29. | Richmond | 15.9% | 3.4%(+12.5)#29 | 3.3%(+12.6)#835 |
| 30. | Newburgh Heights | 15.8% | 3.4%(+12.4)#30 | 3.3%(+12.5)#841 |
| 31. | Wolfhurst | 15.2% | 3.4%(+11.8)#31 | 3.3%(+11.9)#925 |
| 32. | Sullivan | 15.0% | 3.4%(+11.7)#32 | 3.3%(+11.8)#947 |
| 33. | Camp Dennison | 14.9% | 3.4%(+11.5)#33 | 3.3%(+11.6)#957 |
| 34. | Mckinley Heights | 14.8% | 3.4%(+11.5)#34 | 3.3%(+11.6)#970 |
| 35. | Stony Prairie | 14.6% | 3.4%(+11.2)#35 | 3.3%(+11.3)#1,006 |
| 36. | Clarktown | 14.6% | 3.4%(+11.2)#36 | 3.3%(+11.3)#1,007 |
| 37. | Clarksburg | 14.5% | 3.4%(+11.1)#37 | 3.3%(+11.2)#1,021 |
| 38. | Stockport | 14.5% | 3.4%(+11.1)#38 | 3.3%(+11.2)#1,029 |
| 39. | Crestline | 14.3% | 3.4%(+11.0)#39 | 3.3%(+11.0)#1,047 |
| 40. | Beaver | 14.2% | 3.4%(+10.8)#40 | 3.3%(+10.9)#1,084 |
| 41. | Bidwell | 14.2% | 3.4%(+10.8)#41 | 3.3%(+10.9)#1,090 |
| 42. | Laurelville | 14.1% | 3.4%(+10.7)#42 | 3.3%(+10.8)#1,110 |
| 43. | Skyline Acres | 13.2% | 3.4%(+9.81)#43 | 3.3%(+9.90)#1,285 |
| 44. | Bolton | 13.0% | 3.4%(+9.61)#44 | 3.3%(+9.70)#1,326 |
| 45. | Coalton | 12.8% | 3.4%(+9.45)#45 | 3.3%(+9.54)#1,358 |
| 46. | Beverly | 12.8% | 3.4%(+9.39)#46 | 3.3%(+9.47)#1,379 |
| 47. | Washingtonville | 12.7% | 3.4%(+9.35)#47 | 3.3%(+9.44)#1,389 |
| 48. | Fulton | 12.7% | 3.4%(+9.33)#48 | 3.3%(+9.42)#1,394 |
| 49. | Fayetteville | 12.6% | 3.4%(+9.22)#49 | 3.3%(+9.31)#1,419 |
| 50. | Lockland | 12.5% | 3.4%(+9.16)#50 | 3.3%(+9.25)#1,432 |
| 51. | Manchester | 12.5% | 3.4%(+9.12)#51 | 3.3%(+9.20)#1,467 |
| 52. | Tremont City | 12.4% | 3.4%(+9.05)#52 | 3.3%(+9.13)#1,475 |
| 53. | Garrettsville | 12.1% | 3.4%(+8.76)#53 | 3.3%(+8.85)#1,545 |
| 54. | Hamler | 12.1% | 3.4%(+8.69)#54 | 3.3%(+8.78)#1,569 |
| 55. | South Canal | 12.0% | 3.4%(+8.62)#55 | 3.3%(+8.71)#1,588 |
| 56. | Kettlersville | 11.8% | 3.4%(+8.40)#56 | 3.3%(+8.48)#1,647 |
| 57. | College Corner | 11.7% | 3.4%(+8.35)#57 | 3.3%(+8.44)#1,661 |
| 58. | Belmont | 11.6% | 3.4%(+8.28)#58 | 3.3%(+8.36)#1,681 |
| 59. | Rose Farm | 11.5% | 3.4%(+8.17)#59 | 3.3%(+8.26)#1,721 |
| 60. | Donnelsville | 11.4% | 3.4%(+8.08)#60 | 3.3%(+8.17)#1,752 |
| 61. | Pekin | 11.4% | 3.4%(+7.98)#61 | 3.3%(+8.07)#1,781 |
| 62. | Pitsburg | 11.2% | 3.4%(+7.81)#62 | 3.3%(+7.90)#1,835 |
| 63. | Blaine | 11.1% | 3.4%(+7.74)#63 | 3.3%(+7.83)#1,854 |
| 64. | Aberdeen | 11.0% | 3.4%(+7.63)#64 | 3.3%(+7.71)#1,906 |
| 65. | Port William | 10.9% | 3.4%(+7.52)#65 | 3.3%(+7.61)#1,936 |
| 66. | Lucas | 10.9% | 3.4%(+7.48)#66 | 3.3%(+7.57)#1,953 |
| 67. | Junction City | 10.8% | 3.4%(+7.47)#67 | 3.3%(+7.55)#1,958 |
| 68. | Crown City | 10.8% | 3.4%(+7.46)#68 | 3.3%(+7.55)#1,959 |
| 69. | Stone Creek | 10.8% | 3.4%(+7.44)#69 | 3.3%(+7.53)#1,968 |
| 70. | Nelsonville | 10.7% | 3.4%(+7.30)#70 | 3.3%(+7.39)#2,018 |
| 71. | Green Springs | 10.5% | 3.4%(+7.13)#71 | 3.3%(+7.22)#2,078 |
| 72. | Mount Healthy | 10.4% | 3.4%(+7.06)#72 | 3.3%(+7.15)#2,111 |
| 73. | Rocky Fork Point | 10.4% | 3.4%(+7.03)#73 | 3.3%(+7.12)#2,129 |
| 74. | Buford | 10.2% | 3.4%(+6.88)#74 | 3.3%(+6.96)#2,206 |
| 75. | Robertsville | 10.2% | 3.4%(+6.85)#75 | 3.3%(+6.94)#2,214 |
| 76. | Chesterhill | 10.1% | 3.4%(+6.77)#76 | 3.3%(+6.86)#2,250 |
| 77. | Coolville | 10.1% | 3.4%(+6.76)#77 | 3.3%(+6.85)#2,255 |
| 78. | New Riegel | 10.0% | 3.4%(+6.63)#78 | 3.3%(+6.72)#2,307 |
| 79. | Jerry City | 9.9% | 3.4%(+6.55)#79 | 3.3%(+6.64)#2,363 |
| 80. | Lakemore | 9.9% | 3.4%(+6.55)#80 | 3.3%(+6.64)#2,364 |
| 81. | Stratton | 9.9% | 3.4%(+6.49)#81 | 3.3%(+6.58)#2,398 |
| 82. | Sycamore | 9.8% | 3.4%(+6.43)#82 | 3.3%(+6.52)#2,419 |
| 83. | Iberia | 9.8% | 3.4%(+6.43)#83 | 3.3%(+6.52)#2,422 |
| 84. | Harpster | 9.8% | 3.4%(+6.39)#84 | 3.3%(+6.48)#2,444 |
| 85. | Dennison | 9.7% | 3.4%(+6.31)#85 | 3.3%(+6.40)#2,477 |
| 86. | Miller | 9.7% | 3.4%(+6.29)#86 | 3.3%(+6.38)#2,488 |
| 87. | Midland | 9.6% | 3.4%(+6.24)#87 | 3.3%(+6.32)#2,514 |
| 88. | Higginsport | 9.5% | 3.4%(+6.11)#88 | 3.3%(+6.20)#2,579 |
| 89. | Woodstock | 9.4% | 3.4%(+6.07)#89 | 3.3%(+6.15)#2,598 |
| 90. | Rutland | 9.4% | 3.4%(+6.04)#90 | 3.3%(+6.13)#2,612 |
| 91. | Geneva | 9.3% | 3.4%(+5.97)#91 | 3.3%(+6.06)#2,656 |
| 92. | Mineral City | 9.3% | 3.4%(+5.96)#92 | 3.3%(+6.04)#2,664 |
| 93. | Perrysville | 9.3% | 3.4%(+5.92)#93 | 3.3%(+6.01)#2,678 |
| 94. | Richmond Heights | 9.2% | 3.4%(+5.81)#94 | 3.3%(+5.90)#2,724 |
| 95. | Marengo | 9.1% | 3.4%(+5.72)#95 | 3.3%(+5.81)#2,772 |
| 96. | Warrensville Heights | 9.1% | 3.4%(+5.70)#96 | 3.3%(+5.79)#2,807 |
| 97. | Hillsboro | 9.1% | 3.4%(+5.69)#97 | 3.3%(+5.78)#2,811 |
| 98. | Bolindale | 9.0% | 3.4%(+5.61)#98 | 3.3%(+5.70)#2,860 |
| 99. | Proctorville | 8.9% | 3.4%(+5.58)#99 | 3.3%(+5.67)#2,875 |
| 100. | Barnesville | 8.9% | 3.4%(+5.49)#100 | 3.3%(+5.58)#2,922 |
Common Questions
What are the Top 10 Cities with the Highest Percentage of Population Employed in Healthcare Support in Ohio?
Top 10 Cities with the Highest Percentage of Population Employed in Healthcare Support in Ohio are:
#1
52.3%
#2
47.6%
#3
35.1%
#4
34.6%
#5
30.4%
#6
29.6%
#7
28.5%
#8
27.1%
#9
25.7%
#10
24.3%
What city has the Highest Percentage of Population Employed in Healthcare Support in Ohio?
Maplewood Park has the Highest Percentage of Population Employed in Healthcare Support in Ohio with 52.3%.
What is the Percentage of Population Employed in Healthcare Support in the State of Ohio?
Percentage of Population Employed in Healthcare Support in Ohio is 3.4%.
What is the Percentage of Population Employed in Healthcare Support in the United States?
Percentage of Population Employed in Healthcare Support in the United States is 3.3%.