Cities with the Highest Percentage of Population Employed in Healthcare Support in Connecticut
RELATED REPORTS & OPTIONS
Healthcare Support
Connecticut
Compare Cities
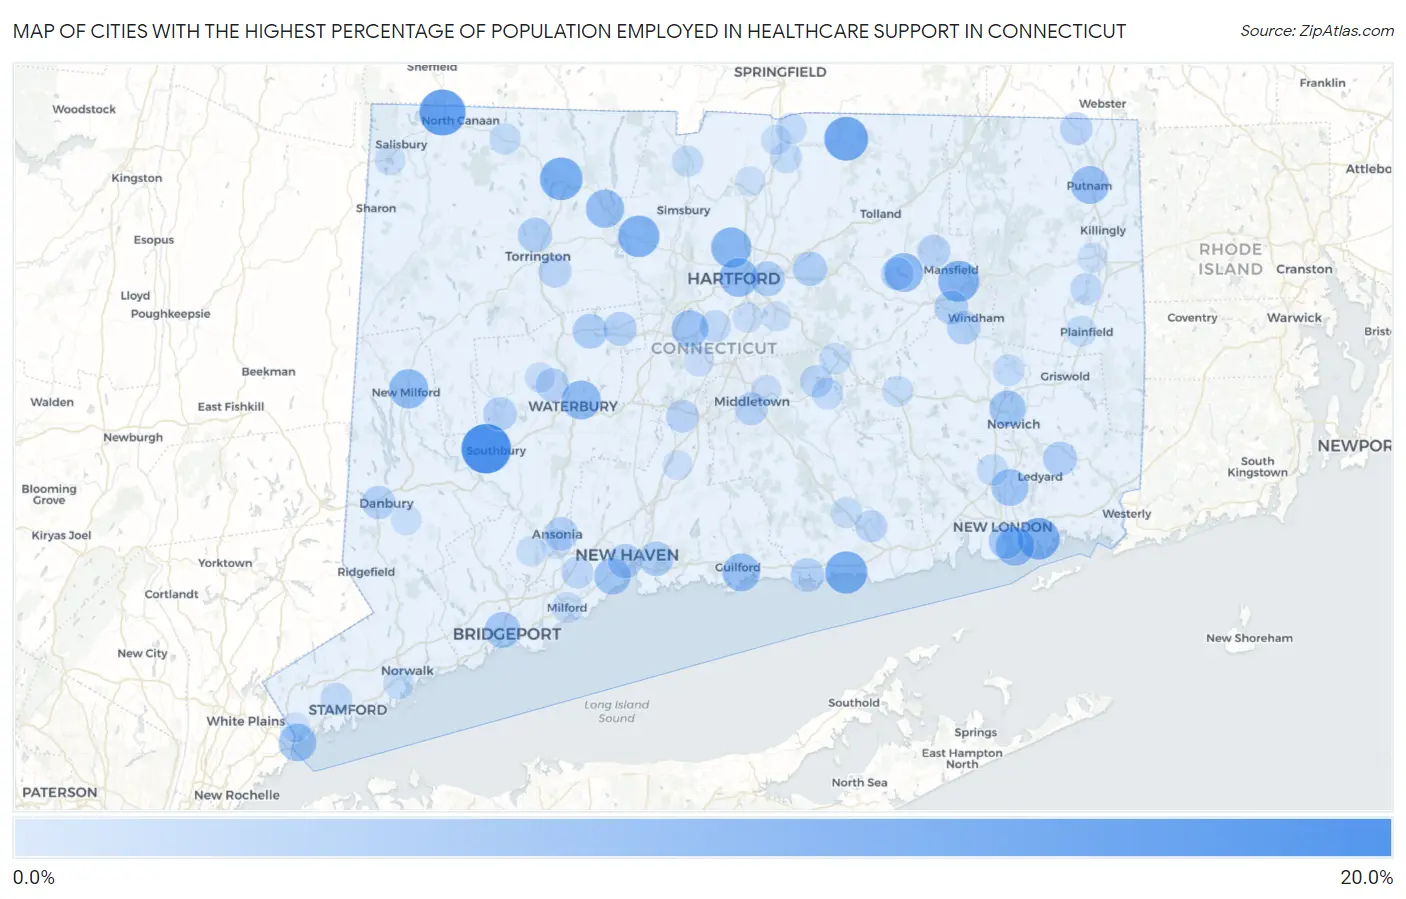
Map of Cities with the Highest Percentage of Population Employed in Healthcare Support in Connecticut
0.0%
20.0%
Cities with the Highest Percentage of Population Employed in Healthcare Support in Connecticut
| City | % Employed | vs State | vs National | |
| 1. | Heritage Village | 16.2% | 3.5%(+12.7)#1 | 3.3%(+12.9)#794 |
| 2. | Canaan | 13.6% | 3.5%(+10.1)#2 | 3.3%(+10.3)#1,203 |
| 3. | Somers | 11.9% | 3.5%(+8.43)#3 | 3.3%(+8.60)#1,615 |
| 4. | Taylor Corners | 11.6% | 3.5%(+8.18)#4 | 3.3%(+8.36)#1,683 |
| 5. | Brookfield Center | 11.1% | 3.5%(+7.65)#5 | 3.3%(+7.83)#1,865 |
| 6. | Winsted | 11.0% | 3.5%(+7.51)#6 | 3.3%(+7.69)#1,913 |
| 7. | Westbrook Center | 10.7% | 3.5%(+7.22)#7 | 3.3%(+7.40)#2,016 |
| 8. | Poquonock Bridge | 10.4% | 3.5%(+6.91)#8 | 3.3%(+7.09)#2,141 |
| 9. | Canton Valley | 10.1% | 3.5%(+6.63)#9 | 3.3%(+6.81)#2,276 |
| 10. | Mansfield Center | 9.8% | 3.5%(+6.30)#10 | 3.3%(+6.48)#2,442 |
| 11. | Blue Hills | 9.2% | 3.5%(+5.72)#11 | 3.3%(+5.89)#2,726 |
| 12. | Pleasant Valley | 8.8% | 3.5%(+5.34)#12 | 3.3%(+5.52)#2,949 |
| 13. | New Milford | 8.4% | 3.5%(+4.96)#13 | 3.3%(+5.14)#3,225 |
| 14. | Waterbury | 8.3% | 3.5%(+4.89)#14 | 3.3%(+5.07)#3,252 |
| 15. | South Coventry | 8.2% | 3.5%(+4.76)#15 | 3.3%(+4.94)#3,364 |
| 16. | Groton | 8.1% | 3.5%(+4.62)#16 | 3.3%(+4.80)#3,484 |
| 17. | Hartford | 8.0% | 3.5%(+4.57)#17 | 3.3%(+4.75)#3,517 |
| 18. | New Hartford Center | 7.7% | 3.5%(+4.27)#18 | 3.3%(+4.45)#3,760 |
| 19. | Bantam Borough | 7.5% | 3.5%(+4.06)#19 | 3.3%(+4.23)#3,964 |
| 20. | Putnam | 7.5% | 3.5%(+4.03)#20 | 3.3%(+4.21)#3,987 |
| 21. | Guilford Center | 7.4% | 3.5%(+3.90)#21 | 3.3%(+4.08)#4,128 |
| 22. | Byram | 7.2% | 3.5%(+3.77)#22 | 3.3%(+3.95)#4,238 |
| 23. | Cornwall Bridge | 7.1% | 3.5%(+3.68)#23 | 3.3%(+3.86)#4,337 |
| 24. | New Britain | 6.8% | 3.5%(+3.33)#24 | 3.3%(+3.51)#4,721 |
| 25. | Gales Ferry | 6.8% | 3.5%(+3.32)#25 | 3.3%(+3.50)#4,736 |
| 26. | Ball Pond | 6.6% | 3.5%(+3.12)#26 | 3.3%(+3.29)#4,985 |
| 27. | West Haven | 6.5% | 3.5%(+3.06)#27 | 3.3%(+3.24)#5,044 |
| 28. | Norwich | 6.4% | 3.5%(+2.99)#28 | 3.3%(+3.17)#5,156 |
| 29. | Bridgeport | 6.0% | 3.5%(+2.54)#29 | 3.3%(+2.72)#5,803 |
| 30. | New London | 5.5% | 3.5%(+2.07)#30 | 3.3%(+2.24)#6,585 |
| 31. | Danielson Borough | 5.4% | 3.5%(+1.98)#31 | 3.3%(+2.16)#6,704 |
| 32. | Stepney | 5.4% | 3.5%(+1.91)#32 | 3.3%(+2.09)#6,846 |
| 33. | Terryville | 5.2% | 3.5%(+1.77)#33 | 3.3%(+1.95)#7,117 |
| 34. | Lake Chaffee | 5.2% | 3.5%(+1.77)#34 | 3.3%(+1.94)#7,129 |
| 35. | East Hartford | 5.2% | 3.5%(+1.70)#35 | 3.3%(+1.88)#7,240 |
| 36. | East Haven | 5.0% | 3.5%(+1.59)#36 | 3.3%(+1.77)#7,498 |
| 37. | Torrington | 5.0% | 3.5%(+1.58)#37 | 3.3%(+1.76)#7,521 |
| 38. | Stratford Downtown | 5.0% | 3.5%(+1.49)#38 | 3.3%(+1.67)#7,711 |
| 39. | New Haven | 4.9% | 3.5%(+1.46)#39 | 3.3%(+1.64)#7,801 |
| 40. | Manchester | 4.9% | 3.5%(+1.45)#40 | 3.3%(+1.63)#7,812 |
| 41. | Mashantucket | 4.8% | 3.5%(+1.30)#41 | 3.3%(+1.48)#8,142 |
| 42. | Bristol | 4.5% | 3.5%(+1.04)#42 | 3.3%(+1.22)#8,763 |
| 43. | Willimantic | 4.5% | 3.5%(+1.03)#43 | 3.3%(+1.21)#8,781 |
| 44. | South Windham | 4.5% | 3.5%(+1.02)#44 | 3.3%(+1.20)#8,801 |
| 45. | Clinton | 4.5% | 3.5%(+1.02)#45 | 3.3%(+1.20)#8,803 |
| 46. | Indian Field | 4.4% | 3.5%(+0.975)#46 | 3.3%(+1.15)#8,936 |
| 47. | Danbury | 4.2% | 3.5%(+0.787)#47 | 3.3%(+0.965)#9,420 |
| 48. | Woodbury Center | 4.2% | 3.5%(+0.784)#48 | 3.3%(+0.963)#9,424 |
| 49. | Ansonia | 4.2% | 3.5%(+0.770)#49 | 3.3%(+0.949)#9,458 |
| 50. | Oakville | 4.2% | 3.5%(+0.730)#50 | 3.3%(+0.908)#9,569 |
| 51. | Storrs | 4.0% | 3.5%(+0.519)#51 | 3.3%(+0.697)#10,175 |
| 52. | Jewett City Borough | 4.0% | 3.5%(+0.500)#52 | 3.3%(+0.678)#10,222 |
| 53. | Middletown | 3.9% | 3.5%(+0.472)#53 | 3.3%(+0.651)#10,284 |
| 54. | Northwest Harwinton | 3.9% | 3.5%(+0.409)#54 | 3.3%(+0.588)#10,455 |
| 55. | Coventry Lake | 3.8% | 3.5%(+0.328)#55 | 3.3%(+0.507)#10,693 |
| 56. | Meriden | 3.8% | 3.5%(+0.324)#56 | 3.3%(+0.503)#10,703 |
| 57. | Quinebaug | 3.8% | 3.5%(+0.307)#57 | 3.3%(+0.486)#10,748 |
| 58. | Lake Pocotopaug | 3.6% | 3.5%(+0.191)#58 | 3.3%(+0.370)#11,070 |
| 59. | Lakes East | 3.6% | 3.5%(+0.109)#59 | 3.3%(+0.287)#11,326 |
| 60. | Bigelow Corners | 3.6% | 3.5%(+0.102)#60 | 3.3%(+0.280)#11,346 |
| 61. | Lakeside Woods | 3.5% | 3.5%(+0.057)#61 | 3.3%(+0.236)#11,489 |
| 62. | Essex Village | 3.3% | 3.5%(-0.149)#62 | 3.3%(+0.029)#12,163 |
| 63. | Orange | 3.2% | 3.5%(-0.233)#63 | 3.3%(-0.055)#12,474 |
| 64. | Newington | 3.2% | 3.5%(-0.259)#64 | 3.3%(-0.080)#12,570 |
| 65. | Ridgebury | 3.1% | 3.5%(-0.362)#65 | 3.3%(-0.184)#12,948 |
| 66. | Stamford | 3.0% | 3.5%(-0.428)#66 | 3.3%(-0.249)#13,167 |
| 67. | Wauregan | 3.0% | 3.5%(-0.428)#67 | 3.3%(-0.249)#13,171 |
| 68. | Lordship | 3.0% | 3.5%(-0.448)#68 | 3.3%(-0.270)#13,259 |
| 69. | Terramuggus | 3.0% | 3.5%(-0.497)#69 | 3.3%(-0.319)#13,453 |
| 70. | Baltic | 3.0% | 3.5%(-0.498)#70 | 3.3%(-0.319)#13,456 |
| 71. | Oxoboxo River | 2.9% | 3.5%(-0.549)#71 | 3.3%(-0.371)#13,658 |
| 72. | East Hampton | 2.9% | 3.5%(-0.582)#72 | 3.3%(-0.403)#13,795 |
| 73. | Norfolk | 2.8% | 3.5%(-0.609)#73 | 3.3%(-0.431)#13,912 |
| 74. | Southwood Acres | 2.8% | 3.5%(-0.672)#74 | 3.3%(-0.494)#14,155 |
| 75. | Salmon Brook | 2.8% | 3.5%(-0.708)#75 | 3.3%(-0.529)#14,297 |
| 76. | Norwalk | 2.7% | 3.5%(-0.788)#76 | 3.3%(-0.610)#14,562 |
| 77. | Deep River Center | 2.6% | 3.5%(-0.815)#77 | 3.3%(-0.637)#14,671 |
| 78. | Colchester | 2.6% | 3.5%(-0.822)#78 | 3.3%(-0.643)#14,701 |
| 79. | Plainfield Village | 2.6% | 3.5%(-0.836)#79 | 3.3%(-0.658)#14,762 |
| 80. | Naugatuck Borough | 2.6% | 3.5%(-0.860)#80 | 3.3%(-0.681)#14,841 |
| 81. | Milford City Balance | 2.6% | 3.5%(-0.905)#81 | 3.3%(-0.726)#15,037 |
| 82. | Sherwood Manor | 2.5% | 3.5%(-0.961)#82 | 3.3%(-0.782)#15,249 |
| 83. | Compo | 2.5% | 3.5%(-0.992)#83 | 3.3%(-0.813)#15,352 |
| 84. | Northford | 2.4% | 3.5%(-1.04)#84 | 3.3%(-0.857)#15,515 |
| 85. | Lakeville | 2.4% | 3.5%(-1.07)#85 | 3.3%(-0.889)#15,636 |
| 86. | Watertown | 2.2% | 3.5%(-1.26)#86 | 3.3%(-1.08)#16,368 |
| 87. | Derby | 2.1% | 3.5%(-1.32)#87 | 3.3%(-1.14)#16,611 |
| 88. | Kensington | 2.1% | 3.5%(-1.32)#88 | 3.3%(-1.15)#16,615 |
| 89. | Portland | 2.1% | 3.5%(-1.33)#89 | 3.3%(-1.16)#16,668 |
| 90. | Wethersfield | 2.1% | 3.5%(-1.34)#90 | 3.3%(-1.16)#16,691 |
| 91. | Bethel | 2.1% | 3.5%(-1.37)#91 | 3.3%(-1.19)#16,791 |
| 92. | Thompsonville | 2.1% | 3.5%(-1.39)#92 | 3.3%(-1.21)#16,846 |
| 93. | Shelton | 2.1% | 3.5%(-1.41)#93 | 3.3%(-1.23)#16,928 |
| 94. | Oronoque | 2.0% | 3.5%(-1.44)#94 | 3.3%(-1.26)#17,040 |
| 95. | Windsor Locks | 2.0% | 3.5%(-1.46)#95 | 3.3%(-1.28)#17,134 |
| 96. | South Wilton | 2.0% | 3.5%(-1.47)#96 | 3.3%(-1.30)#17,195 |
| 97. | Glastonbury Center | 2.0% | 3.5%(-1.50)#97 | 3.3%(-1.32)#17,270 |
| 98. | Pemberwick | 1.9% | 3.5%(-1.52)#98 | 3.3%(-1.34)#17,379 |
| 99. | Wallingford Center | 1.9% | 3.5%(-1.53)#99 | 3.3%(-1.36)#17,419 |
| 100. | East Brooklyn | 1.9% | 3.5%(-1.56)#100 | 3.3%(-1.38)#17,545 |
Common Questions
What are the Top 10 Cities with the Highest Percentage of Population Employed in Healthcare Support in Connecticut?
Top 10 Cities with the Highest Percentage of Population Employed in Healthcare Support in Connecticut are:
#1
16.2%
#2
13.6%
#3
11.9%
#4
11.0%
#5
10.7%
#6
10.4%
#7
10.1%
#8
9.8%
#9
9.2%
#10
8.4%
What city has the Highest Percentage of Population Employed in Healthcare Support in Connecticut?
Heritage Village has the Highest Percentage of Population Employed in Healthcare Support in Connecticut with 16.2%.
What is the Percentage of Population Employed in Healthcare Support in the State of Connecticut?
Percentage of Population Employed in Healthcare Support in Connecticut is 3.5%.
What is the Percentage of Population Employed in Healthcare Support in the United States?
Percentage of Population Employed in Healthcare Support in the United States is 3.3%.