Cities with the Largest Filipino Community in the United States
RELATED REPORTS & OPTIONS
Filipino
United States
Compare Cities
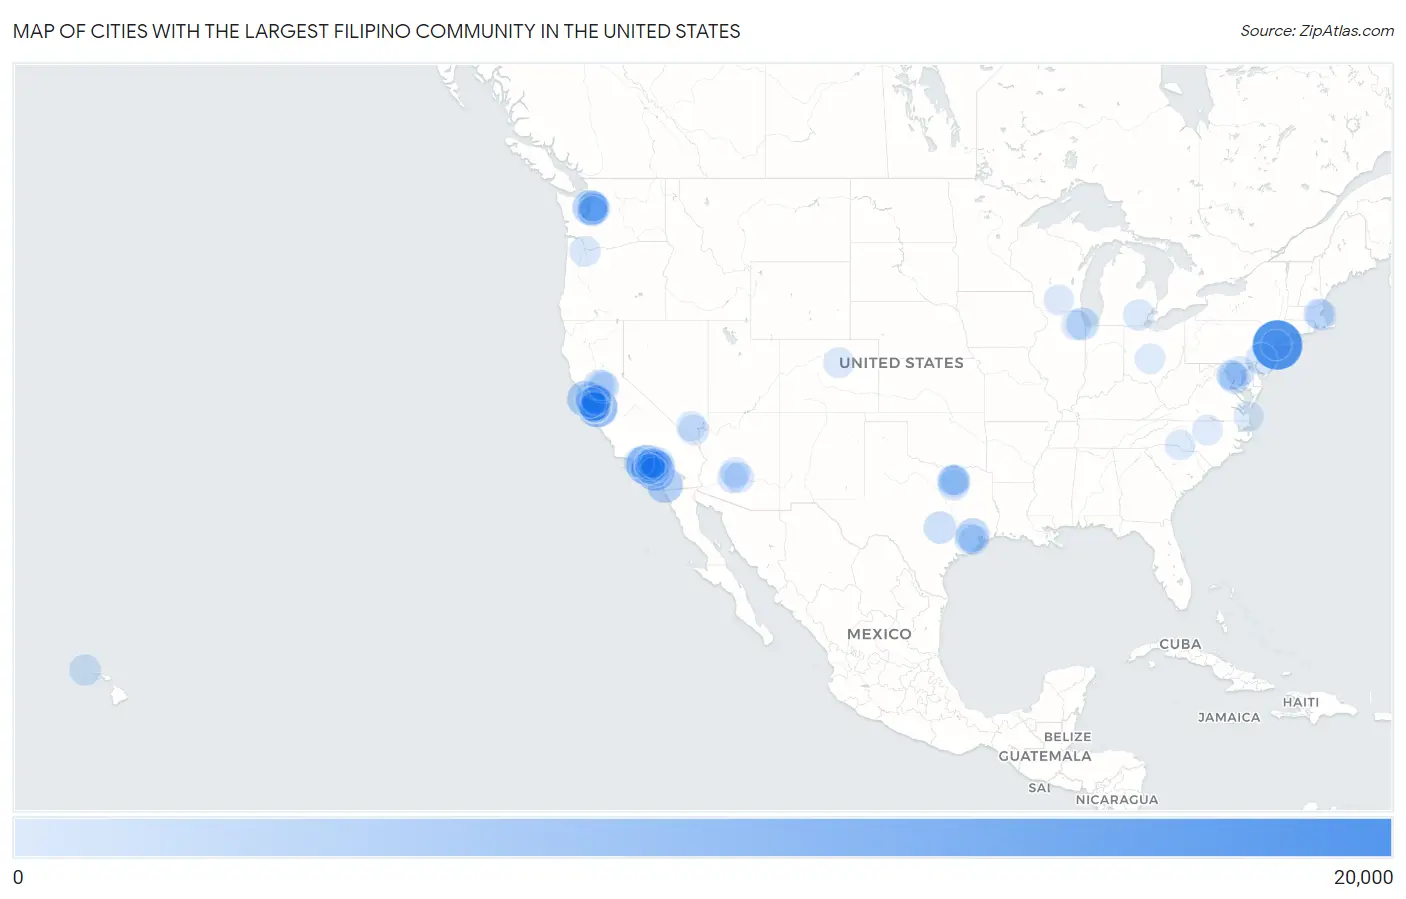
Map of Cities with the Largest Filipino Community in the United States
0
20,000
Cities with the Largest Filipino Community in the United States
| City | Filipino | vs State | vs National | |
| 1. | New York | 15,834 | 21,825(72.55%)#1 | 280,778(5.64%)#1 |
| 2. | Los Angeles | 7,926 | 120,868(6.56%)#1 | 280,778(2.82%)#2 |
| 3. | San Jose | 7,790 | 120,868(6.45%)#2 | 280,778(2.77%)#3 |
| 4. | Irvine | 7,096 | 120,868(5.87%)#3 | 280,778(2.53%)#4 |
| 5. | San Francisco | 4,722 | 120,868(3.91%)#4 | 280,778(1.68%)#5 |
| 6. | San Diego | 4,660 | 120,868(3.86%)#5 | 280,778(1.66%)#6 |
| 7. | Seattle | 4,074 | 14,505(28.09%)#1 | 280,778(1.45%)#7 |
| 8. | Fremont | 4,063 | 120,868(3.36%)#6 | 280,778(1.45%)#8 |
| 9. | Houston | 3,032 | 21,789(13.92%)#1 | 280,778(1.08%)#9 |
| 10. | Arcadia | 3,007 | 120,868(2.49%)#7 | 280,778(1.07%)#10 |
| 11. | Chicago | 2,312 | 7,530(30.70%)#1 | 280,778(0.82%)#11 |
| 12. | Rowland Heights | 2,168 | 120,868(1.79%)#8 | 280,778(0.77%)#12 |
| 13. | Austin | 2,077 | 21,789(9.53%)#2 | 280,778(0.74%)#13 |
| 14. | Diamond Bar | 2,007 | 120,868(1.66%)#9 | 280,778(0.71%)#14 |
| 15. | Bellevue | 1,966 | 14,505(13.55%)#2 | 280,778(0.70%)#15 |
| 16. | Chino Hills | 1,927 | 120,868(1.59%)#10 | 280,778(0.69%)#16 |
| 17. | Sunnyvale | 1,848 | 120,868(1.53%)#11 | 280,778(0.66%)#17 |
| 18. | Cupertino | 1,681 | 120,868(1.39%)#12 | 280,778(0.60%)#18 |
| 19. | Mountain View | 1,588 | 120,868(1.31%)#13 | 280,778(0.57%)#19 |
| 20. | Cerritos | 1,497 | 120,868(1.24%)#14 | 280,778(0.53%)#20 |
| 21. | Hacienda Heights | 1,444 | 120,868(1.19%)#15 | 280,778(0.51%)#21 |
| 22. | Santa Clara | 1,401 | 120,868(1.16%)#16 | 280,778(0.50%)#22 |
| 23. | Plano | 1,350 | 21,789(6.20%)#3 | 280,778(0.48%)#23 |
| 24. | Oakland | 1,307 | 120,868(1.08%)#17 | 280,778(0.47%)#24 |
| 25. | Urban Honolulu | 1,275 | 2,167(58.84%)#1 | 280,778(0.45%)#25 |
| 26. | Walnut | 1,231 | 120,868(1.02%)#18 | 280,778(0.44%)#26 |
| 27. | Philadelphia | 1,222 | 4,785(25.54%)#1 | 280,778(0.44%)#27 |
| 28. | Alhambra | 1,204 | 120,868(1.00%)#19 | 280,778(0.43%)#28 |
| 29. | Sugar Land | 1,051 | 21,789(4.82%)#4 | 280,778(0.37%)#29 |
| 30. | Pasadena | 1,022 | 120,868(0.85%)#20 | 280,778(0.36%)#30 |
| 31. | Dallas | 1,011 | 21,789(4.64%)#5 | 280,778(0.36%)#31 |
| 32. | Torrance | 1,003 | 120,868(0.83%)#21 | 280,778(0.36%)#32 |
| 33. | Palo Alto | 996 | 120,868(0.82%)#22 | 280,778(0.35%)#33 |
| 34. | Berkeley | 981 | 120,868(0.81%)#23 | 280,778(0.35%)#34 |
| 35. | Saratoga | 967 | 120,868(0.80%)#24 | 280,778(0.34%)#35 |
| 36. | Portland | 947 | 2,881(32.87%)#1 | 280,778(0.34%)#36 |
| 37. | Ann Arbor | 928 | 3,863(24.02%)#1 | 280,778(0.33%)#37 |
| 38. | Temple City | 917 | 120,868(0.76%)#25 | 280,778(0.33%)#38 |
| 39. | Fullerton | 888 | 120,868(0.73%)#26 | 280,778(0.32%)#39 |
| 40. | San Marino | 883 | 120,868(0.73%)#27 | 280,778(0.31%)#40 |
| 41. | West Covina | 880 | 120,868(0.73%)#28 | 280,778(0.31%)#41 |
| 42. | Yorba Linda | 878 | 120,868(0.73%)#29 | 280,778(0.31%)#42 |
| 43. | Rancho Cucamonga | 855 | 120,868(0.71%)#30 | 280,778(0.30%)#43 |
| 44. | Rancho Palos Verdes | 833 | 120,868(0.69%)#31 | 280,778(0.30%)#44 |
| 45. | Washington | 831 | 831(100.00%)#1 | 280,778(0.30%)#45 |
| 46. | San Mateo | 826 | 120,868(0.68%)#32 | 280,778(0.29%)#46 |
| 47. | Boston | 816 | 7,625(10.70%)#1 | 280,778(0.29%)#47 |
| 48. | Redmond | 802 | 14,505(5.53%)#3 | 280,778(0.29%)#48 |
| 49. | East San Gabriel | 801 | 120,868(0.66%)#33 | 280,778(0.29%)#49 |
| 50. | Lake Forest | 797 | 120,868(0.66%)#34 | 280,778(0.28%)#50 |
| 51. | Eastvale | 758 | 120,868(0.63%)#35 | 280,778(0.27%)#51 |
| 52. | Cambridge | 724 | 7,625(9.50%)#2 | 280,778(0.26%)#52 |
| 53. | Tustin | 719 | 120,868(0.59%)#36 | 280,778(0.26%)#53 |
| 54. | Cypress | 706 | 120,868(0.58%)#37 | 280,778(0.25%)#54 |
| 55. | Anaheim | 703 | 120,868(0.58%)#38 | 280,778(0.25%)#55 |
| 56. | Pleasanton | 694 | 120,868(0.57%)#39 | 280,778(0.25%)#56 |
| 57. | San Ramon | 693 | 120,868(0.57%)#40 | 280,778(0.25%)#57 |
| 58. | Frisco | 682 | 21,789(3.13%)#6 | 280,778(0.24%)#58 |
| 59. | Jersey City | 666 | 10,251(6.50%)#1 | 280,778(0.24%)#59 |
| 60. | Santa Monica | 653 | 120,868(0.54%)#41 | 280,778(0.23%)#60 |
| 61. | San Gabriel | 653 | 120,868(0.54%)#42 | 280,778(0.23%)#61 |
| 62. | Chandler | 648 | 3,851(16.83%)#1 | 280,778(0.23%)#62 |
| 63. | Henderson | 646 | 2,512(25.72%)#1 | 280,778(0.23%)#63 |
| 64. | Milpitas | 642 | 120,868(0.53%)#43 | 280,778(0.23%)#64 |
| 65. | Brea | 634 | 120,868(0.52%)#44 | 280,778(0.23%)#65 |
| 66. | Goodyear | 633 | 3,851(16.44%)#2 | 280,778(0.23%)#66 |
| 67. | Denver | 605 | 2,880(21.01%)#1 | 280,778(0.22%)#67 |
| 68. | Riverside | 596 | 120,868(0.49%)#45 | 280,778(0.21%)#68 |
| 69. | Davis | 582 | 120,868(0.48%)#46 | 280,778(0.21%)#69 |
| 70. | Huntington Beach | 581 | 120,868(0.48%)#47 | 280,778(0.21%)#70 |
| 71. | Sammamish | 578 | 14,505(3.98%)#4 | 280,778(0.21%)#71 |
| 72. | San Dimas | 575 | 120,868(0.48%)#48 | 280,778(0.20%)#72 |
| 73. | Phoenix | 563 | 3,851(14.62%)#3 | 280,778(0.20%)#73 |
| 74. | Kirkland | 563 | 14,505(3.88%)#5 | 280,778(0.20%)#74 |
| 75. | Chino | 563 | 120,868(0.47%)#49 | 280,778(0.20%)#75 |
| 76. | Redondo Beach | 562 | 120,868(0.46%)#50 | 280,778(0.20%)#76 |
| 77. | Las Vegas | 544 | 2,512(21.66%)#2 | 280,778(0.19%)#77 |
| 78. | Renton | 543 | 14,505(3.74%)#6 | 280,778(0.19%)#78 |
| 79. | Madison | 538 | 1,626(33.09%)#1 | 280,778(0.19%)#79 |
| 80. | Pearland | 536 | 21,789(2.46%)#7 | 280,778(0.19%)#80 |
| 81. | Elk Grove | 535 | 120,868(0.44%)#51 | 280,778(0.19%)#81 |
| 82. | Naperville | 531 | 7,530(7.05%)#2 | 280,778(0.19%)#82 |
| 83. | Thousand Oaks | 529 | 120,868(0.44%)#52 | 280,778(0.19%)#83 |
| 84. | Newport Beach | 529 | 120,868(0.44%)#53 | 280,778(0.19%)#84 |
| 85. | Potomac | 525 | 6,209(8.46%)#1 | 280,778(0.19%)#85 |
| 86. | Monterey Park | 522 | 120,868(0.43%)#54 | 280,778(0.19%)#86 |
| 87. | Monrovia | 514 | 120,868(0.43%)#55 | 280,778(0.18%)#87 |
| 88. | Sacramento | 511 | 120,868(0.42%)#56 | 280,778(0.18%)#88 |
| 89. | Charlotte | 500 | 3,345(14.95%)#1 | 280,778(0.18%)#89 |
| 90. | Durham | 496 | 3,345(14.83%)#2 | 280,778(0.18%)#90 |
| 91. | Long Beach | 495 | 120,868(0.41%)#57 | 280,778(0.18%)#91 |
| 92. | Columbus | 478 | 3,543(13.49%)#1 | 280,778(0.17%)#92 |
| 93. | Allen | 475 | 21,789(2.18%)#8 | 280,778(0.17%)#93 |
| 94. | Baltimore | 473 | 6,209(7.62%)#2 | 280,778(0.17%)#94 |
| 95. | Virginia Beach | 472 | 5,966(7.91%)#1 | 280,778(0.17%)#95 |
| 96. | North Potomac | 465 | 6,209(7.49%)#3 | 280,778(0.17%)#96 |
| 97. | Los Altos | 453 | 120,868(0.37%)#58 | 280,778(0.16%)#97 |
| 98. | Campbell | 452 | 120,868(0.37%)#59 | 280,778(0.16%)#98 |
| 99. | Dublin | 447 | 120,868(0.37%)#60 | 280,778(0.16%)#99 |
| 100. | Foster City | 445 | 120,868(0.37%)#61 | 280,778(0.16%)#100 |
Common Questions
What are the Top 10 Cities with the Largest Filipino Community in the United States?
Top 10 Cities with the Largest Filipino Community in the United States are:
What city has the Largest Filipino Community in the United States?
New York has the Largest Filipino Community in the United States with 15,834.
What is the Total Filipino Population in the United States?
Total Filipino Population in the United States is 280,778.