Cities with the Largest Filipino Community in Pennsylvania
RELATED REPORTS & OPTIONS
Filipino
Pennsylvania
Compare Cities
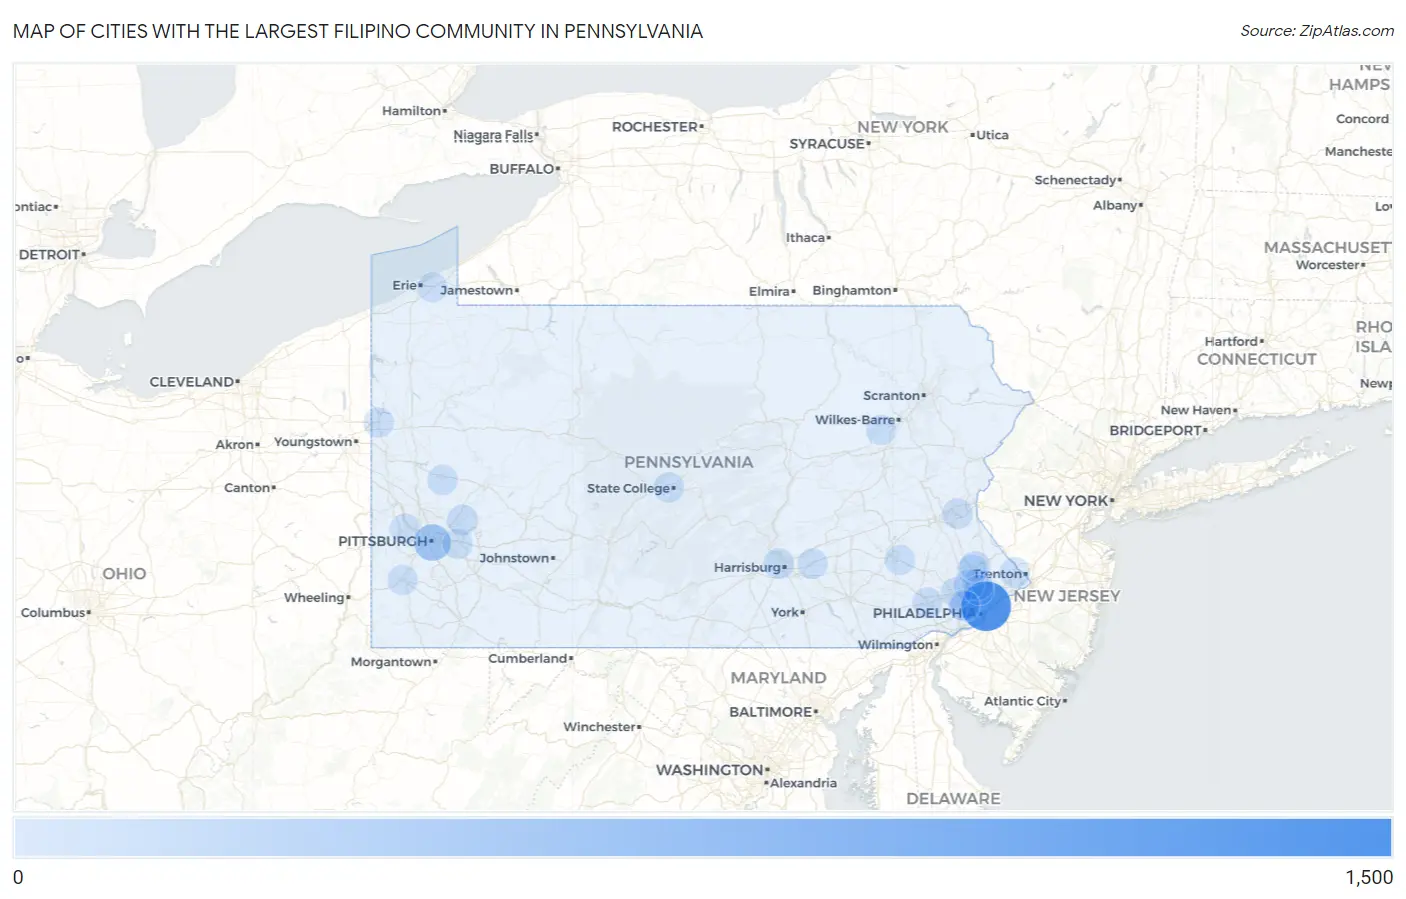
Map of Cities with the Largest Filipino Community in Pennsylvania
0
1,500
Cities with the Largest Filipino Community in Pennsylvania
| City | Filipino | vs State | vs National | |
| 1. | Philadelphia | 1,222 | 4,785(25.54%)#1 | 280,778(0.44%)#27 |
| 2. | Pittsburgh | 392 | 4,785(8.19%)#2 | 280,778(0.14%)#111 |
| 3. | Morgan Hill | 138 | 4,785(2.88%)#3 | 280,778(0.05%)#340 |
| 4. | West Chester Borough | 91 | 4,785(1.90%)#4 | 280,778(0.03%)#474 |
| 5. | Narberth Borough | 61 | 4,785(1.27%)#5 | 280,778(0.02%)#645 |
| 6. | Elkins Park | 57 | 4,785(1.19%)#6 | 280,778(0.02%)#673 |
| 7. | Media Borough | 50 | 4,785(1.04%)#7 | 280,778(0.02%)#746 |
| 8. | Fort Washington | 42 | 4,785(0.88%)#8 | 280,778(0.01%)#843 |
| 9. | Mckinley | 41 | 4,785(0.86%)#9 | 280,778(0.01%)#864 |
| 10. | King Of Prussia | 37 | 4,785(0.77%)#10 | 280,778(0.01%)#910 |
| 11. | Brookhaven Borough | 35 | 4,785(0.73%)#11 | 280,778(0.01%)#941 |
| 12. | Lower Burrell | 34 | 4,785(0.71%)#12 | 280,778(0.01%)#957 |
| 13. | Montgomeryville | 33 | 4,785(0.69%)#13 | 280,778(0.01%)#972 |
| 14. | Enola | 33 | 4,785(0.69%)#14 | 280,778(0.01%)#975 |
| 15. | Blue Bell | 31 | 4,785(0.65%)#15 | 280,778(0.01%)#1,005 |
| 16. | Haverford College | 31 | 4,785(0.65%)#16 | 280,778(0.01%)#1,011 |
| 17. | Dilworthtown | 31 | 4,785(0.65%)#17 | 280,778(0.01%)#1,013 |
| 18. | Chestnut Hill | 30 | 4,785(0.63%)#18 | 280,778(0.01%)#1,027 |
| 19. | Carlisle Borough | 29 | 4,785(0.61%)#19 | 280,778(0.01%)#1,047 |
| 20. | Bethlehem | 28 | 4,785(0.59%)#20 | 280,778(0.01%)#1,063 |
| 21. | Mechanicsburg Borough | 28 | 4,785(0.59%)#21 | 280,778(0.01%)#1,083 |
| 22. | Forest Hills Borough | 26 | 4,785(0.54%)#22 | 280,778(0.01%)#1,130 |
| 23. | Bellwood Borough | 23 | 4,785(0.48%)#23 | 280,778(0.01%)#1,193 |
| 24. | State College Borough | 21 | 4,785(0.44%)#24 | 280,778(0.01%)#1,227 |
| 25. | Brittany Farms The Highlands | 20 | 4,785(0.42%)#25 | 280,778(0.01%)#1,274 |
| 26. | Trappe Borough | 19 | 4,785(0.40%)#26 | 280,778(0.01%)#1,304 |
| 27. | Lansdale Borough | 18 | 4,785(0.38%)#27 | 280,778(0.01%)#1,324 |
| 28. | Park Forest Village | 18 | 4,785(0.38%)#28 | 280,778(0.01%)#1,334 |
| 29. | Orwigsburg Borough | 18 | 4,785(0.38%)#29 | 280,778(0.01%)#1,340 |
| 30. | Weatherly Borough | 18 | 4,785(0.38%)#30 | 280,778(0.01%)#1,341 |
| 31. | Wilkinsburg Borough | 15 | 4,785(0.31%)#31 | 280,778(0.01%)#1,447 |
| 32. | Ardmore | 15 | 4,785(0.31%)#32 | 280,778(0.01%)#1,448 |
| 33. | Wanamie | 15 | 4,785(0.31%)#33 | 280,778(0.01%)#1,466 |
| 34. | Ambridge Borough | 14 | 4,785(0.29%)#34 | 280,778(0.00%)#1,495 |
| 35. | Meadowood | 14 | 4,785(0.29%)#35 | 280,778(0.00%)#1,500 |
| 36. | Hershey | 13 | 4,785(0.27%)#36 | 280,778(0.00%)#1,523 |
| 37. | Swissvale Borough | 13 | 4,785(0.27%)#37 | 280,778(0.00%)#1,528 |
| 38. | Swarthmore Borough | 13 | 4,785(0.27%)#38 | 280,778(0.00%)#1,531 |
| 39. | Monroeville | 12 | 4,785(0.25%)#39 | 280,778(0.00%)#1,558 |
| 40. | Franklin Park Borough | 12 | 4,785(0.25%)#40 | 280,778(0.00%)#1,567 |
| 41. | Exton | 12 | 4,785(0.25%)#41 | 280,778(0.00%)#1,583 |
| 42. | Rosemont | 11 | 4,785(0.23%)#42 | 280,778(0.00%)#1,647 |
| 43. | Woodside | 11 | 4,785(0.23%)#43 | 280,778(0.00%)#1,652 |
| 44. | Carnot Moon | 9 | 4,785(0.19%)#44 | 280,778(0.00%)#1,726 |
| 45. | Slippery Rock Borough | 9 | 4,785(0.19%)#45 | 280,778(0.00%)#1,736 |
| 46. | Hermitage | 8 | 4,785(0.17%)#46 | 280,778(0.00%)#1,758 |
| 47. | Washington | 8 | 4,785(0.17%)#47 | 280,778(0.00%)#1,759 |
| 48. | Reiffton | 7 | 4,785(0.15%)#48 | 280,778(0.00%)#1,810 |
| 49. | Camp Hill Borough | 6 | 4,785(0.13%)#49 | 280,778(0.00%)#1,832 |
| 50. | Hellertown Borough | 6 | 4,785(0.13%)#50 | 280,778(0.00%)#1,836 |
| 51. | Aspinwall Borough | 6 | 4,785(0.13%)#51 | 280,778(0.00%)#1,842 |
| 52. | New Oxford Borough | 5 | 4,785(0.10%)#52 | 280,778(0.00%)#1,894 |
| 53. | Glen Osborne Borough | 5 | 4,785(0.10%)#53 | 280,778(0.00%)#1,897 |
| 54. | Oreland | 3 | 4,785(0.06%)#54 | 280,778(0.00%)#1,950 |
| 55. | Schwenksville Borough | 3 | 4,785(0.06%)#55 | 280,778(0.00%)#1,961 |
| 56. | Penn State Erie Behrend | 2 | 4,785(0.04%)#56 | 280,778(0.00%)#1,981 |
| 57. | East Washington Borough | 1 | 4,785(0.02%)#57 | 280,778(0.00%)#2,011 |
| 58. | Homewood Borough | 1 | 4,785(0.02%)#58 | 280,778(0.00%)#2,025 |
Common Questions
What are the Top 10 Cities with the Largest Filipino Community in Pennsylvania?
Top 10 Cities with the Largest Filipino Community in Pennsylvania are:
#1
1,222
#2
392
#3
42
#4
37
#5
34
#6
33
#7
33
#8
31
#9
31
#10
28
What city has the Largest Filipino Community in Pennsylvania?
Philadelphia has the Largest Filipino Community in Pennsylvania with 1,222.
What is the Total Filipino Population in the State of Pennsylvania?
Total Filipino Population in Pennsylvania is 4,785.
What is the Total Filipino Population in the United States?
Total Filipino Population in the United States is 280,778.