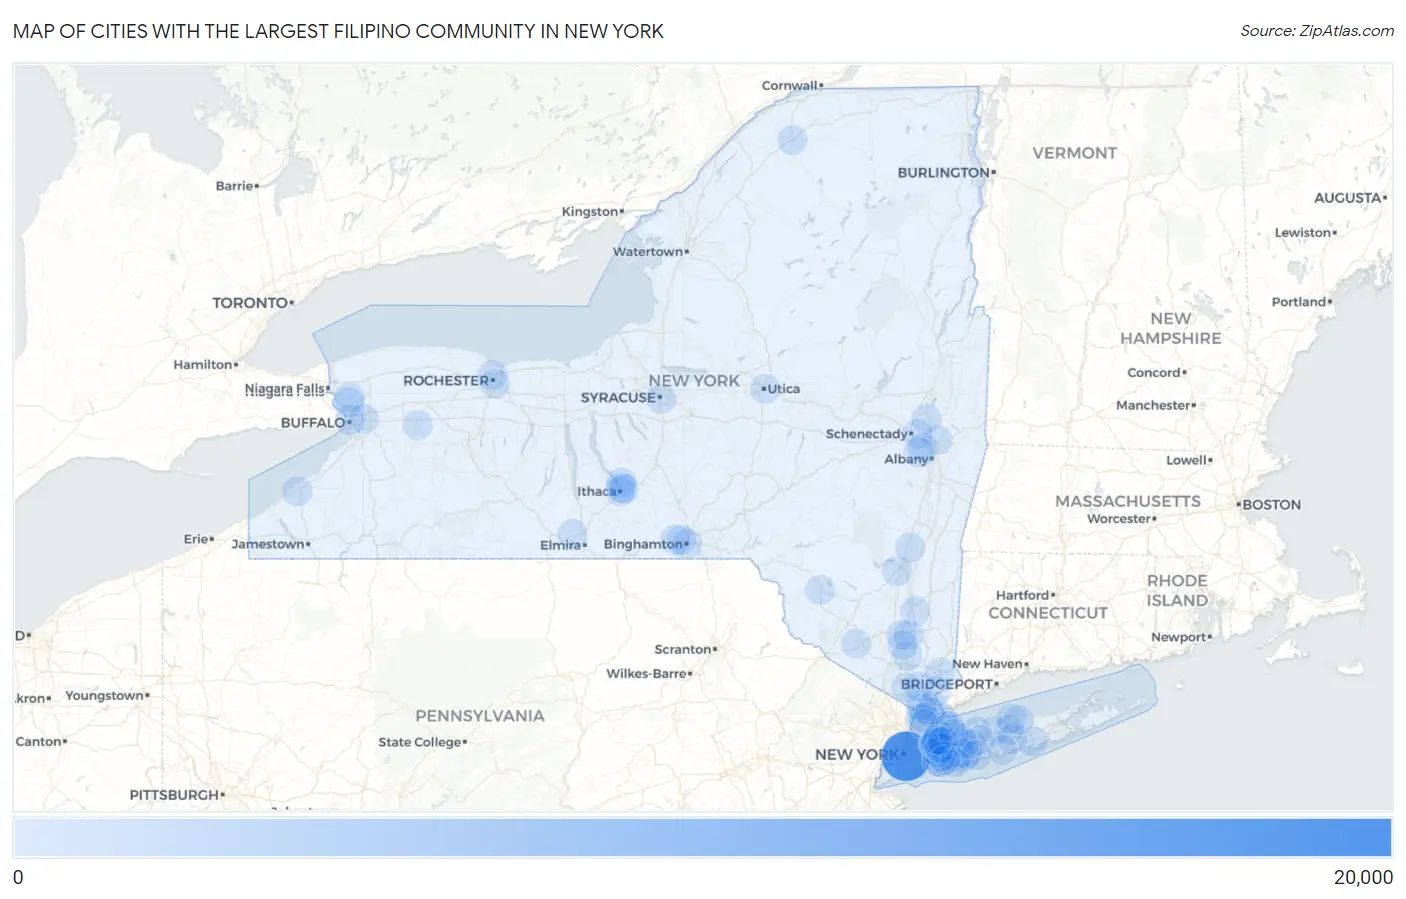
Cities with the Largest Filipino Community in New York
RELATED REPORTS & OPTIONS
Filipino
New York
Compare Cities
Map of Cities with the Largest Filipino Community in New York
0
20,000
Cities with the Largest Filipino Community in New York
| City | Filipino | vs State | vs National | |
| 1. | New York | 15,834 | 21,825(72.55%)#1 | 280,778(5.64%)#1 |
| 2. | Greenville Cdp Westchester County | 314 | 21,825(1.44%)#2 | 280,778(0.11%)#145 |
| 3. | Irvington | 219 | 21,825(1.00%)#3 | 280,778(0.08%)#199 |
| 4. | Jericho | 201 | 21,825(0.92%)#4 | 280,778(0.07%)#223 |
| 5. | Roslyn Heights | 188 | 21,825(0.86%)#5 | 280,778(0.07%)#244 |
| 6. | Port Washington | 165 | 21,825(0.76%)#6 | 280,778(0.06%)#274 |
| 7. | Shirley | 154 | 21,825(0.71%)#7 | 280,778(0.05%)#293 |
| 8. | Albertson | 118 | 21,825(0.54%)#8 | 280,778(0.04%)#389 |
| 9. | Rochester | 115 | 21,825(0.53%)#9 | 280,778(0.04%)#394 |
| 10. | White Plains | 108 | 21,825(0.49%)#10 | 280,778(0.04%)#416 |
| 11. | North Massapequa | 92 | 21,825(0.42%)#11 | 280,778(0.03%)#469 |
| 12. | Greenlawn | 90 | 21,825(0.41%)#12 | 280,778(0.03%)#479 |
| 13. | North Valley Stream | 87 | 21,825(0.40%)#13 | 280,778(0.03%)#490 |
| 14. | Yonkers | 84 | 21,825(0.38%)#14 | 280,778(0.03%)#501 |
| 15. | Smithtown | 76 | 21,825(0.35%)#15 | 280,778(0.03%)#545 |
| 16. | Valley Stream | 75 | 21,825(0.34%)#16 | 280,778(0.03%)#549 |
| 17. | Utica | 72 | 21,825(0.33%)#17 | 280,778(0.03%)#566 |
| 18. | North Hills | 65 | 21,825(0.30%)#18 | 280,778(0.02%)#622 |
| 19. | Cayuga Heights | 62 | 21,825(0.28%)#19 | 280,778(0.02%)#640 |
| 20. | Spackenkill | 58 | 21,825(0.27%)#20 | 280,778(0.02%)#666 |
| 21. | Buffalo | 55 | 21,825(0.25%)#21 | 280,778(0.02%)#687 |
| 22. | Holtsville | 54 | 21,825(0.25%)#22 | 280,778(0.02%)#699 |
| 23. | Tonawanda | 53 | 21,825(0.24%)#23 | 280,778(0.02%)#705 |
| 24. | Williston Park | 52 | 21,825(0.24%)#24 | 280,778(0.02%)#727 |
| 25. | Highland Falls | 52 | 21,825(0.24%)#25 | 280,778(0.02%)#729 |
| 26. | Syosset | 50 | 21,825(0.23%)#26 | 280,778(0.02%)#744 |
| 27. | Cohoes | 47 | 21,825(0.22%)#27 | 280,778(0.02%)#776 |
| 28. | Beacon | 47 | 21,825(0.22%)#28 | 280,778(0.02%)#777 |
| 29. | Ossining | 46 | 21,825(0.21%)#29 | 280,778(0.02%)#785 |
| 30. | Manhasset | 46 | 21,825(0.21%)#30 | 280,778(0.02%)#787 |
| 31. | Thomaston | 45 | 21,825(0.21%)#31 | 280,778(0.02%)#799 |
| 32. | Brighton | 42 | 21,825(0.19%)#32 | 280,778(0.01%)#827 |
| 33. | North Tonawanda | 42 | 21,825(0.19%)#33 | 280,778(0.01%)#831 |
| 34. | North Bellmore | 42 | 21,825(0.19%)#34 | 280,778(0.01%)#833 |
| 35. | South Farmingdale | 42 | 21,825(0.19%)#35 | 280,778(0.01%)#837 |
| 36. | Westmere | 42 | 21,825(0.19%)#36 | 280,778(0.01%)#842 |
| 37. | Ithaca | 41 | 21,825(0.19%)#37 | 280,778(0.01%)#849 |
| 38. | Rye | 41 | 21,825(0.19%)#38 | 280,778(0.01%)#853 |
| 39. | Dix Hills | 39 | 21,825(0.18%)#39 | 280,778(0.01%)#883 |
| 40. | Great Neck Estates | 38 | 21,825(0.17%)#40 | 280,778(0.01%)#903 |
| 41. | North New Hyde Park | 36 | 21,825(0.16%)#41 | 280,778(0.01%)#924 |
| 42. | Roslyn | 36 | 21,825(0.16%)#42 | 280,778(0.01%)#930 |
| 43. | Russell Gardens | 36 | 21,825(0.16%)#43 | 280,778(0.01%)#932 |
| 44. | Newburgh | 34 | 21,825(0.16%)#44 | 280,778(0.01%)#951 |
| 45. | Lansing | 34 | 21,825(0.16%)#45 | 280,778(0.01%)#961 |
| 46. | Syracuse | 33 | 21,825(0.15%)#46 | 280,778(0.01%)#962 |
| 47. | Garden City Park | 33 | 21,825(0.15%)#47 | 280,778(0.01%)#974 |
| 48. | Country Knolls | 32 | 21,825(0.15%)#48 | 280,778(0.01%)#987 |
| 49. | Ardsley | 32 | 21,825(0.15%)#49 | 280,778(0.01%)#988 |
| 50. | Mineola | 31 | 21,825(0.14%)#50 | 280,778(0.01%)#999 |
| 51. | Mount Vernon | 30 | 21,825(0.14%)#51 | 280,778(0.01%)#1,015 |
| 52. | Melville | 30 | 21,825(0.14%)#52 | 280,778(0.01%)#1,020 |
| 53. | Attica | 30 | 21,825(0.14%)#53 | 280,778(0.01%)#1,029 |
| 54. | Centereach | 29 | 21,825(0.13%)#54 | 280,778(0.01%)#1,040 |
| 55. | Endwell | 29 | 21,825(0.13%)#55 | 280,778(0.01%)#1,050 |
| 56. | Port Washington North | 29 | 21,825(0.13%)#56 | 280,778(0.01%)#1,055 |
| 57. | Cheektowaga | 28 | 21,825(0.13%)#57 | 280,778(0.01%)#1,064 |
| 58. | Levittown | 28 | 21,825(0.13%)#58 | 280,778(0.01%)#1,067 |
| 59. | Scarsdale | 28 | 21,825(0.13%)#59 | 280,778(0.01%)#1,076 |
| 60. | Great Neck | 25 | 21,825(0.11%)#60 | 280,778(0.01%)#1,143 |
| 61. | Armonk | 25 | 21,825(0.11%)#61 | 280,778(0.01%)#1,148 |
| 62. | Tioga Terrace | 24 | 21,825(0.11%)#62 | 280,778(0.01%)#1,170 |
| 63. | New City | 23 | 21,825(0.11%)#63 | 280,778(0.01%)#1,177 |
| 64. | Lynbrook | 23 | 21,825(0.11%)#64 | 280,778(0.01%)#1,183 |
| 65. | Oakdale | 23 | 21,825(0.11%)#65 | 280,778(0.01%)#1,188 |
| 66. | University Gardens | 23 | 21,825(0.11%)#66 | 280,778(0.01%)#1,191 |
| 67. | Plainview | 22 | 21,825(0.10%)#67 | 280,778(0.01%)#1,201 |
| 68. | Rochester Institute Of Technology | 22 | 21,825(0.10%)#68 | 280,778(0.01%)#1,213 |
| 69. | Hempstead | 21 | 21,825(0.10%)#69 | 280,778(0.01%)#1,223 |
| 70. | Franklin Square | 21 | 21,825(0.10%)#70 | 280,778(0.01%)#1,231 |
| 71. | Binghamton | 19 | 21,825(0.09%)#71 | 280,778(0.01%)#1,283 |
| 72. | Glen Cove | 19 | 21,825(0.09%)#72 | 280,778(0.01%)#1,287 |
| 73. | Floral Park | 19 | 21,825(0.09%)#73 | 280,778(0.01%)#1,294 |
| 74. | Potsdam | 19 | 21,825(0.09%)#74 | 280,778(0.01%)#1,299 |
| 75. | Port Jefferson | 19 | 21,825(0.09%)#75 | 280,778(0.01%)#1,301 |
| 76. | Tuckahoe | 19 | 21,825(0.09%)#76 | 280,778(0.01%)#1,302 |
| 77. | Kensington | 19 | 21,825(0.09%)#77 | 280,778(0.01%)#1,305 |
| 78. | Big Flats | 18 | 21,825(0.08%)#78 | 280,778(0.01%)#1,336 |
| 79. | Lattingtown | 18 | 21,825(0.08%)#79 | 280,778(0.01%)#1,342 |
| 80. | Manhasset Hills | 17 | 21,825(0.08%)#80 | 280,778(0.01%)#1,386 |
| 81. | Katonah | 17 | 21,825(0.08%)#81 | 280,778(0.01%)#1,389 |
| 82. | West Babylon | 16 | 21,825(0.07%)#82 | 280,778(0.01%)#1,396 |
| 83. | Niskayuna | 16 | 21,825(0.07%)#83 | 280,778(0.01%)#1,406 |
| 84. | Roslyn Estates | 16 | 21,825(0.07%)#84 | 280,778(0.01%)#1,427 |
| 85. | Middletown | 15 | 21,825(0.07%)#85 | 280,778(0.01%)#1,438 |
| 86. | Merrick | 15 | 21,825(0.07%)#86 | 280,778(0.01%)#1,443 |
| 87. | Vassar College | 15 | 21,825(0.07%)#87 | 280,778(0.01%)#1,461 |
| 88. | Rockville Centre | 14 | 21,825(0.06%)#88 | 280,778(0.00%)#1,482 |
| 89. | Colonie | 14 | 21,825(0.06%)#89 | 280,778(0.00%)#1,493 |
| 90. | Hurley | 14 | 21,825(0.06%)#90 | 280,778(0.00%)#1,498 |
| 91. | Johnson City | 13 | 21,825(0.06%)#91 | 280,778(0.00%)#1,520 |
| 92. | Miller Place | 13 | 21,825(0.06%)#92 | 280,778(0.00%)#1,525 |
| 93. | Liberty | 13 | 21,825(0.06%)#93 | 280,778(0.00%)#1,533 |
| 94. | Cornwall On Hudson | 13 | 21,825(0.06%)#94 | 280,778(0.00%)#1,536 |
| 95. | Upper Brookville | 13 | 21,825(0.06%)#95 | 280,778(0.00%)#1,537 |
| 96. | Forest Home | 13 | 21,825(0.06%)#96 | 280,778(0.00%)#1,540 |
| 97. | Plandome Heights | 13 | 21,825(0.06%)#97 | 280,778(0.00%)#1,543 |
| 98. | Fredonia | 12 | 21,825(0.05%)#98 | 280,778(0.00%)#1,573 |
| 99. | Saugerties | 12 | 21,825(0.05%)#99 | 280,778(0.00%)#1,587 |
| 100. | Hamilton College | 12 | 21,825(0.05%)#100 | 280,778(0.00%)#1,592 |
Common Questions
What are the Top 10 Cities with the Largest Filipino Community in New York?
Top 10 Cities with the Largest Filipino Community in New York are:
#1
15,834
#2
219
#3
201
#4
188
#5
165
#6
154
#7
118
#8
115
#9
108
#10
92
What city has the Largest Filipino Community in New York?
New York has the Largest Filipino Community in New York with 15,834.
What is the Total Filipino Population in the State of New York?
Total Filipino Population in New York is 21,825.
What is the Total Filipino Population in the United States?
Total Filipino Population in the United States is 280,778.