Cities with the Highest Poverty Level Among Females Between Ages 25 and 34 in South Carolina
RELATED REPORTS & OPTIONS
Highest Poverty | Female 25-34
South Carolina
Compare Cities
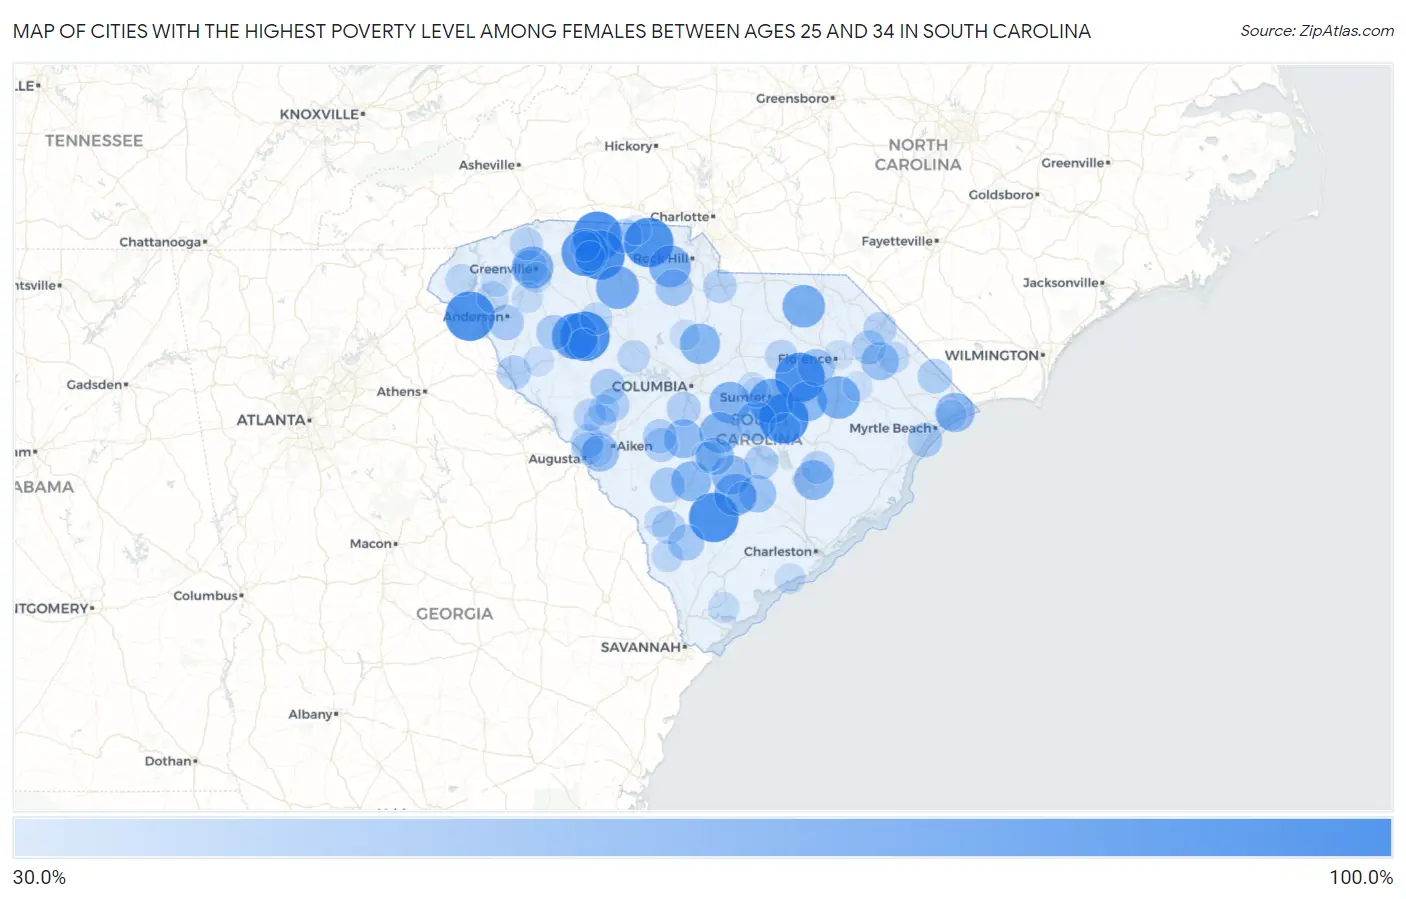
Map of Cities with the Highest Poverty Level Among Females Between Ages 25 and 34 in South Carolina
0.0%
100.0%
Cities with the Highest Poverty Level Among Females Between Ages 25 and 34 in South Carolina
| City | Female Poverty | vs State | vs National | |
| 1. | Mayo | 100.0% | 17.7%(+82.3)#1 | 14.5%(+85.5)#18 |
| 2. | Dale | 100.0% | 17.7%(+82.3)#2 | 14.5%(+85.5)#89 |
| 3. | Newtown | 100.0% | 17.7%(+82.3)#3 | 14.5%(+85.5)#120 |
| 4. | Centenary | 100.0% | 17.7%(+82.3)#4 | 14.5%(+85.5)#166 |
| 5. | Fair Play | 100.0% | 17.7%(+82.3)#5 | 14.5%(+85.5)#170 |
| 6. | Alcolu | 100.0% | 17.7%(+82.3)#6 | 14.5%(+85.5)#231 |
| 7. | Glendale | 100.0% | 17.7%(+82.3)#7 | 14.5%(+85.5)#311 |
| 8. | Lynchburg | 100.0% | 17.7%(+82.3)#8 | 14.5%(+85.5)#320 |
| 9. | Williams | 100.0% | 17.7%(+82.3)#9 | 14.5%(+85.5)#362 |
| 10. | Mountville | 100.0% | 17.7%(+82.3)#10 | 14.5%(+85.5)#466 |
| 11. | Smyrna | 100.0% | 17.7%(+82.3)#11 | 14.5%(+85.5)#678 |
| 12. | Saxon | 92.0% | 17.7%(+74.3)#12 | 14.5%(+77.5)#719 |
| 13. | Waterloo | 88.9% | 17.7%(+71.2)#13 | 14.5%(+74.4)#752 |
| 14. | South Sumter | 84.5% | 17.7%(+66.8)#14 | 14.5%(+70.0)#829 |
| 15. | Olympia | 79.4% | 17.7%(+61.7)#15 | 14.5%(+64.9)#946 |
| 16. | Buffalo | 78.6% | 17.7%(+60.9)#16 | 14.5%(+64.1)#964 |
| 17. | Scranton | 77.3% | 17.7%(+59.6)#17 | 14.5%(+62.8)#1,000 |
| 18. | Patrick | 77.3% | 17.7%(+59.6)#18 | 14.5%(+62.8)#1,002 |
| 19. | City View | 75.1% | 17.7%(+57.5)#19 | 14.5%(+60.6)#1,053 |
| 20. | Mcconnells | 75.0% | 17.7%(+57.3)#20 | 14.5%(+60.5)#1,069 |
| 21. | Reevesville | 75.0% | 17.7%(+57.3)#21 | 14.5%(+60.5)#1,071 |
| 22. | Eastover | 73.3% | 17.7%(+55.6)#22 | 14.5%(+58.8)#1,109 |
| 23. | Manville | 72.5% | 17.7%(+54.8)#23 | 14.5%(+58.0)#1,133 |
| 24. | St Matthews | 72.1% | 17.7%(+54.4)#24 | 14.5%(+57.6)#1,145 |
| 25. | Dovesville | 71.8% | 17.7%(+54.1)#25 | 14.5%(+57.3)#1,155 |
| 26. | Ridgeway | 69.6% | 17.7%(+51.9)#26 | 14.5%(+55.1)#1,237 |
| 27. | Turbeville | 69.2% | 17.7%(+51.5)#27 | 14.5%(+54.7)#1,244 |
| 28. | Bamberg | 68.7% | 17.7%(+51.0)#28 | 14.5%(+54.2)#1,267 |
| 29. | Pinewood | 68.6% | 17.7%(+50.9)#29 | 14.5%(+54.1)#1,270 |
| 30. | Bonneau | 68.2% | 17.7%(+50.5)#30 | 14.5%(+53.7)#1,290 |
| 31. | Bowman | 67.3% | 17.7%(+49.6)#31 | 14.5%(+52.8)#1,328 |
| 32. | Atlantic Beach | 66.7% | 17.7%(+49.0)#32 | 14.5%(+52.2)#1,368 |
| 33. | North | 65.4% | 17.7%(+47.7)#33 | 14.5%(+50.9)#1,461 |
| 34. | Langley | 62.6% | 17.7%(+44.9)#34 | 14.5%(+48.1)#1,563 |
| 35. | Marion | 61.5% | 17.7%(+43.8)#35 | 14.5%(+47.0)#1,636 |
| 36. | Wilkinson Heights | 61.5% | 17.7%(+43.8)#36 | 14.5%(+47.0)#1,637 |
| 37. | Harleyville | 60.5% | 17.7%(+42.8)#37 | 14.5%(+46.0)#1,669 |
| 38. | Timmonsville | 58.8% | 17.7%(+41.1)#38 | 14.5%(+44.3)#1,776 |
| 39. | Litchfield Beach | 58.5% | 17.7%(+40.9)#39 | 14.5%(+44.0)#1,803 |
| 40. | Eureka Mill | 57.7% | 17.7%(+40.0)#40 | 14.5%(+43.2)#1,857 |
| 41. | Varnville | 56.0% | 17.7%(+38.3)#41 | 14.5%(+41.5)#1,977 |
| 42. | Little Rock | 55.0% | 17.7%(+37.3)#42 | 14.5%(+40.5)#2,054 |
| 43. | Homeland Park | 54.5% | 17.7%(+36.8)#43 | 14.5%(+40.0)#2,105 |
| 44. | Hilda | 53.3% | 17.7%(+35.6)#44 | 14.5%(+38.8)#2,192 |
| 45. | Parker | 52.8% | 17.7%(+35.1)#45 | 14.5%(+38.3)#2,236 |
| 46. | Ware Shoals | 52.7% | 17.7%(+35.0)#46 | 14.5%(+38.2)#2,242 |
| 47. | Saluda | 52.0% | 17.7%(+34.3)#47 | 14.5%(+37.5)#2,294 |
| 48. | Surfside Beach | 51.6% | 17.7%(+33.9)#48 | 14.5%(+37.1)#2,318 |
| 49. | Loris | 51.5% | 17.7%(+33.8)#49 | 14.5%(+37.0)#2,325 |
| 50. | East Gaffney | 51.4% | 17.7%(+33.7)#50 | 14.5%(+36.9)#2,330 |
| 51. | Camp Croft | 50.6% | 17.7%(+32.9)#51 | 14.5%(+36.1)#2,376 |
| 52. | Calhoun Falls | 50.5% | 17.7%(+32.8)#52 | 14.5%(+36.0)#2,385 |
| 53. | Gaston | 50.4% | 17.7%(+32.7)#53 | 14.5%(+35.9)#2,386 |
| 54. | Salley | 50.0% | 17.7%(+32.3)#54 | 14.5%(+35.5)#2,482 |
| 55. | Perry | 50.0% | 17.7%(+32.3)#55 | 14.5%(+35.5)#2,485 |
| 56. | Ward | 50.0% | 17.7%(+32.3)#56 | 14.5%(+35.5)#2,496 |
| 57. | Sellers | 50.0% | 17.7%(+32.3)#57 | 14.5%(+35.5)#2,558 |
| 58. | Vance | 50.0% | 17.7%(+32.3)#58 | 14.5%(+35.5)#2,575 |
| 59. | Lancaster | 48.5% | 17.7%(+30.9)#59 | 14.5%(+34.1)#2,670 |
| 60. | Murphys Estates | 48.1% | 17.7%(+30.5)#60 | 14.5%(+33.7)#2,697 |
| 61. | Fairfax | 48.1% | 17.7%(+30.4)#61 | 14.5%(+33.6)#2,702 |
| 62. | Wyboo | 47.9% | 17.7%(+30.2)#62 | 14.5%(+33.4)#2,725 |
| 63. | Dillon | 47.6% | 17.7%(+29.9)#63 | 14.5%(+33.1)#2,753 |
| 64. | St Stephen | 47.5% | 17.7%(+29.8)#64 | 14.5%(+33.0)#2,760 |
| 65. | Slater Marietta | 47.1% | 17.7%(+29.4)#65 | 14.5%(+32.6)#2,792 |
| 66. | Trenton | 46.7% | 17.7%(+29.0)#66 | 14.5%(+32.2)#2,858 |
| 67. | Bishopville | 46.2% | 17.7%(+28.5)#67 | 14.5%(+31.7)#2,892 |
| 68. | Edgefield | 45.5% | 17.7%(+27.9)#68 | 14.5%(+31.1)#2,974 |
| 69. | Belvedere | 45.2% | 17.7%(+27.5)#69 | 14.5%(+30.7)#3,010 |
| 70. | Clinton | 44.8% | 17.7%(+27.1)#70 | 14.5%(+30.3)#3,049 |
| 71. | Prosperity | 44.4% | 17.7%(+26.8)#71 | 14.5%(+30.0)#3,097 |
| 72. | Walhalla | 43.6% | 17.7%(+25.9)#72 | 14.5%(+29.1)#3,220 |
| 73. | Pendleton | 43.5% | 17.7%(+25.8)#73 | 14.5%(+29.0)#3,222 |
| 74. | Estill | 43.4% | 17.7%(+25.7)#74 | 14.5%(+28.9)#3,241 |
| 75. | Drayton | 42.9% | 17.7%(+25.2)#75 | 14.5%(+28.4)#3,292 |
| 76. | Mullins | 42.5% | 17.7%(+24.8)#76 | 14.5%(+28.0)#3,365 |
| 77. | Johnston | 41.6% | 17.7%(+23.9)#77 | 14.5%(+27.1)#3,479 |
| 78. | Allendale | 41.5% | 17.7%(+23.8)#78 | 14.5%(+27.0)#3,487 |
| 79. | Manning | 41.3% | 17.7%(+23.6)#79 | 14.5%(+26.8)#3,525 |
| 80. | West Pelzer | 41.2% | 17.7%(+23.5)#80 | 14.5%(+26.7)#3,528 |
| 81. | Norris | 40.9% | 17.7%(+23.2)#81 | 14.5%(+26.4)#3,574 |
| 82. | St George | 40.9% | 17.7%(+23.2)#82 | 14.5%(+26.4)#3,583 |
| 83. | Shell Point | 40.7% | 17.7%(+23.0)#83 | 14.5%(+26.2)#3,611 |
| 84. | Briarcliffe Acres | 40.6% | 17.7%(+22.9)#84 | 14.5%(+26.1)#3,622 |
| 85. | Edisto | 40.2% | 17.7%(+22.5)#85 | 14.5%(+25.7)#3,666 |
| 86. | Gantt | 40.2% | 17.7%(+22.5)#86 | 14.5%(+25.7)#3,669 |
| 87. | Winnsboro | 40.1% | 17.7%(+22.4)#87 | 14.5%(+25.6)#3,674 |
| 88. | Seabrook Island | 40.0% | 17.7%(+22.3)#88 | 14.5%(+25.5)#3,684 |
| 89. | Oakland | 40.0% | 17.7%(+22.3)#89 | 14.5%(+25.5)#3,695 |
| 90. | Burnettown | 39.9% | 17.7%(+22.2)#90 | 14.5%(+25.4)#3,780 |
| 91. | Abbeville | 38.8% | 17.7%(+21.1)#91 | 14.5%(+24.3)#3,933 |
| 92. | Valley Falls | 38.5% | 17.7%(+20.8)#92 | 14.5%(+24.0)#3,958 |
| 93. | Cross Hill | 38.5% | 17.7%(+20.8)#93 | 14.5%(+24.0)#3,969 |
| 94. | Spartanburg | 38.1% | 17.7%(+20.4)#94 | 14.5%(+23.6)#4,047 |
| 95. | Cherryvale | 37.9% | 17.7%(+20.2)#95 | 14.5%(+23.4)#4,064 |
| 96. | Blacksburg | 37.8% | 17.7%(+20.1)#96 | 14.5%(+23.3)#4,074 |
| 97. | East Camden | 37.8% | 17.7%(+20.1)#97 | 14.5%(+23.3)#4,077 |
| 98. | Orangeburg | 37.8% | 17.7%(+20.1)#98 | 14.5%(+23.3)#4,082 |
| 99. | Pamplico | 37.7% | 17.7%(+20.1)#99 | 14.5%(+23.2)#4,085 |
| 100. | Quinby | 37.5% | 17.7%(+19.8)#100 | 14.5%(+23.0)#4,112 |
Common Questions
What are the Top 10 Cities with the Highest Poverty Level Among Females Between Ages 25 and 34 in South Carolina?
Top 10 Cities with the Highest Poverty Level Among Females Between Ages 25 and 34 in South Carolina are:
What city has the Highest Poverty Level Among Females Between Ages 25 and 34 in South Carolina?
Mayo has the Highest Poverty Level Among Females Between Ages 25 and 34 in South Carolina with 100.0%.
What is the Poverty Level Among Females Between Ages 25 and 34 in the State of South Carolina?
Poverty Level Among Females Between Ages 25 and 34 in South Carolina is 17.7%.
What is the Poverty Level Among Females Between Ages 25 and 34 in the United States?
Poverty Level Among Females Between Ages 25 and 34 in the United States is 14.5%.