Cities with the Highest Poverty Level Among Females Between Ages 25 and 34 in Massachusetts
RELATED REPORTS & OPTIONS
Highest Poverty | Female 25-34
Massachusetts
Compare Cities
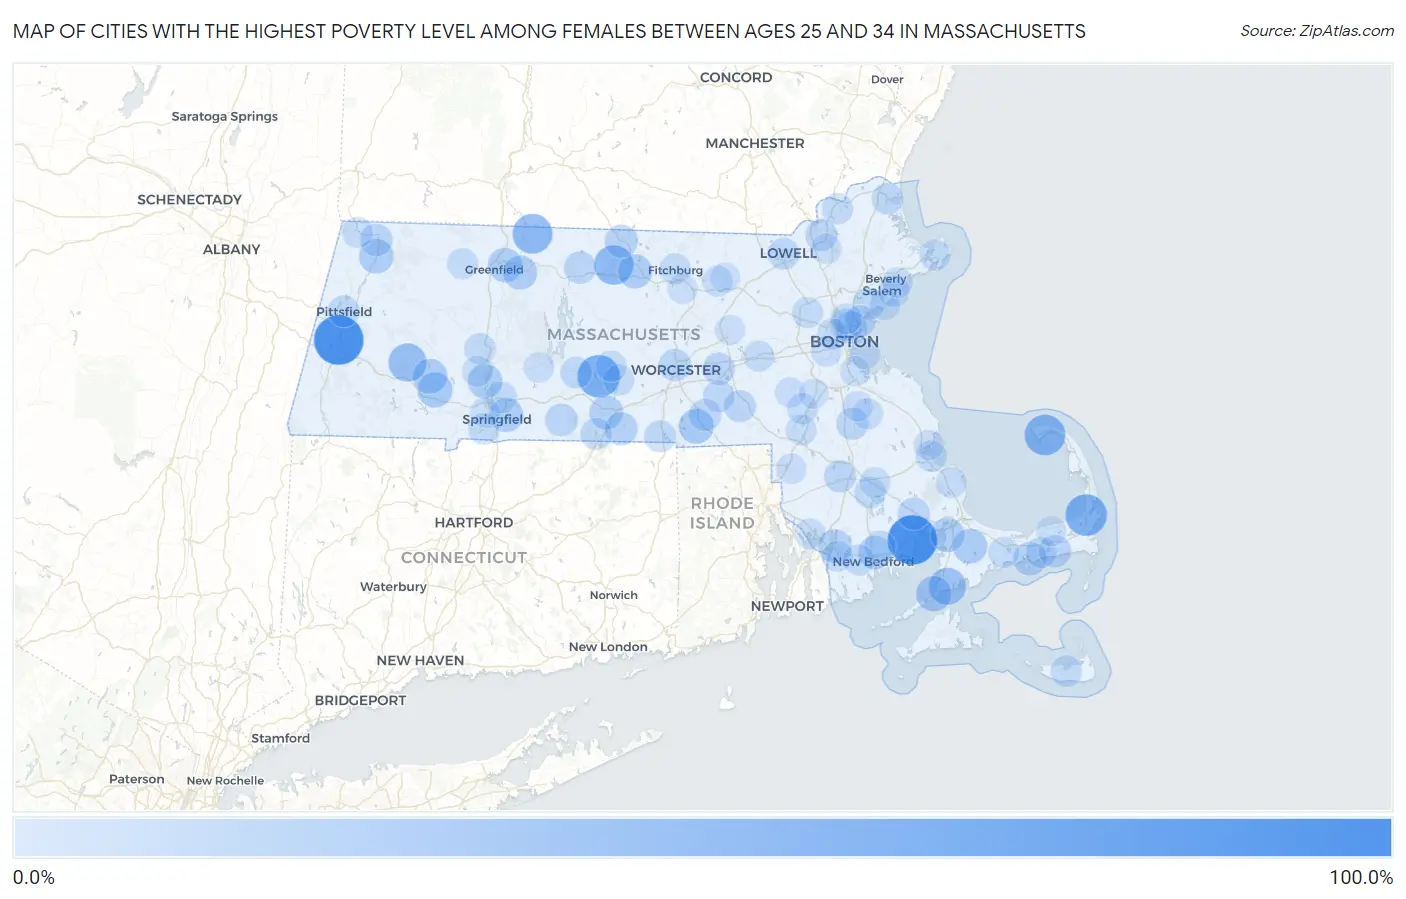
Map of Cities with the Highest Poverty Level Among Females Between Ages 25 and 34 in Massachusetts
0.0%
100.0%
Cities with the Highest Poverty Level Among Females Between Ages 25 and 34 in Massachusetts
| City | Female Poverty | vs State | vs National | |
| 1. | Lenox | 100.0% | 11.1%(+88.9)#1 | 14.5%(+85.5)#15 |
| 2. | Oak Bluffs | 100.0% | 11.1%(+88.9)#2 | 14.5%(+85.5)#36 |
| 3. | Marion Center | 100.0% | 11.1%(+88.9)#3 | 14.5%(+85.5)#85 |
| 4. | West Brookfield | 66.7% | 11.1%(+55.5)#4 | 14.5%(+52.2)#1,342 |
| 5. | Orleans | 61.5% | 11.1%(+50.4)#5 | 14.5%(+47.0)#1,623 |
| 6. | Provincetown | 57.8% | 11.1%(+46.7)#6 | 14.5%(+43.3)#1,854 |
| 7. | Northfield | 52.9% | 11.1%(+41.7)#7 | 14.5%(+38.4)#2,233 |
| 8. | Baldwinville | 51.9% | 11.1%(+40.8)#8 | 14.5%(+37.4)#2,296 |
| 9. | Chester | 44.8% | 11.1%(+33.7)#9 | 14.5%(+30.3)#3,054 |
| 10. | Falmouth | 40.0% | 11.1%(+28.9)#10 | 14.5%(+25.5)#3,680 |
| 11. | Woods Hole | 32.5% | 11.1%(+21.4)#11 | 14.5%(+18.0)#5,141 |
| 12. | Russell | 30.8% | 11.1%(+19.7)#12 | 14.5%(+16.3)#5,506 |
| 13. | East Douglas | 30.6% | 11.1%(+19.5)#13 | 14.5%(+16.1)#5,545 |
| 14. | Huntington | 30.4% | 11.1%(+19.3)#14 | 14.5%(+15.9)#5,590 |
| 15. | Forestdale | 29.3% | 11.1%(+18.2)#15 | 14.5%(+14.8)#5,824 |
| 16. | Adams | 28.8% | 11.1%(+17.6)#16 | 14.5%(+14.3)#5,960 |
| 17. | Holyoke | 28.2% | 11.1%(+17.1)#17 | 14.5%(+13.7)#6,164 |
| 18. | Gardner | 27.8% | 11.1%(+16.7)#18 | 14.5%(+13.3)#6,241 |
| 19. | Turners Falls | 27.6% | 11.1%(+16.5)#19 | 14.5%(+13.1)#6,300 |
| 20. | Monument Beach | 26.7% | 11.1%(+15.5)#20 | 14.5%(+12.2)#6,547 |
| 21. | Millers Falls | 26.7% | 11.1%(+15.5)#21 | 14.5%(+12.2)#6,557 |
| 22. | Springfield | 26.0% | 11.1%(+14.9)#22 | 14.5%(+11.5)#6,754 |
| 23. | Fiskdale | 24.9% | 11.1%(+13.8)#23 | 14.5%(+10.4)#7,178 |
| 24. | Fall River | 24.4% | 11.1%(+13.3)#24 | 14.5%(+9.87)#7,301 |
| 25. | West Yarmouth | 24.3% | 11.1%(+13.2)#25 | 14.5%(+9.84)#7,312 |
| 26. | New Bedford | 24.0% | 11.1%(+12.8)#26 | 14.5%(+9.46)#7,432 |
| 27. | Southbridge Town | 21.7% | 11.1%(+10.6)#27 | 14.5%(+7.22)#8,242 |
| 28. | Winchendon | 21.6% | 11.1%(+10.4)#28 | 14.5%(+7.07)#8,298 |
| 29. | Monson Center | 19.7% | 11.1%(+8.60)#29 | 14.5%(+5.22)#9,052 |
| 30. | Athol | 19.4% | 11.1%(+8.29)#30 | 14.5%(+4.92)#9,150 |
| 31. | North Adams | 19.2% | 11.1%(+8.05)#31 | 14.5%(+4.68)#9,236 |
| 32. | Dennis Port | 19.0% | 11.1%(+7.87)#32 | 14.5%(+4.49)#9,328 |
| 33. | Worcester | 19.0% | 11.1%(+7.84)#33 | 14.5%(+4.46)#9,346 |
| 34. | West Wareham | 18.8% | 11.1%(+7.72)#34 | 14.5%(+4.34)#9,387 |
| 35. | Westborough | 18.4% | 11.1%(+7.30)#35 | 14.5%(+3.93)#9,567 |
| 36. | Greenfield | 18.2% | 11.1%(+7.08)#36 | 14.5%(+3.71)#9,644 |
| 37. | Chelsea | 18.1% | 11.1%(+6.98)#37 | 14.5%(+3.60)#9,750 |
| 38. | Whitinsville | 17.9% | 11.1%(+6.77)#38 | 14.5%(+3.39)#9,822 |
| 39. | Taunton | 17.9% | 11.1%(+6.75)#39 | 14.5%(+3.37)#9,828 |
| 40. | Milford | 17.7% | 11.1%(+6.60)#40 | 14.5%(+3.22)#9,896 |
| 41. | Brockton | 17.2% | 11.1%(+6.09)#41 | 14.5%(+2.71)#10,119 |
| 42. | Everett | 17.1% | 11.1%(+5.98)#42 | 14.5%(+2.60)#10,165 |
| 43. | Lawrence | 17.1% | 11.1%(+5.94)#43 | 14.5%(+2.56)#10,182 |
| 44. | Ware | 16.3% | 11.1%(+5.15)#44 | 14.5%(+1.78)#10,534 |
| 45. | Upton | 16.2% | 11.1%(+5.10)#45 | 14.5%(+1.72)#10,554 |
| 46. | Lowell | 16.2% | 11.1%(+5.05)#46 | 14.5%(+1.67)#10,575 |
| 47. | Pittsfield | 16.0% | 11.1%(+4.90)#47 | 14.5%(+1.52)#10,636 |
| 48. | Holland | 16.0% | 11.1%(+4.88)#48 | 14.5%(+1.51)#10,650 |
| 49. | Webster | 16.0% | 11.1%(+4.86)#49 | 14.5%(+1.49)#10,666 |
| 50. | Lynn | 15.8% | 11.1%(+4.70)#50 | 14.5%(+1.33)#10,724 |
| 51. | Revere | 15.6% | 11.1%(+4.45)#51 | 14.5%(+1.07)#10,848 |
| 52. | Newburyport | 15.3% | 11.1%(+4.20)#52 | 14.5%(+0.821)#11,008 |
| 53. | Acushnet Center | 15.2% | 11.1%(+4.13)#53 | 14.5%(+0.750)#11,039 |
| 54. | North Lakeville | 15.1% | 11.1%(+3.94)#54 | 14.5%(+0.564)#11,119 |
| 55. | Northampton | 14.8% | 11.1%(+3.68)#55 | 14.5%(+0.302)#11,255 |
| 56. | Agawam Town | 14.7% | 11.1%(+3.62)#56 | 14.5%(+0.240)#11,277 |
| 57. | Chicopee | 14.6% | 11.1%(+3.52)#57 | 14.5%(+0.146)#11,312 |
| 58. | Nantucket | 14.5% | 11.1%(+3.43)#58 | 14.5%(+0.055)#11,357 |
| 59. | North Plymouth | 14.5% | 11.1%(+3.40)#59 | 14.5%(+0.019)#11,382 |
| 60. | Salem | 14.3% | 11.1%(+3.18)#60 | 14.5%(-0.195)#11,458 |
| 61. | Smith Mills | 14.2% | 11.1%(+3.11)#61 | 14.5%(-0.263)#11,596 |
| 62. | Haverhill | 13.6% | 11.1%(+2.53)#62 | 14.5%(-0.847)#11,863 |
| 63. | Fitchburg | 13.6% | 11.1%(+2.51)#63 | 14.5%(-0.867)#11,889 |
| 64. | South Yarmouth | 13.1% | 11.1%(+2.02)#64 | 14.5%(-1.36)#12,124 |
| 65. | Shelburne Falls | 12.9% | 11.1%(+1.82)#65 | 14.5%(-1.55)#12,207 |
| 66. | Gloucester | 12.9% | 11.1%(+1.81)#66 | 14.5%(-1.57)#12,216 |
| 67. | Lexington | 12.9% | 11.1%(+1.75)#67 | 14.5%(-1.63)#12,246 |
| 68. | East Brookfield | 12.8% | 11.1%(+1.65)#68 | 14.5%(-1.73)#12,285 |
| 69. | North Brookfield | 12.6% | 11.1%(+1.53)#69 | 14.5%(-1.85)#12,329 |
| 70. | Framingham | 12.6% | 11.1%(+1.48)#70 | 14.5%(-1.89)#12,353 |
| 71. | Barnstable Town | 12.4% | 11.1%(+1.26)#71 | 14.5%(-2.11)#12,502 |
| 72. | Foxborough | 12.2% | 11.1%(+1.13)#72 | 14.5%(-2.24)#12,565 |
| 73. | Middleborough Center | 12.2% | 11.1%(+1.11)#73 | 14.5%(-2.26)#12,579 |
| 74. | Abington | 12.2% | 11.1%(+1.11)#74 | 14.5%(-2.27)#12,580 |
| 75. | Malden | 12.2% | 11.1%(+1.09)#75 | 14.5%(-2.29)#12,583 |
| 76. | Boston | 12.1% | 11.1%(+1.02)#76 | 14.5%(-2.36)#12,623 |
| 77. | The Pinehills | 12.0% | 11.1%(+0.920)#77 | 14.5%(-2.46)#12,671 |
| 78. | Easthampton Town | 11.8% | 11.1%(+0.725)#78 | 14.5%(-2.65)#12,792 |
| 79. | Ocean Grove | 11.6% | 11.1%(+0.511)#79 | 14.5%(-2.87)#12,948 |
| 80. | Cambridge | 11.6% | 11.1%(+0.440)#80 | 14.5%(-2.94)#12,985 |
| 81. | Williamstown | 11.5% | 11.1%(+0.422)#81 | 14.5%(-2.96)#12,990 |
| 82. | North Westport | 11.5% | 11.1%(+0.372)#82 | 14.5%(-3.00)#13,030 |
| 83. | Walpole | 11.4% | 11.1%(+0.312)#83 | 14.5%(-3.07)#13,051 |
| 84. | Devens | 11.1% | 11.1%(-0.006)#84 | 14.5%(-3.38)#13,197 |
| 85. | Swampscott | 10.9% | 11.1%(-0.255)#85 | 14.5%(-3.63)#13,353 |
| 86. | Beverly | 10.7% | 11.1%(-0.391)#86 | 14.5%(-3.77)#13,428 |
| 87. | Andover | 10.5% | 11.1%(-0.575)#87 | 14.5%(-3.95)#13,538 |
| 88. | Holbrook | 10.5% | 11.1%(-0.603)#88 | 14.5%(-3.98)#13,585 |
| 89. | Attleboro | 10.5% | 11.1%(-0.610)#89 | 14.5%(-3.99)#13,589 |
| 90. | Belchertown | 10.3% | 11.1%(-0.791)#90 | 14.5%(-4.17)#13,697 |
| 91. | Brookline | 10.3% | 11.1%(-0.838)#91 | 14.5%(-4.21)#13,727 |
| 92. | South Duxbury | 9.5% | 11.1%(-1.59)#92 | 14.5%(-4.97)#14,141 |
| 93. | Medfield | 9.2% | 11.1%(-1.90)#93 | 14.5%(-5.28)#14,347 |
| 94. | West Springfield Town | 9.1% | 11.1%(-1.98)#94 | 14.5%(-5.36)#14,384 |
| 95. | Leominster | 9.0% | 11.1%(-2.10)#95 | 14.5%(-5.48)#14,488 |
| 96. | Ayer | 9.0% | 11.1%(-2.11)#96 | 14.5%(-5.48)#14,493 |
| 97. | Hudson | 9.0% | 11.1%(-2.12)#97 | 14.5%(-5.49)#14,496 |
| 98. | East Dennis | 8.7% | 11.1%(-2.42)#98 | 14.5%(-5.80)#14,652 |
| 99. | Quincy | 8.6% | 11.1%(-2.52)#99 | 14.5%(-5.90)#14,735 |
| 100. | Norwood | 8.4% | 11.1%(-2.67)#100 | 14.5%(-6.05)#14,829 |
Common Questions
What are the Top 10 Cities with the Highest Poverty Level Among Females Between Ages 25 and 34 in Massachusetts?
Top 10 Cities with the Highest Poverty Level Among Females Between Ages 25 and 34 in Massachusetts are:
#1
100.0%
#2
100.0%
#3
66.7%
#4
61.5%
#5
57.8%
#6
52.9%
#7
51.9%
#8
44.8%
#9
40.0%
#10
32.5%
What city has the Highest Poverty Level Among Females Between Ages 25 and 34 in Massachusetts?
Lenox has the Highest Poverty Level Among Females Between Ages 25 and 34 in Massachusetts with 100.0%.
What is the Poverty Level Among Females Between Ages 25 and 34 in the State of Massachusetts?
Poverty Level Among Females Between Ages 25 and 34 in Massachusetts is 11.1%.
What is the Poverty Level Among Females Between Ages 25 and 34 in the United States?
Poverty Level Among Females Between Ages 25 and 34 in the United States is 14.5%.