Cities with the Highest Poverty Level Among Females Between Ages 25 and 34 in Illinois
RELATED REPORTS & OPTIONS
Highest Poverty | Female 25-34
Illinois
Compare Cities
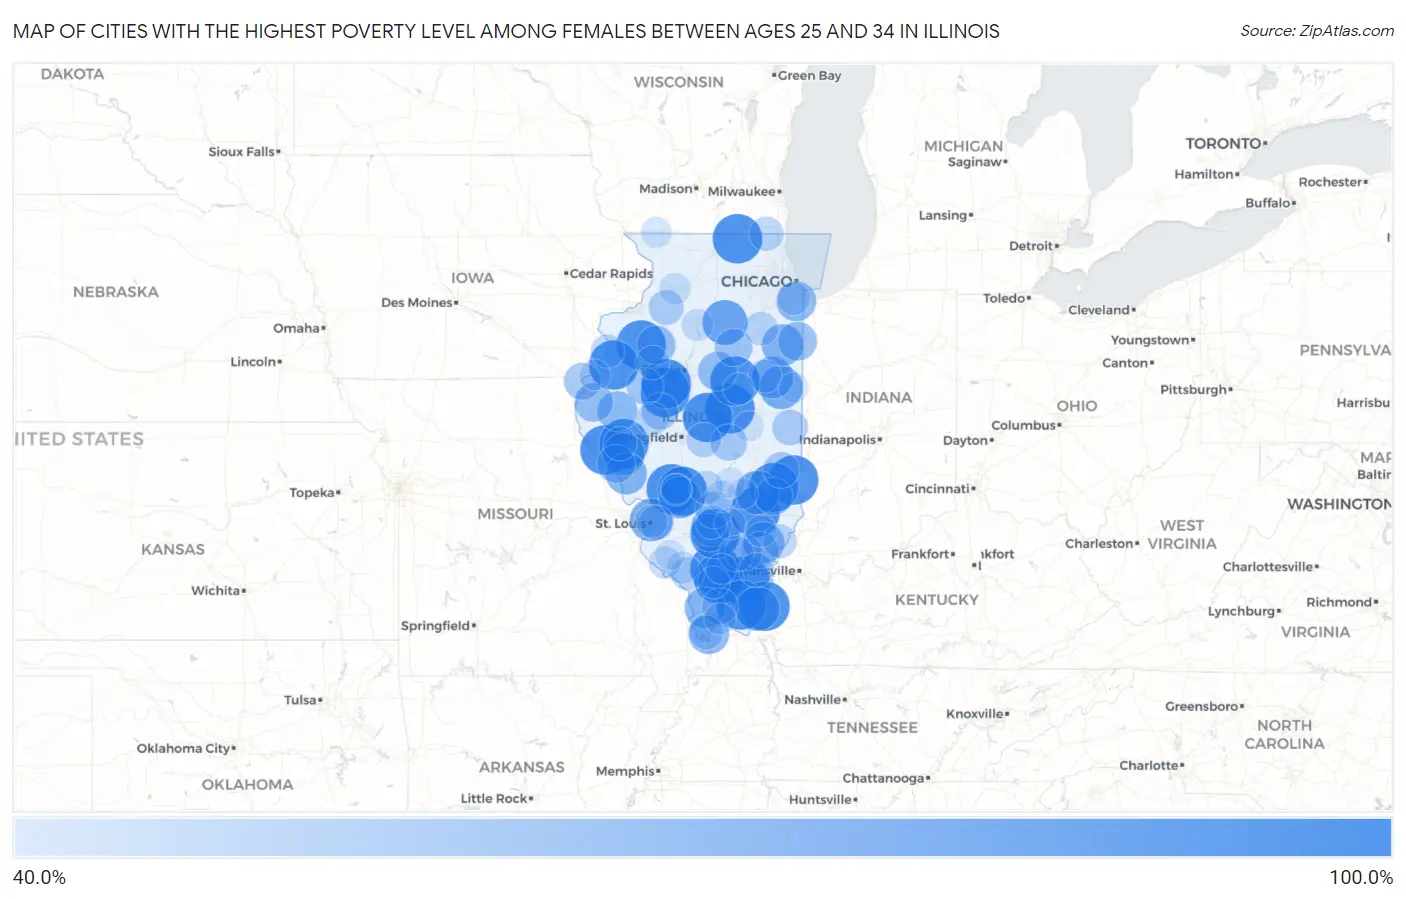
Map of Cities with the Highest Poverty Level Among Females Between Ages 25 and 34 in Illinois
0.0%
100.0%
Cities with the Highest Poverty Level Among Females Between Ages 25 and 34 in Illinois
| City | Female Poverty | vs State | vs National | |
| 1. | North City | 100.0% | 13.8%(+86.2)#1 | 14.5%(+85.5)#132 |
| 2. | Chemung | 100.0% | 13.8%(+86.2)#2 | 14.5%(+85.5)#230 |
| 3. | Mount Clare | 100.0% | 13.8%(+86.2)#3 | 14.5%(+85.5)#258 |
| 4. | Henderson | 100.0% | 13.8%(+86.2)#4 | 14.5%(+85.5)#312 |
| 5. | Raleigh | 100.0% | 13.8%(+86.2)#5 | 14.5%(+85.5)#325 |
| 6. | Freeman Spur | 100.0% | 13.8%(+86.2)#6 | 14.5%(+85.5)#349 |
| 7. | Goofy Ridge | 100.0% | 13.8%(+86.2)#7 | 14.5%(+85.5)#357 |
| 8. | West Union | 100.0% | 13.8%(+86.2)#8 | 14.5%(+85.5)#373 |
| 9. | Cave In Rock | 100.0% | 13.8%(+86.2)#9 | 14.5%(+85.5)#374 |
| 10. | De Witt | 100.0% | 13.8%(+86.2)#10 | 14.5%(+85.5)#380 |
| 11. | Chestnut | 100.0% | 13.8%(+86.2)#11 | 14.5%(+85.5)#406 |
| 12. | Banner | 100.0% | 13.8%(+86.2)#12 | 14.5%(+85.5)#432 |
| 13. | Walshville | 100.0% | 13.8%(+86.2)#13 | 14.5%(+85.5)#434 |
| 14. | Cooksville | 100.0% | 13.8%(+86.2)#14 | 14.5%(+85.5)#439 |
| 15. | El Dara | 100.0% | 13.8%(+86.2)#15 | 14.5%(+85.5)#478 |
| 16. | Walnut Hill | 100.0% | 13.8%(+86.2)#16 | 14.5%(+85.5)#497 |
| 17. | Media | 100.0% | 13.8%(+86.2)#17 | 14.5%(+85.5)#507 |
| 18. | Sailor Springs | 100.0% | 13.8%(+86.2)#18 | 14.5%(+85.5)#534 |
| 19. | Yale | 100.0% | 13.8%(+86.2)#19 | 14.5%(+85.5)#575 |
| 20. | Eddyville | 100.0% | 13.8%(+86.2)#20 | 14.5%(+85.5)#607 |
| 21. | Lorenzo | 100.0% | 13.8%(+86.2)#21 | 14.5%(+85.5)#623 |
| 22. | Valley City | 100.0% | 13.8%(+86.2)#22 | 14.5%(+85.5)#664 |
| 23. | Naplate | 88.2% | 13.8%(+74.4)#23 | 14.5%(+73.7)#759 |
| 24. | Elizabethtown | 85.7% | 13.8%(+71.9)#24 | 14.5%(+71.2)#797 |
| 25. | Wheeler | 84.6% | 13.8%(+70.8)#25 | 14.5%(+70.1)#826 |
| 26. | Rankin | 83.3% | 13.8%(+69.5)#26 | 14.5%(+68.8)#846 |
| 27. | Venice | 82.2% | 13.8%(+68.4)#27 | 14.5%(+67.7)#873 |
| 28. | Campbell's Island | 82.1% | 13.8%(+68.3)#28 | 14.5%(+67.6)#876 |
| 29. | Buckley | 80.0% | 13.8%(+66.2)#29 | 14.5%(+65.5)#922 |
| 30. | Milton | 80.0% | 13.8%(+66.2)#30 | 14.5%(+65.5)#927 |
| 31. | New Douglas | 79.2% | 13.8%(+65.4)#31 | 14.5%(+64.7)#953 |
| 32. | Sammons Point | 78.9% | 13.8%(+65.2)#32 | 14.5%(+64.5)#958 |
| 33. | Kampsville | 78.6% | 13.8%(+64.8)#33 | 14.5%(+64.1)#970 |
| 34. | Golden Gate | 77.8% | 13.8%(+64.0)#34 | 14.5%(+63.3)#994 |
| 35. | Anna | 77.1% | 13.8%(+63.3)#35 | 14.5%(+62.6)#1,007 |
| 36. | Mound City | 76.9% | 13.8%(+63.1)#36 | 14.5%(+62.4)#1,015 |
| 37. | Serena | 76.2% | 13.8%(+62.4)#37 | 14.5%(+61.7)#1,041 |
| 38. | Phoenix | 75.0% | 13.8%(+61.2)#38 | 14.5%(+60.5)#1,055 |
| 39. | Junction City | 75.0% | 13.8%(+61.2)#39 | 14.5%(+60.5)#1,060 |
| 40. | Camden | 75.0% | 13.8%(+61.2)#40 | 14.5%(+60.5)#1,083 |
| 41. | Kappa | 72.7% | 13.8%(+58.9)#41 | 14.5%(+58.2)#1,127 |
| 42. | Hopkins Park | 72.1% | 13.8%(+58.3)#42 | 14.5%(+57.6)#1,147 |
| 43. | Victoria | 71.4% | 13.8%(+57.6)#43 | 14.5%(+56.9)#1,170 |
| 44. | West Point | 71.4% | 13.8%(+57.6)#44 | 14.5%(+56.9)#1,172 |
| 45. | Wamac | 70.5% | 13.8%(+56.7)#45 | 14.5%(+56.0)#1,206 |
| 46. | Nebo | 70.4% | 13.8%(+56.6)#46 | 14.5%(+55.9)#1,211 |
| 47. | Willow Lake | 68.4% | 13.8%(+54.6)#47 | 14.5%(+53.9)#1,274 |
| 48. | Cornell | 68.2% | 13.8%(+54.4)#48 | 14.5%(+53.7)#1,292 |
| 49. | Willow Hill | 68.0% | 13.8%(+54.2)#49 | 14.5%(+53.5)#1,300 |
| 50. | Nauvoo | 67.5% | 13.8%(+53.7)#50 | 14.5%(+53.0)#1,315 |
| 51. | Kilbourne | 66.7% | 13.8%(+52.9)#51 | 14.5%(+52.2)#1,374 |
| 52. | Smithfield | 66.7% | 13.8%(+52.9)#52 | 14.5%(+52.2)#1,393 |
| 53. | Burnt Prairie | 66.7% | 13.8%(+52.9)#53 | 14.5%(+52.2)#1,409 |
| 54. | Vernon | 66.7% | 13.8%(+52.9)#54 | 14.5%(+52.2)#1,414 |
| 55. | Belle Prairie City | 66.7% | 13.8%(+52.9)#55 | 14.5%(+52.2)#1,423 |
| 56. | Dalton City | 66.0% | 13.8%(+52.2)#56 | 14.5%(+51.5)#1,442 |
| 57. | Buncombe | 65.4% | 13.8%(+51.6)#57 | 14.5%(+50.9)#1,465 |
| 58. | Martinsville | 65.0% | 13.8%(+51.2)#58 | 14.5%(+50.5)#1,476 |
| 59. | Indianola | 63.6% | 13.8%(+49.8)#59 | 14.5%(+49.1)#1,527 |
| 60. | Dahlgren | 63.3% | 13.8%(+49.5)#60 | 14.5%(+48.8)#1,539 |
| 61. | Dewey | 63.2% | 13.8%(+49.4)#61 | 14.5%(+48.7)#1,550 |
| 62. | Hooppole | 62.5% | 13.8%(+48.7)#62 | 14.5%(+48.0)#1,588 |
| 63. | Washington Park | 61.1% | 13.8%(+47.3)#63 | 14.5%(+46.6)#1,650 |
| 64. | Mount Auburn | 60.9% | 13.8%(+47.1)#64 | 14.5%(+46.4)#1,656 |
| 65. | Norris City | 60.7% | 13.8%(+46.9)#65 | 14.5%(+46.2)#1,664 |
| 66. | Channel Lake | 60.1% | 13.8%(+46.3)#66 | 14.5%(+45.6)#1,681 |
| 67. | Mounds | 60.0% | 13.8%(+46.2)#67 | 14.5%(+45.5)#1,687 |
| 68. | Godley | 58.8% | 13.8%(+45.0)#68 | 14.5%(+44.3)#1,781 |
| 69. | Bellmont | 58.8% | 13.8%(+45.0)#69 | 14.5%(+44.3)#1,785 |
| 70. | Maquon | 58.8% | 13.8%(+45.0)#70 | 14.5%(+44.3)#1,786 |
| 71. | Griggsville | 58.3% | 13.8%(+44.5)#71 | 14.5%(+43.8)#1,808 |
| 72. | Bingham | 58.3% | 13.8%(+44.5)#72 | 14.5%(+43.8)#1,825 |
| 73. | Oquawka | 58.2% | 13.8%(+44.4)#73 | 14.5%(+43.7)#1,829 |
| 74. | Chandlerville | 57.1% | 13.8%(+43.3)#74 | 14.5%(+42.6)#1,885 |
| 75. | Roberts | 57.1% | 13.8%(+43.3)#75 | 14.5%(+42.6)#1,890 |
| 76. | Campbell Hill | 57.1% | 13.8%(+43.3)#76 | 14.5%(+42.6)#1,894 |
| 77. | Dixmoor | 56.3% | 13.8%(+42.5)#77 | 14.5%(+41.8)#1,955 |
| 78. | Brooklyn | 56.1% | 13.8%(+42.3)#78 | 14.5%(+41.6)#1,973 |
| 79. | Evansville | 55.2% | 13.8%(+41.4)#79 | 14.5%(+40.7)#2,033 |
| 80. | Percy | 55.1% | 13.8%(+41.3)#80 | 14.5%(+40.6)#2,041 |
| 81. | Bureau Junction | 54.5% | 13.8%(+40.8)#81 | 14.5%(+40.1)#2,097 |
| 82. | Colp | 54.5% | 13.8%(+40.8)#82 | 14.5%(+40.1)#2,098 |
| 83. | Brownstown | 53.8% | 13.8%(+40.1)#83 | 14.5%(+39.4)#2,146 |
| 84. | Como | 53.7% | 13.8%(+39.9)#84 | 14.5%(+39.2)#2,164 |
| 85. | Edgington | 53.6% | 13.8%(+39.8)#85 | 14.5%(+39.1)#2,177 |
| 86. | Karnak | 53.3% | 13.8%(+39.5)#86 | 14.5%(+38.8)#2,191 |
| 87. | Mount Erie | 53.3% | 13.8%(+39.5)#87 | 14.5%(+38.8)#2,198 |
| 88. | Mount Olive | 52.4% | 13.8%(+38.6)#88 | 14.5%(+37.9)#2,267 |
| 89. | Iuka | 52.4% | 13.8%(+38.6)#89 | 14.5%(+37.9)#2,269 |
| 90. | Arrowsmith | 52.4% | 13.8%(+38.6)#90 | 14.5%(+37.9)#2,272 |
| 91. | Apple River | 52.2% | 13.8%(+38.4)#91 | 14.5%(+37.7)#2,280 |
| 92. | Dallas City | 51.4% | 13.8%(+37.6)#92 | 14.5%(+36.9)#2,332 |
| 93. | Watson | 51.4% | 13.8%(+37.6)#93 | 14.5%(+36.9)#2,333 |
| 94. | Sandoval | 50.6% | 13.8%(+36.9)#94 | 14.5%(+36.2)#2,374 |
| 95. | Hoopeston | 50.2% | 13.8%(+36.4)#95 | 14.5%(+35.7)#2,396 |
| 96. | West City | 50.0% | 13.8%(+36.2)#96 | 14.5%(+35.5)#2,443 |
| 97. | Beecher City | 50.0% | 13.8%(+36.2)#97 | 14.5%(+35.5)#2,459 |
| 98. | Baldwin | 50.0% | 13.8%(+36.2)#98 | 14.5%(+35.5)#2,470 |
| 99. | Lake Ka Ho | 50.0% | 13.8%(+36.2)#99 | 14.5%(+35.5)#2,487 |
| 100. | Ivesdale | 50.0% | 13.8%(+36.2)#100 | 14.5%(+35.5)#2,503 |
Common Questions
What are the Top 10 Cities with the Highest Poverty Level Among Females Between Ages 25 and 34 in Illinois?
Top 10 Cities with the Highest Poverty Level Among Females Between Ages 25 and 34 in Illinois are:
#1
100.0%
#2
100.0%
#3
100.0%
#4
100.0%
#5
100.0%
#6
100.0%
#7
100.0%
#8
100.0%
#9
100.0%
#10
100.0%
What city has the Highest Poverty Level Among Females Between Ages 25 and 34 in Illinois?
North City has the Highest Poverty Level Among Females Between Ages 25 and 34 in Illinois with 100.0%.
What is the Poverty Level Among Females Between Ages 25 and 34 in the State of Illinois?
Poverty Level Among Females Between Ages 25 and 34 in Illinois is 13.8%.
What is the Poverty Level Among Females Between Ages 25 and 34 in the United States?
Poverty Level Among Females Between Ages 25 and 34 in the United States is 14.5%.