Cities with the Highest Poverty Level Among Females Between Ages 25 and 34 in Maryland
RELATED REPORTS & OPTIONS
Highest Poverty | Female 25-34
Maryland
Compare Cities
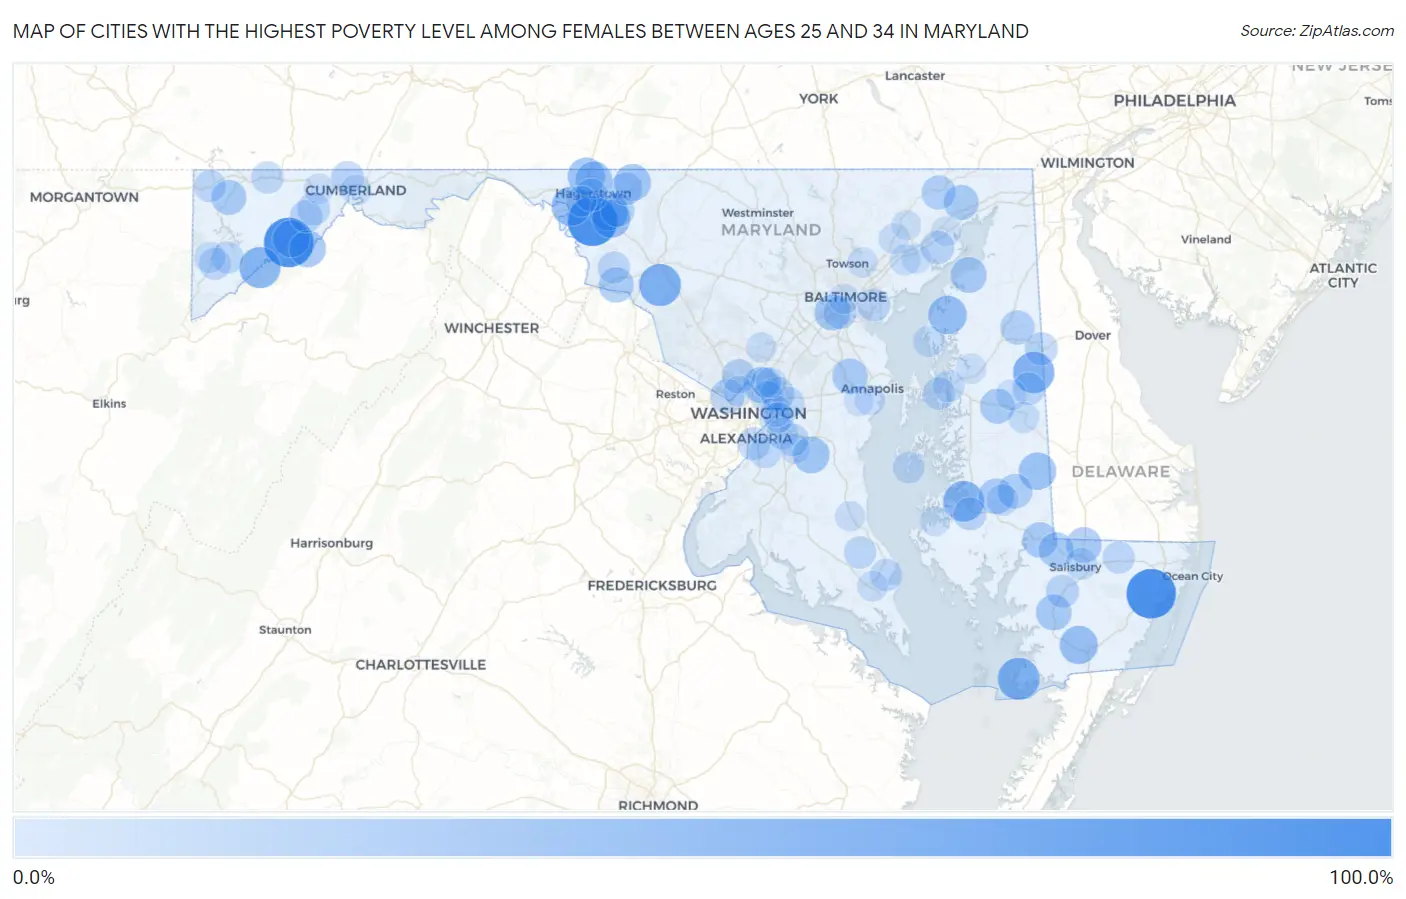
Map of Cities with the Highest Poverty Level Among Females Between Ages 25 and 34 in Maryland
0.0%
100.0%
Cities with the Highest Poverty Level Among Females Between Ages 25 and 34 in Maryland
| City | Female Poverty | vs State | vs National | |
| 1. | Crumpton | 100.0% | 10.8%(+89.2)#1 | 14.5%(+85.5)#246 |
| 2. | Newark | 100.0% | 10.8%(+89.2)#2 | 14.5%(+85.5)#299 |
| 3. | Breathedsville | 100.0% | 10.8%(+89.2)#3 | 14.5%(+85.5)#354 |
| 4. | Luke | 100.0% | 10.8%(+89.2)#4 | 14.5%(+85.5)#554 |
| 5. | Buckeystown | 66.7% | 10.8%(+55.8)#5 | 14.5%(+52.2)#1,343 |
| 6. | Crisfield | 66.0% | 10.8%(+55.2)#6 | 14.5%(+51.5)#1,440 |
| 7. | Goldsboro | 63.6% | 10.8%(+52.8)#7 | 14.5%(+49.1)#1,526 |
| 8. | Kitzmiller | 62.5% | 10.8%(+51.7)#8 | 14.5%(+48.0)#1,585 |
| 9. | Algonquin | 60.9% | 10.8%(+50.0)#9 | 14.5%(+46.4)#1,655 |
| 10. | Williamsport | 54.5% | 10.8%(+43.7)#10 | 14.5%(+40.1)#2,082 |
| 11. | Fairlee | 51.5% | 10.8%(+40.7)#11 | 14.5%(+37.0)#2,327 |
| 12. | Beaver Creek | 50.9% | 10.8%(+40.1)#12 | 14.5%(+36.4)#2,360 |
| 13. | West Pocomoke | 50.0% | 10.8%(+39.2)#13 | 14.5%(+35.5)#2,449 |
| 14. | San Mar | 50.0% | 10.8%(+39.2)#14 | 14.5%(+35.5)#2,472 |
| 15. | Federalsburg | 46.5% | 10.8%(+35.7)#15 | 14.5%(+32.0)#2,873 |
| 16. | Maugansville | 46.2% | 10.8%(+35.3)#16 | 14.5%(+31.7)#2,897 |
| 17. | Westernport | 45.8% | 10.8%(+35.0)#17 | 14.5%(+31.3)#2,946 |
| 18. | Fountainhead Orchard Hills | 44.8% | 10.8%(+34.0)#18 | 14.5%(+30.3)#3,058 |
| 19. | Edgemont | 44.4% | 10.8%(+33.6)#19 | 14.5%(+30.0)#3,127 |
| 20. | Mccoole | 43.8% | 10.8%(+32.9)#20 | 14.5%(+29.3)#3,202 |
| 21. | Croom | 42.9% | 10.8%(+32.0)#21 | 14.5%(+28.4)#3,288 |
| 22. | Langley Park | 41.0% | 10.8%(+30.2)#22 | 14.5%(+26.5)#3,554 |
| 23. | Lansdowne | 40.7% | 10.8%(+29.9)#23 | 14.5%(+26.2)#3,603 |
| 24. | Betterton | 40.0% | 10.8%(+29.2)#24 | 14.5%(+25.5)#3,720 |
| 25. | Princess Anne | 39.6% | 10.8%(+28.8)#25 | 14.5%(+25.2)#3,800 |
| 26. | Delmar | 38.8% | 10.8%(+27.9)#26 | 14.5%(+24.3)#3,936 |
| 27. | Secretary | 38.1% | 10.8%(+27.3)#27 | 14.5%(+23.6)#4,031 |
| 28. | Mardela Springs | 38.1% | 10.8%(+27.3)#28 | 14.5%(+23.6)#4,035 |
| 29. | Crownsville | 37.8% | 10.8%(+27.0)#29 | 14.5%(+23.3)#4,080 |
| 30. | Hebron | 37.5% | 10.8%(+26.7)#30 | 14.5%(+23.0)#4,109 |
| 31. | Rosemont | 37.5% | 10.8%(+26.7)#31 | 14.5%(+23.0)#4,136 |
| 32. | Port Deposit | 36.7% | 10.8%(+25.9)#32 | 14.5%(+22.2)#4,254 |
| 33. | Accident | 36.6% | 10.8%(+25.8)#33 | 14.5%(+22.1)#4,287 |
| 34. | Hillsboro | 36.4% | 10.8%(+25.5)#34 | 14.5%(+21.9)#4,343 |
| 35. | Hurlock | 35.6% | 10.8%(+24.8)#35 | 14.5%(+21.1)#4,465 |
| 36. | Brookmont | 33.3% | 10.8%(+22.5)#36 | 14.5%(+18.8)#4,835 |
| 37. | Chevy Chase View | 33.3% | 10.8%(+22.5)#37 | 14.5%(+18.8)#4,862 |
| 38. | Darlington | 33.3% | 10.8%(+22.5)#38 | 14.5%(+18.8)#4,915 |
| 39. | Sudlersville | 33.3% | 10.8%(+22.5)#39 | 14.5%(+18.8)#4,937 |
| 40. | Bagtown | 31.7% | 10.8%(+20.9)#40 | 14.5%(+17.2)#5,293 |
| 41. | East Riverdale | 30.9% | 10.8%(+20.1)#41 | 14.5%(+16.4)#5,465 |
| 42. | Perryman | 30.0% | 10.8%(+19.1)#42 | 14.5%(+15.5)#5,684 |
| 43. | Marydel | 28.6% | 10.8%(+17.7)#43 | 14.5%(+14.1)#6,071 |
| 44. | Baltimore Highlands | 28.5% | 10.8%(+17.7)#44 | 14.5%(+14.0)#6,088 |
| 45. | Eden | 28.1% | 10.8%(+17.3)#45 | 14.5%(+13.6)#6,175 |
| 46. | Hagerstown | 28.0% | 10.8%(+17.2)#46 | 14.5%(+13.5)#6,206 |
| 47. | Smithsburg | 27.8% | 10.8%(+17.0)#47 | 14.5%(+13.3)#6,246 |
| 48. | National Harbor | 27.5% | 10.8%(+16.7)#48 | 14.5%(+13.0)#6,324 |
| 49. | Dundalk | 27.5% | 10.8%(+16.7)#49 | 14.5%(+13.0)#6,334 |
| 50. | Midland | 27.4% | 10.8%(+16.6)#50 | 14.5%(+12.9)#6,350 |
| 51. | Cambridge | 27.3% | 10.8%(+16.5)#51 | 14.5%(+12.8)#6,370 |
| 52. | Corriganville | 27.3% | 10.8%(+16.4)#52 | 14.5%(+12.8)#6,395 |
| 53. | Lonaconing | 27.2% | 10.8%(+16.4)#53 | 14.5%(+12.7)#6,439 |
| 54. | Melwood | 26.8% | 10.8%(+16.0)#54 | 14.5%(+12.3)#6,521 |
| 55. | Greensboro | 26.8% | 10.8%(+16.0)#55 | 14.5%(+12.3)#6,527 |
| 56. | Brentwood | 26.0% | 10.8%(+15.2)#56 | 14.5%(+11.5)#6,740 |
| 57. | Drum Point | 25.6% | 10.8%(+14.8)#57 | 14.5%(+11.1)#6,839 |
| 58. | Grasonville | 25.6% | 10.8%(+14.8)#58 | 14.5%(+11.1)#6,858 |
| 59. | Broomes Island | 25.4% | 10.8%(+14.6)#59 | 14.5%(+10.9)#6,922 |
| 60. | Grantsville | 25.0% | 10.8%(+14.2)#60 | 14.5%(+10.5)#7,037 |
| 61. | Friendsville | 25.0% | 10.8%(+14.2)#61 | 14.5%(+10.5)#7,075 |
| 62. | Deer Park | 25.0% | 10.8%(+14.2)#62 | 14.5%(+10.5)#7,092 |
| 63. | Burkittsville | 25.0% | 10.8%(+14.2)#63 | 14.5%(+10.5)#7,150 |
| 64. | Pittsville | 24.7% | 10.8%(+13.9)#64 | 14.5%(+10.2)#7,219 |
| 65. | Mountain Lake Park | 24.3% | 10.8%(+13.4)#65 | 14.5%(+9.78)#7,329 |
| 66. | Queenstown | 23.5% | 10.8%(+12.7)#66 | 14.5%(+9.04)#7,561 |
| 67. | Coral Hills | 23.5% | 10.8%(+12.7)#67 | 14.5%(+9.02)#7,582 |
| 68. | Salisbury | 23.2% | 10.8%(+12.3)#68 | 14.5%(+8.66)#7,695 |
| 69. | Tilghman Island | 23.1% | 10.8%(+12.3)#69 | 14.5%(+8.58)#7,726 |
| 70. | Friendly | 22.7% | 10.8%(+11.9)#70 | 14.5%(+8.23)#7,847 |
| 71. | East New Market | 22.7% | 10.8%(+11.9)#71 | 14.5%(+8.23)#7,862 |
| 72. | Morningside | 22.5% | 10.8%(+11.7)#72 | 14.5%(+8.01)#7,937 |
| 73. | Glenarden | 22.4% | 10.8%(+11.6)#73 | 14.5%(+7.96)#7,952 |
| 74. | Fairmount Heights | 21.7% | 10.8%(+10.9)#74 | 14.5%(+7.20)#8,249 |
| 75. | Rock Hall | 21.4% | 10.8%(+10.6)#75 | 14.5%(+6.93)#8,336 |
| 76. | Oakland | 21.1% | 10.8%(+10.3)#76 | 14.5%(+6.65)#8,447 |
| 77. | Denton | 19.9% | 10.8%(+9.11)#77 | 14.5%(+5.44)#8,994 |
| 78. | Ridgely | 19.4% | 10.8%(+8.62)#78 | 14.5%(+4.95)#9,137 |
| 79. | Joppatowne | 19.4% | 10.8%(+8.57)#79 | 14.5%(+4.90)#9,156 |
| 80. | California | 18.8% | 10.8%(+8.02)#80 | 14.5%(+4.35)#9,383 |
| 81. | Chevy Chase Village | 18.8% | 10.8%(+7.93)#81 | 14.5%(+4.26)#9,414 |
| 82. | Cumberland | 18.4% | 10.8%(+7.53)#82 | 14.5%(+3.86)#9,597 |
| 83. | Halfway | 18.3% | 10.8%(+7.52)#83 | 14.5%(+3.85)#9,601 |
| 84. | College Park | 18.3% | 10.8%(+7.51)#84 | 14.5%(+3.84)#9,608 |
| 85. | Pleasant Hills | 18.3% | 10.8%(+7.46)#85 | 14.5%(+3.79)#9,618 |
| 86. | Adelphi | 18.3% | 10.8%(+7.45)#86 | 14.5%(+3.78)#9,622 |
| 87. | Frostburg | 18.0% | 10.8%(+7.18)#87 | 14.5%(+3.51)#9,777 |
| 88. | Centreville | 17.9% | 10.8%(+7.03)#88 | 14.5%(+3.36)#9,830 |
| 89. | Carney | 17.8% | 10.8%(+7.01)#89 | 14.5%(+3.34)#9,851 |
| 90. | Annapolis Neck | 17.7% | 10.8%(+6.88)#90 | 14.5%(+3.21)#9,900 |
| 91. | Capitol Heights | 17.5% | 10.8%(+6.69)#91 | 14.5%(+3.02)#9,986 |
| 92. | Baltimore | 17.4% | 10.8%(+6.53)#92 | 14.5%(+2.86)#10,057 |
| 93. | Spencerville | 17.3% | 10.8%(+6.51)#93 | 14.5%(+2.84)#10,066 |
| 94. | Prince Frederick | 17.0% | 10.8%(+6.14)#94 | 14.5%(+2.47)#10,223 |
| 95. | Edgewood | 16.7% | 10.8%(+5.87)#95 | 14.5%(+2.20)#10,291 |
| 96. | Aberdeen | 16.3% | 10.8%(+5.46)#96 | 14.5%(+1.79)#10,521 |
| 97. | Edgewater | 16.3% | 10.8%(+5.45)#97 | 14.5%(+1.78)#10,533 |
| 98. | Madison | 16.2% | 10.8%(+5.39)#98 | 14.5%(+1.72)#10,562 |
| 99. | Bel Air | 16.2% | 10.8%(+5.35)#99 | 14.5%(+1.68)#10,574 |
| 100. | Rosaryville | 16.1% | 10.8%(+5.23)#100 | 14.5%(+1.56)#10,621 |
Common Questions
What are the Top 10 Cities with the Highest Poverty Level Among Females Between Ages 25 and 34 in Maryland?
Top 10 Cities with the Highest Poverty Level Among Females Between Ages 25 and 34 in Maryland are:
#1
100.0%
#2
100.0%
#3
100.0%
#4
66.7%
#5
66.0%
#6
63.6%
#7
62.5%
#8
60.9%
#9
54.5%
#10
51.5%
What city has the Highest Poverty Level Among Females Between Ages 25 and 34 in Maryland?
Newark has the Highest Poverty Level Among Females Between Ages 25 and 34 in Maryland with 100.0%.
What is the Poverty Level Among Females Between Ages 25 and 34 in the State of Maryland?
Poverty Level Among Females Between Ages 25 and 34 in Maryland is 10.8%.
What is the Poverty Level Among Females Between Ages 25 and 34 in the United States?
Poverty Level Among Females Between Ages 25 and 34 in the United States is 14.5%.