Cities with the Highest Poverty Level Among Females Between Ages 25 and 34 in Iowa
RELATED REPORTS & OPTIONS
Highest Poverty | Female 25-34
Iowa
Compare Cities
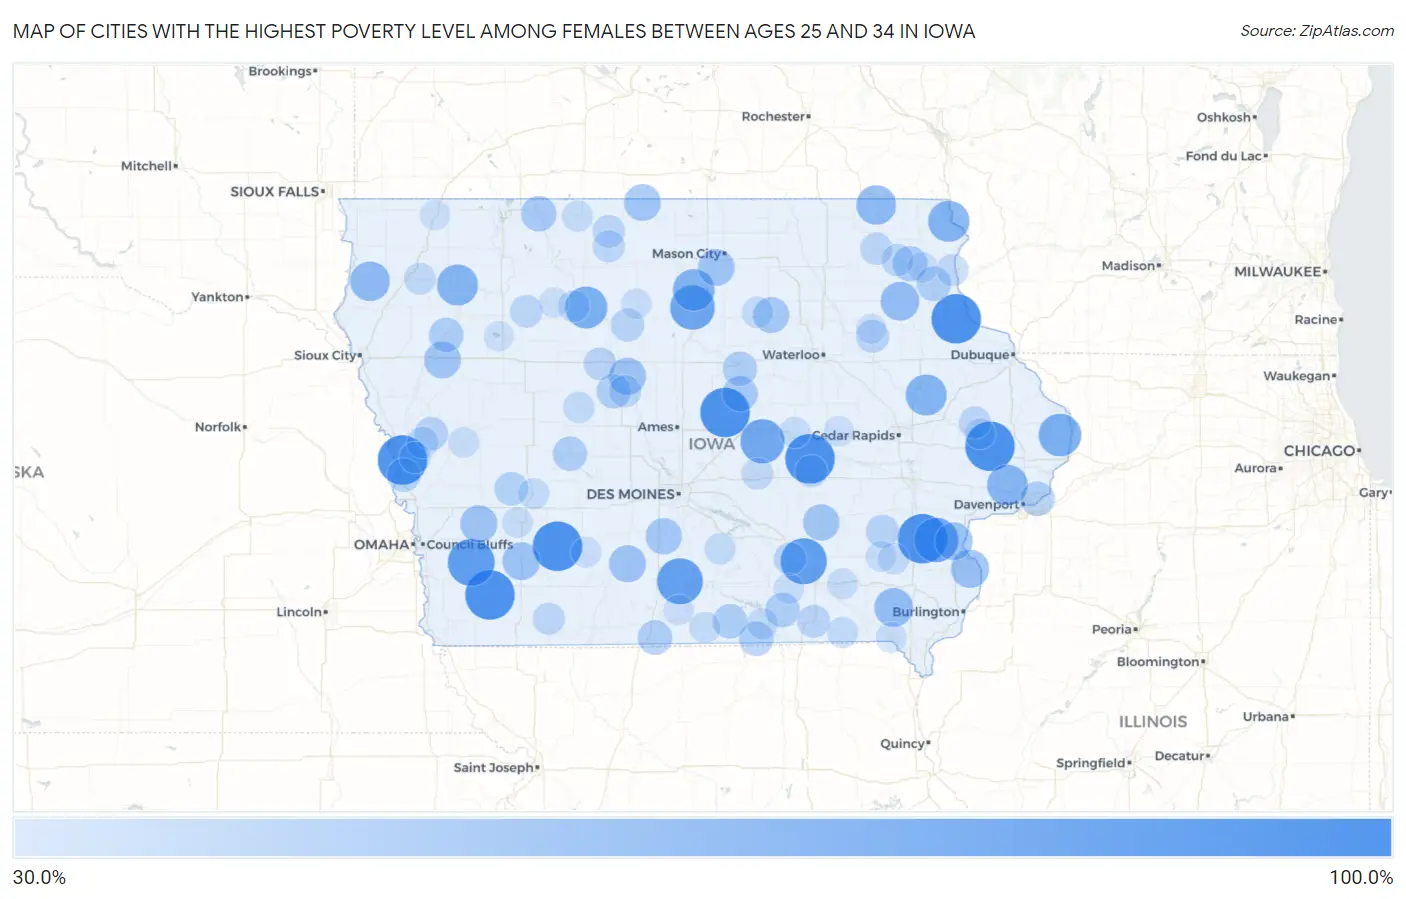
Map of Cities with the Highest Poverty Level Among Females Between Ages 25 and 34 in Iowa
0.0%
100.0%
Cities with the Highest Poverty Level Among Females Between Ages 25 and 34 in Iowa
| City | Female Poverty | vs State | vs National | |
| 1. | Holiday Lake | 100.0% | 13.6%(+86.4)#1 | 14.5%(+85.5)#240 |
| 2. | Little Sioux | 100.0% | 13.6%(+86.4)#2 | 14.5%(+85.5)#390 |
| 3. | Osterdock | 100.0% | 13.6%(+86.4)#3 | 14.5%(+85.5)#433 |
| 4. | Bridgewater | 100.0% | 13.6%(+86.4)#4 | 14.5%(+85.5)#510 |
| 5. | St Anthony | 100.0% | 13.6%(+86.4)#5 | 14.5%(+85.5)#569 |
| 6. | Toronto | 100.0% | 13.6%(+86.4)#6 | 14.5%(+85.5)#588 |
| 7. | Coburg | 100.0% | 13.6%(+86.4)#7 | 14.5%(+85.5)#651 |
| 8. | Cotter | 100.0% | 13.6%(+86.4)#8 | 14.5%(+85.5)#689 |
| 9. | Henderson | 90.9% | 13.6%(+77.4)#9 | 14.5%(+76.4)#731 |
| 10. | Kirkville | 88.9% | 13.6%(+75.3)#10 | 14.5%(+74.4)#751 |
| 11. | Woodburn | 87.5% | 13.6%(+73.9)#11 | 14.5%(+73.0)#777 |
| 12. | Alexander | 83.3% | 13.6%(+69.8)#12 | 14.5%(+68.8)#856 |
| 13. | Fredonia | 82.5% | 13.6%(+68.9)#13 | 14.5%(+68.0)#869 |
| 14. | Ferguson | 81.8% | 13.6%(+68.3)#14 | 14.5%(+67.3)#886 |
| 15. | Andover | 76.9% | 13.6%(+63.4)#15 | 14.5%(+62.4)#1,023 |
| 16. | Bradgate | 75.0% | 13.6%(+61.4)#16 | 14.5%(+60.5)#1,077 |
| 17. | Meservey | 73.7% | 13.6%(+60.1)#17 | 14.5%(+59.2)#1,102 |
| 18. | Lansing | 71.8% | 13.6%(+58.2)#18 | 14.5%(+57.3)#1,154 |
| 19. | Prairieburg | 71.4% | 13.6%(+57.9)#19 | 14.5%(+56.9)#1,175 |
| 20. | Calumet | 71.4% | 13.6%(+57.9)#20 | 14.5%(+56.9)#1,176 |
| 21. | Maysville | 70.6% | 13.6%(+57.0)#21 | 14.5%(+56.1)#1,201 |
| 22. | Ireton | 66.7% | 13.6%(+53.1)#22 | 14.5%(+52.2)#1,353 |
| 23. | Burr Oak | 66.7% | 13.6%(+53.1)#23 | 14.5%(+52.2)#1,381 |
| 24. | Wadena | 63.6% | 13.6%(+50.1)#24 | 14.5%(+49.1)#1,525 |
| 25. | Hillsboro | 63.6% | 13.6%(+50.1)#25 | 14.5%(+49.1)#1,530 |
| 26. | Oakville | 61.5% | 13.6%(+48.0)#26 | 14.5%(+47.0)#1,635 |
| 27. | Grandview | 60.0% | 13.6%(+46.4)#27 | 14.5%(+45.5)#1,693 |
| 28. | Grant | 60.0% | 13.6%(+46.4)#28 | 14.5%(+45.5)#1,726 |
| 29. | Lehigh | 58.3% | 13.6%(+44.8)#29 | 14.5%(+43.8)#1,814 |
| 30. | Lorimor | 58.3% | 13.6%(+44.8)#30 | 14.5%(+43.8)#1,816 |
| 31. | Hancock | 58.3% | 13.6%(+44.8)#31 | 14.5%(+43.8)#1,819 |
| 32. | Cushing | 57.1% | 13.6%(+43.6)#32 | 14.5%(+42.6)#1,902 |
| 33. | Rake | 57.1% | 13.6%(+43.6)#33 | 14.5%(+42.6)#1,907 |
| 34. | Burchinal | 57.1% | 13.6%(+43.6)#34 | 14.5%(+42.6)#1,913 |
| 35. | What Cheer | 56.0% | 13.6%(+42.4)#35 | 14.5%(+41.5)#1,975 |
| 36. | St Marys | 55.6% | 13.6%(+42.0)#36 | 14.5%(+41.1)#2,010 |
| 37. | Allison | 54.7% | 13.6%(+41.2)#37 | 14.5%(+40.2)#2,075 |
| 38. | Union | 52.9% | 13.6%(+39.4)#38 | 14.5%(+38.4)#2,227 |
| 39. | Estherville | 52.8% | 13.6%(+39.2)#39 | 14.5%(+38.3)#2,238 |
| 40. | Postville | 52.2% | 13.6%(+38.7)#40 | 14.5%(+37.7)#2,277 |
| 41. | Farmersburg | 50.0% | 13.6%(+36.4)#41 | 14.5%(+35.5)#2,466 |
| 42. | Bayard | 50.0% | 13.6%(+36.4)#42 | 14.5%(+35.5)#2,469 |
| 43. | Quimby | 50.0% | 13.6%(+36.4)#43 | 14.5%(+35.5)#2,477 |
| 44. | Steamboat Rock | 50.0% | 13.6%(+36.4)#44 | 14.5%(+35.5)#2,506 |
| 45. | Cincinnati | 50.0% | 13.6%(+36.4)#45 | 14.5%(+35.5)#2,513 |
| 46. | Davis City | 50.0% | 13.6%(+36.4)#46 | 14.5%(+35.5)#2,516 |
| 47. | Harcourt | 50.0% | 13.6%(+36.4)#47 | 14.5%(+35.5)#2,522 |
| 48. | Panorama Park | 50.0% | 13.6%(+36.4)#48 | 14.5%(+35.5)#2,554 |
| 49. | Unionville | 50.0% | 13.6%(+36.4)#49 | 14.5%(+35.5)#2,564 |
| 50. | Promise City | 50.0% | 13.6%(+36.4)#50 | 14.5%(+35.5)#2,580 |
| 51. | Mondamin | 47.4% | 13.6%(+33.8)#51 | 14.5%(+32.9)#2,773 |
| 52. | Kimballton | 47.4% | 13.6%(+33.8)#52 | 14.5%(+32.9)#2,780 |
| 53. | Soldier | 46.7% | 13.6%(+33.1)#53 | 14.5%(+32.2)#2,864 |
| 54. | Thor | 46.2% | 13.6%(+32.6)#54 | 14.5%(+31.7)#2,923 |
| 55. | Hazleton | 45.8% | 13.6%(+32.3)#55 | 14.5%(+31.3)#2,950 |
| 56. | West Chester | 45.5% | 13.6%(+31.9)#56 | 14.5%(+31.0)#2,996 |
| 57. | Moorland | 44.4% | 13.6%(+30.9)#57 | 14.5%(+30.0)#3,130 |
| 58. | Bloomfield | 44.3% | 13.6%(+30.7)#58 | 14.5%(+29.8)#3,143 |
| 59. | Eddyville | 44.0% | 13.6%(+30.5)#59 | 14.5%(+29.5)#3,160 |
| 60. | Albert City | 43.8% | 13.6%(+30.2)#60 | 14.5%(+29.3)#3,190 |
| 61. | Bancroft | 43.3% | 13.6%(+29.8)#61 | 14.5%(+28.8)#3,250 |
| 62. | Calmar | 43.2% | 13.6%(+29.7)#62 | 14.5%(+28.7)#3,261 |
| 63. | Brooklyn | 43.0% | 13.6%(+29.4)#63 | 14.5%(+28.5)#3,282 |
| 64. | Dayton | 42.9% | 13.6%(+29.3)#64 | 14.5%(+28.4)#3,295 |
| 65. | Wyoming | 42.9% | 13.6%(+29.3)#65 | 14.5%(+28.4)#3,302 |
| 66. | Gravity | 42.9% | 13.6%(+29.3)#66 | 14.5%(+28.4)#3,332 |
| 67. | Castalia | 42.9% | 13.6%(+29.3)#67 | 14.5%(+28.4)#3,336 |
| 68. | Burt | 42.4% | 13.6%(+28.9)#68 | 14.5%(+27.9)#3,374 |
| 69. | Granville | 41.7% | 13.6%(+28.1)#69 | 14.5%(+27.2)#3,466 |
| 70. | Marquette | 41.5% | 13.6%(+27.9)#70 | 14.5%(+27.0)#3,495 |
| 71. | Rolfe | 41.2% | 13.6%(+27.6)#71 | 14.5%(+26.7)#3,532 |
| 72. | Kellogg | 41.2% | 13.6%(+27.6)#72 | 14.5%(+26.7)#3,533 |
| 73. | Moorhead | 40.9% | 13.6%(+27.4)#73 | 14.5%(+26.4)#3,581 |
| 74. | Melcher Dallas | 40.7% | 13.6%(+27.2)#74 | 14.5%(+26.2)#3,592 |
| 75. | Centerville | 40.0% | 13.6%(+26.4)#75 | 14.5%(+25.5)#3,679 |
| 76. | Churdan | 40.0% | 13.6%(+26.4)#76 | 14.5%(+25.5)#3,708 |
| 77. | Pisgah | 40.0% | 13.6%(+26.4)#77 | 14.5%(+25.5)#3,734 |
| 78. | Bristow | 40.0% | 13.6%(+26.4)#78 | 14.5%(+25.5)#3,750 |
| 79. | Coppock | 40.0% | 13.6%(+26.4)#79 | 14.5%(+25.5)#3,774 |
| 80. | Exira | 39.4% | 13.6%(+25.8)#80 | 14.5%(+24.9)#3,832 |
| 81. | Armstrong | 39.4% | 13.6%(+25.8)#81 | 14.5%(+24.9)#3,833 |
| 82. | Allerton | 39.3% | 13.6%(+25.7)#82 | 14.5%(+24.8)#3,849 |
| 83. | Oxford Junction | 38.9% | 13.6%(+25.3)#83 | 14.5%(+24.4)#3,914 |
| 84. | Milton | 38.9% | 13.6%(+25.3)#84 | 14.5%(+24.4)#3,915 |
| 85. | Toledo | 38.8% | 13.6%(+25.2)#85 | 14.5%(+24.3)#3,932 |
| 86. | Dow City | 38.5% | 13.6%(+24.9)#86 | 14.5%(+24.0)#3,973 |
| 87. | Brighton | 38.3% | 13.6%(+24.7)#87 | 14.5%(+23.8)#4,003 |
| 88. | Atlantic | 38.1% | 13.6%(+24.6)#88 | 14.5%(+23.6)#4,024 |
| 89. | Batavia | 38.1% | 13.6%(+24.5)#89 | 14.5%(+23.6)#4,032 |
| 90. | Farmington | 37.5% | 13.6%(+23.9)#90 | 14.5%(+23.0)#4,119 |
| 91. | Orient | 37.5% | 13.6%(+23.9)#91 | 14.5%(+23.0)#4,126 |
| 92. | Renwick | 37.5% | 13.6%(+23.9)#92 | 14.5%(+23.0)#4,140 |
| 93. | Luana | 37.5% | 13.6%(+23.9)#93 | 14.5%(+23.0)#4,143 |
| 94. | Garden Grove | 37.5% | 13.6%(+23.9)#94 | 14.5%(+23.0)#4,149 |
| 95. | Keystone | 36.9% | 13.6%(+23.3)#95 | 14.5%(+22.4)#4,226 |
| 96. | Blakesburg | 36.8% | 13.6%(+23.3)#96 | 14.5%(+22.3)#4,243 |
| 97. | Havelock | 36.4% | 13.6%(+22.8)#97 | 14.5%(+21.9)#4,340 |
| 98. | Sibley | 36.3% | 13.6%(+22.7)#98 | 14.5%(+21.8)#4,350 |
| 99. | Lakeside | 36.2% | 13.6%(+22.7)#99 | 14.5%(+21.7)#4,369 |
| 100. | Oelwein | 36.1% | 13.6%(+22.5)#100 | 14.5%(+21.6)#4,389 |
Common Questions
What are the Top 10 Cities with the Highest Poverty Level Among Females Between Ages 25 and 34 in Iowa?
Top 10 Cities with the Highest Poverty Level Among Females Between Ages 25 and 34 in Iowa are:
#1
100.0%
#2
100.0%
#3
100.0%
#4
100.0%
#5
100.0%
#6
100.0%
#7
100.0%
#8
100.0%
#9
90.9%
#10
88.9%
What city has the Highest Poverty Level Among Females Between Ages 25 and 34 in Iowa?
Holiday Lake has the Highest Poverty Level Among Females Between Ages 25 and 34 in Iowa with 100.0%.
What is the Poverty Level Among Females Between Ages 25 and 34 in the State of Iowa?
Poverty Level Among Females Between Ages 25 and 34 in Iowa is 13.6%.
What is the Poverty Level Among Females Between Ages 25 and 34 in the United States?
Poverty Level Among Females Between Ages 25 and 34 in the United States is 14.5%.