Cities with the Largest Sri Lankan Community in Kentucky
RELATED REPORTS & OPTIONS
Sri Lankan
Kentucky
Compare Cities
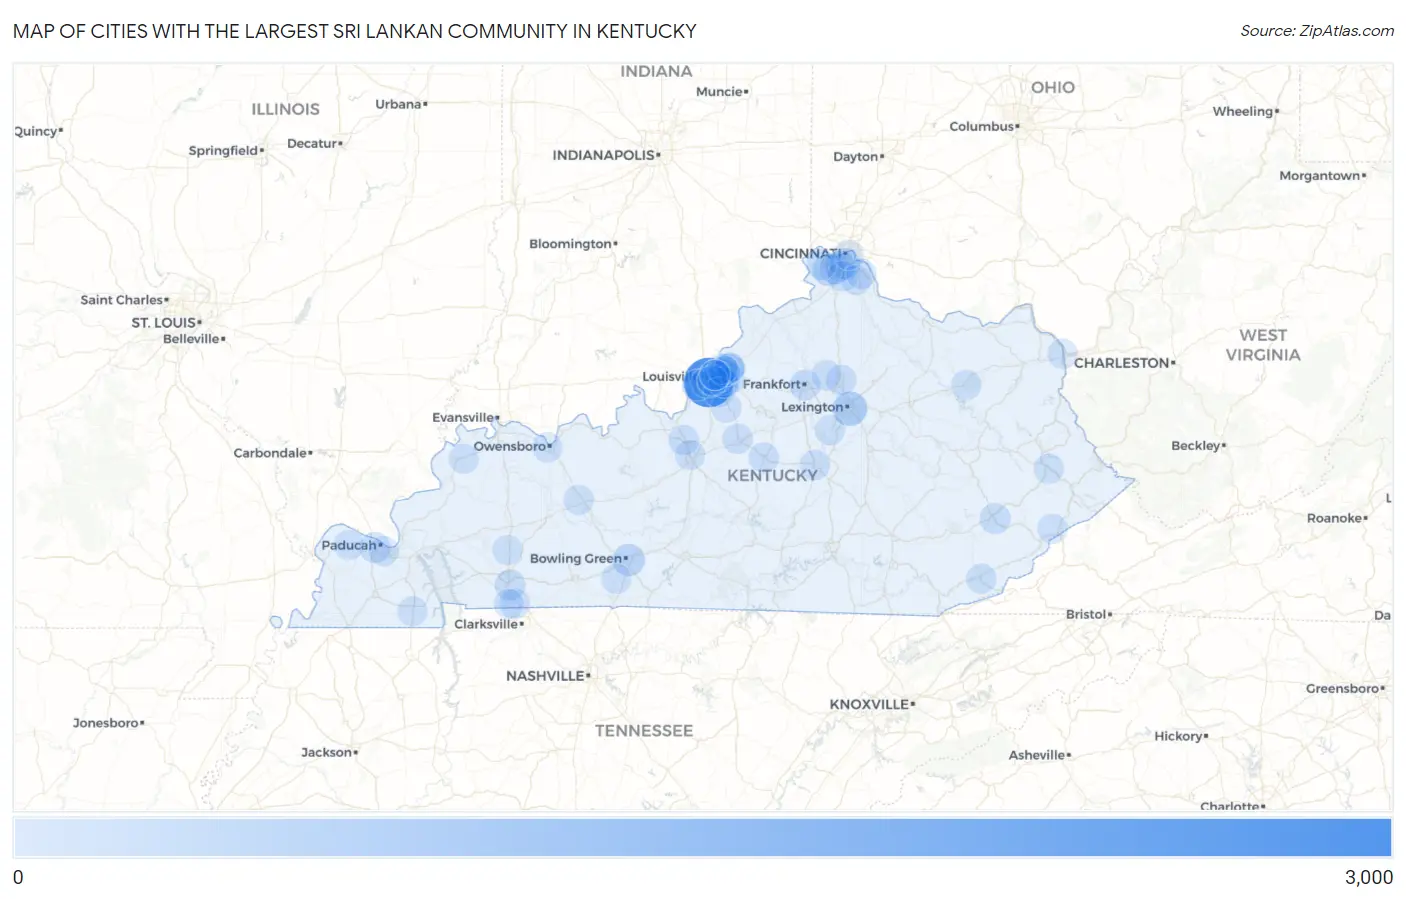
Map of Cities with the Largest Sri Lankan Community in Kentucky
0
3,000
Cities with the Largest Sri Lankan Community in Kentucky
| City | Sri Lankan | vs State | vs National | |
| 1. | Louisville | 2,919 | 6,823(42.78%)#1 | 2,246,463(0.13%)#98 |
| 2. | Lexington | 626 | 6,823(9.17%)#2 | 2,246,463(0.03%)#486 |
| 3. | Bowling Green | 306 | 6,823(4.48%)#3 | 2,246,463(0.01%)#889 |
| 4. | Florence | 278 | 6,823(4.07%)#4 | 2,246,463(0.01%)#976 |
| 5. | Elsmere | 154 | 6,823(2.26%)#5 | 2,246,463(0.01%)#1,475 |
| 6. | Covington | 153 | 6,823(2.24%)#6 | 2,246,463(0.01%)#1,477 |
| 7. | Hazard | 120 | 6,823(1.76%)#7 | 2,246,463(0.01%)#1,746 |
| 8. | Shively | 113 | 6,823(1.66%)#8 | 2,246,463(0.01%)#1,806 |
| 9. | Frankfort | 106 | 6,823(1.55%)#9 | 2,246,463(0.00%)#1,866 |
| 10. | Paducah | 102 | 6,823(1.49%)#10 | 2,246,463(0.00%)#1,900 |
| 11. | Hopkinsville | 88 | 6,823(1.29%)#11 | 2,246,463(0.00%)#2,075 |
| 12. | Lyndon | 84 | 6,823(1.23%)#12 | 2,246,463(0.00%)#2,129 |
| 13. | Oak Grove | 72 | 6,823(1.06%)#13 | 2,246,463(0.00%)#2,330 |
| 14. | Middletown | 70 | 6,823(1.03%)#14 | 2,246,463(0.00%)#2,375 |
| 15. | Jeffersontown | 67 | 6,823(0.98%)#15 | 2,246,463(0.00%)#2,416 |
| 16. | Bardstown | 59 | 6,823(0.86%)#16 | 2,246,463(0.00%)#2,561 |
| 17. | St Matthews | 55 | 6,823(0.81%)#17 | 2,246,463(0.00%)#2,653 |
| 18. | Edgewood | 52 | 6,823(0.76%)#18 | 2,246,463(0.00%)#2,719 |
| 19. | Danville | 47 | 6,823(0.69%)#19 | 2,246,463(0.00%)#2,822 |
| 20. | Georgetown | 44 | 6,823(0.64%)#20 | 2,246,463(0.00%)#2,893 |
| 21. | Radcliff | 40 | 6,823(0.59%)#21 | 2,246,463(0.00%)#3,017 |
| 22. | Independence | 35 | 6,823(0.51%)#22 | 2,246,463(0.00%)#3,159 |
| 23. | Burlington | 30 | 6,823(0.44%)#23 | 2,246,463(0.00%)#3,357 |
| 24. | Harlan | 30 | 6,823(0.44%)#24 | 2,246,463(0.00%)#3,392 |
| 25. | Springfield | 28 | 6,823(0.41%)#25 | 2,246,463(0.00%)#3,462 |
| 26. | Wilmore | 22 | 6,823(0.32%)#26 | 2,246,463(0.00%)#3,726 |
| 27. | Graymoor Devondale | 18 | 6,823(0.26%)#27 | 2,246,463(0.00%)#3,959 |
| 28. | Elizabethtown | 17 | 6,823(0.25%)#28 | 2,246,463(0.00%)#3,978 |
| 29. | Kevil | 16 | 6,823(0.23%)#29 | 2,246,463(0.00%)#4,112 |
| 30. | Farley | 15 | 6,823(0.22%)#30 | 2,246,463(0.00%)#4,144 |
| 31. | Owensboro | 13 | 6,823(0.19%)#31 | 2,246,463(0.00%)#4,240 |
| 32. | St Regis Park | 13 | 6,823(0.19%)#32 | 2,246,463(0.00%)#4,302 |
| 33. | Beaver Dam | 12 | 6,823(0.18%)#33 | 2,246,463(0.00%)#4,380 |
| 34. | Mount Washington | 11 | 6,823(0.16%)#34 | 2,246,463(0.00%)#4,413 |
| 35. | Murray | 11 | 6,823(0.16%)#35 | 2,246,463(0.00%)#4,416 |
| 36. | Stamping Ground | 11 | 6,823(0.16%)#36 | 2,246,463(0.00%)#4,498 |
| 37. | Alexandria | 10 | 6,823(0.15%)#37 | 2,246,463(0.00%)#4,544 |
| 38. | Langdon Place | 10 | 6,823(0.15%)#38 | 2,246,463(0.00%)#4,606 |
| 39. | Claryville | 8 | 6,823(0.12%)#39 | 2,246,463(0.00%)#4,802 |
| 40. | Worthington Hills | 7 | 6,823(0.10%)#40 | 2,246,463(0.00%)#4,909 |
| 41. | Catlettsburg | 7 | 6,823(0.10%)#41 | 2,246,463(0.00%)#4,917 |
| 42. | Beechwood Village | 7 | 6,823(0.10%)#42 | 2,246,463(0.00%)#4,931 |
| 43. | Fleming Neon | 7 | 6,823(0.10%)#43 | 2,246,463(0.00%)#4,942 |
| 44. | Fincastle | 7 | 6,823(0.10%)#44 | 2,246,463(0.00%)#4,949 |
| 45. | Forest Hills | 7 | 6,823(0.10%)#45 | 2,246,463(0.00%)#4,952 |
| 46. | Coldstream | 6 | 6,823(0.09%)#46 | 2,246,463(0.00%)#5,043 |
| 47. | Hickory Hill | 6 | 6,823(0.09%)#47 | 2,246,463(0.00%)#5,074 |
| 48. | Parkway Village | 5 | 6,823(0.07%)#48 | 2,246,463(0.00%)#5,167 |
| 49. | Morehead | 3 | 6,823(0.04%)#49 | 2,246,463(0.00%)#5,310 |
| 50. | Strathmoor Village | 3 | 6,823(0.04%)#50 | 2,246,463(0.00%)#5,386 |
| 51. | Spring Mill | 3 | 6,823(0.04%)#51 | 2,246,463(0.00%)#5,398 |
| 52. | Allen | 3 | 6,823(0.04%)#52 | 2,246,463(0.00%)#5,405 |
| 53. | Newport | 2 | 6,823(0.03%)#53 | 2,246,463(0.00%)#5,420 |
| 54. | Seneca Gardens | 2 | 6,823(0.03%)#54 | 2,246,463(0.00%)#5,499 |
| 55. | Brownsboro Farm | 2 | 6,823(0.03%)#55 | 2,246,463(0.00%)#5,500 |
| 56. | Fort Campbell North | 1 | 6,823(0.01%)#56 | 2,246,463(0.00%)#5,552 |
| 57. | Breckinridge Center | 1 | 6,823(0.01%)#57 | 2,246,463(0.00%)#5,593 |
| 58. | Crofton | 1 | 6,823(0.01%)#58 | 2,246,463(0.00%)#5,628 |
| 59. | Druid Hills | 1 | 6,823(0.01%)#59 | 2,246,463(0.00%)#5,638 |
| 60. | Woodburn | 1 | 6,823(0.01%)#60 | 2,246,463(0.00%)#5,640 |
| 61. | Bellewood | 1 | 6,823(0.01%)#61 | 2,246,463(0.00%)#5,648 |
Common Questions
What are the Top 10 Cities with the Largest Sri Lankan Community in Kentucky?
Top 10 Cities with the Largest Sri Lankan Community in Kentucky are:
#1
2,919
#2
626
#3
306
#4
278
#5
154
#6
153
#7
120
#8
113
#9
106
#10
102
What city has the Largest Sri Lankan Community in Kentucky?
Louisville has the Largest Sri Lankan Community in Kentucky with 2,919.
What is the Total Sri Lankan Population in the State of Kentucky?
Total Sri Lankan Population in Kentucky is 6,823.
What is the Total Sri Lankan Population in the United States?
Total Sri Lankan Population in the United States is 2,246,463.