Cities with the Largest Sri Lankan Community in Missouri
RELATED REPORTS & OPTIONS
Sri Lankan
Missouri
Compare Cities
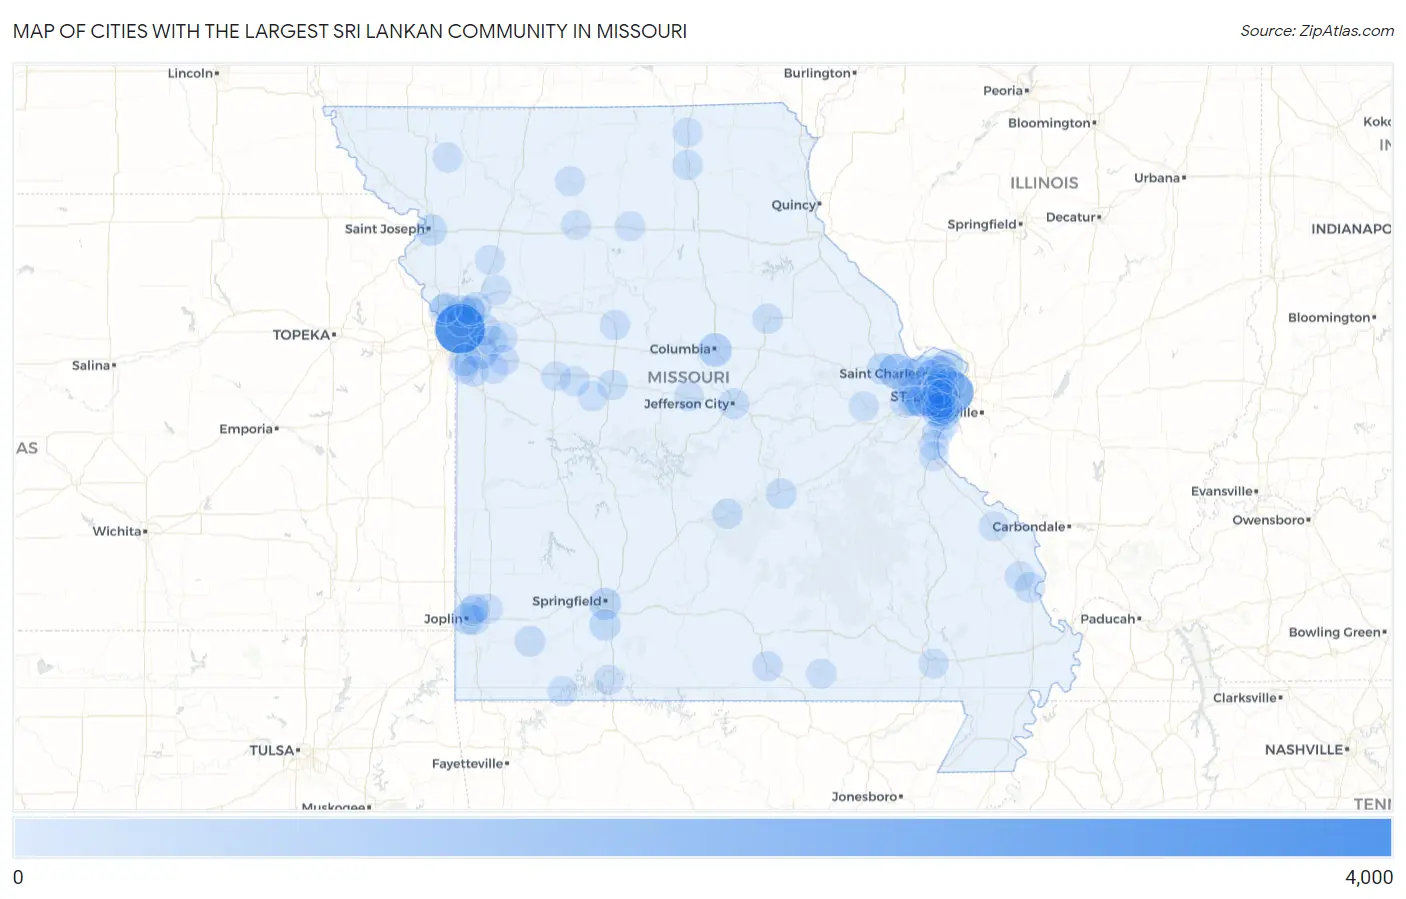
Map of Cities with the Largest Sri Lankan Community in Missouri
0
4,000
Cities with the Largest Sri Lankan Community in Missouri
| City | Sri Lankan | vs State | vs National | |
| 1. | Kansas City | 3,392 | 19,563(17.34%)#1 | 2,246,463(0.15%)#80 |
| 2. | St Louis | 2,080 | 19,563(10.63%)#2 | 2,246,463(0.09%)#133 |
| 3. | O Fallon | 863 | 19,563(4.41%)#3 | 2,246,463(0.04%)#352 |
| 4. | Columbia | 564 | 19,563(2.88%)#4 | 2,246,463(0.03%)#539 |
| 5. | Lee S Summit | 545 | 19,563(2.79%)#5 | 2,246,463(0.02%)#557 |
| 6. | Hazelwood | 390 | 19,563(1.99%)#6 | 2,246,463(0.02%)#739 |
| 7. | Grandview | 354 | 19,563(1.81%)#7 | 2,246,463(0.02%)#796 |
| 8. | Springfield | 347 | 19,563(1.77%)#8 | 2,246,463(0.02%)#810 |
| 9. | St Charles | 332 | 19,563(1.70%)#9 | 2,246,463(0.01%)#834 |
| 10. | Old Jamestown | 306 | 19,563(1.56%)#10 | 2,246,463(0.01%)#891 |
| 11. | Maryland Heights | 293 | 19,563(1.50%)#11 | 2,246,463(0.01%)#927 |
| 12. | Mehlville | 288 | 19,563(1.47%)#12 | 2,246,463(0.01%)#951 |
| 13. | Affton | 283 | 19,563(1.45%)#13 | 2,246,463(0.01%)#968 |
| 14. | Joplin | 280 | 19,563(1.43%)#14 | 2,246,463(0.01%)#971 |
| 15. | Florissant | 273 | 19,563(1.40%)#15 | 2,246,463(0.01%)#987 |
| 16. | St Joseph | 257 | 19,563(1.31%)#16 | 2,246,463(0.01%)#1,025 |
| 17. | Wentzville | 253 | 19,563(1.29%)#17 | 2,246,463(0.01%)#1,041 |
| 18. | Independence | 229 | 19,563(1.17%)#18 | 2,246,463(0.01%)#1,107 |
| 19. | Nixa | 220 | 19,563(1.12%)#19 | 2,246,463(0.01%)#1,143 |
| 20. | Overland | 207 | 19,563(1.06%)#20 | 2,246,463(0.01%)#1,196 |
| 21. | University City | 180 | 19,563(0.92%)#21 | 2,246,463(0.01%)#1,344 |
| 22. | Liberty | 167 | 19,563(0.85%)#22 | 2,246,463(0.01%)#1,408 |
| 23. | Gladstone | 161 | 19,563(0.82%)#23 | 2,246,463(0.01%)#1,436 |
| 24. | Monett | 147 | 19,563(0.75%)#24 | 2,246,463(0.01%)#1,520 |
| 25. | Jefferson City | 144 | 19,563(0.74%)#25 | 2,246,463(0.01%)#1,542 |
| 26. | Rolla | 136 | 19,563(0.70%)#26 | 2,246,463(0.01%)#1,596 |
| 27. | Blue Springs | 131 | 19,563(0.67%)#27 | 2,246,463(0.01%)#1,639 |
| 28. | Raymore | 131 | 19,563(0.67%)#28 | 2,246,463(0.01%)#1,642 |
| 29. | Parkville | 125 | 19,563(0.64%)#29 | 2,246,463(0.01%)#1,697 |
| 30. | Jennings | 112 | 19,563(0.57%)#30 | 2,246,463(0.00%)#1,812 |
| 31. | St John | 99 | 19,563(0.51%)#31 | 2,246,463(0.00%)#1,946 |
| 32. | Manchester | 94 | 19,563(0.48%)#32 | 2,246,463(0.00%)#2,003 |
| 33. | Concord | 93 | 19,563(0.48%)#33 | 2,246,463(0.00%)#2,013 |
| 34. | Oakville | 92 | 19,563(0.47%)#34 | 2,246,463(0.00%)#2,023 |
| 35. | Kirksville | 92 | 19,563(0.47%)#35 | 2,246,463(0.00%)#2,026 |
| 36. | Lemay | 88 | 19,563(0.45%)#36 | 2,246,463(0.00%)#2,078 |
| 37. | Sappington | 83 | 19,563(0.42%)#37 | 2,246,463(0.00%)#2,149 |
| 38. | Carthage | 82 | 19,563(0.42%)#38 | 2,246,463(0.00%)#2,160 |
| 39. | Cape Girardeau | 81 | 19,563(0.41%)#39 | 2,246,463(0.00%)#2,166 |
| 40. | Lone Jack | 77 | 19,563(0.39%)#40 | 2,246,463(0.00%)#2,242 |
| 41. | Ballwin | 75 | 19,563(0.38%)#41 | 2,246,463(0.00%)#2,261 |
| 42. | Bridgeton | 72 | 19,563(0.37%)#42 | 2,246,463(0.00%)#2,328 |
| 43. | Green Park | 67 | 19,563(0.34%)#43 | 2,246,463(0.00%)#2,425 |
| 44. | Duquesne | 67 | 19,563(0.34%)#44 | 2,246,463(0.00%)#2,426 |
| 45. | Chesterfield | 64 | 19,563(0.33%)#45 | 2,246,463(0.00%)#2,456 |
| 46. | Creve Coeur | 62 | 19,563(0.32%)#46 | 2,246,463(0.00%)#2,489 |
| 47. | Kirkwood | 61 | 19,563(0.31%)#47 | 2,246,463(0.00%)#2,516 |
| 48. | St Peters | 60 | 19,563(0.31%)#48 | 2,246,463(0.00%)#2,532 |
| 49. | West Plains | 59 | 19,563(0.30%)#49 | 2,246,463(0.00%)#2,562 |
| 50. | North Kansas City | 58 | 19,563(0.30%)#50 | 2,246,463(0.00%)#2,602 |
| 51. | Marshall | 57 | 19,563(0.29%)#51 | 2,246,463(0.00%)#2,615 |
| 52. | Wildwood | 56 | 19,563(0.29%)#52 | 2,246,463(0.00%)#2,629 |
| 53. | Brentwood | 56 | 19,563(0.29%)#53 | 2,246,463(0.00%)#2,638 |
| 54. | Waynesville | 53 | 19,563(0.27%)#54 | 2,246,463(0.00%)#2,700 |
| 55. | Richmond Heights | 50 | 19,563(0.26%)#55 | 2,246,463(0.00%)#2,764 |
| 56. | Webb City | 49 | 19,563(0.25%)#56 | 2,246,463(0.00%)#2,782 |
| 57. | Maplewood | 49 | 19,563(0.25%)#57 | 2,246,463(0.00%)#2,787 |
| 58. | Winchester | 47 | 19,563(0.24%)#58 | 2,246,463(0.00%)#2,835 |
| 59. | Mexico | 46 | 19,563(0.24%)#59 | 2,246,463(0.00%)#2,852 |
| 60. | Marlborough | 45 | 19,563(0.23%)#60 | 2,246,463(0.00%)#2,890 |
| 61. | Webster Groves | 41 | 19,563(0.21%)#61 | 2,246,463(0.00%)#2,981 |
| 62. | Sedalia | 41 | 19,563(0.21%)#62 | 2,246,463(0.00%)#2,983 |
| 63. | St George | 41 | 19,563(0.21%)#63 | 2,246,463(0.00%)#3,006 |
| 64. | Ellisville | 36 | 19,563(0.18%)#64 | 2,246,463(0.00%)#3,140 |
| 65. | Emerald Beach | 35 | 19,563(0.18%)#65 | 2,246,463(0.00%)#3,195 |
| 66. | Grain Valley | 34 | 19,563(0.17%)#66 | 2,246,463(0.00%)#3,203 |
| 67. | Imperial | 34 | 19,563(0.17%)#67 | 2,246,463(0.00%)#3,216 |
| 68. | Lathrop | 34 | 19,563(0.17%)#68 | 2,246,463(0.00%)#3,226 |
| 69. | Olivette | 29 | 19,563(0.15%)#69 | 2,246,463(0.00%)#3,423 |
| 70. | Chillicothe | 24 | 19,563(0.12%)#70 | 2,246,463(0.00%)#3,639 |
| 71. | Berkeley | 24 | 19,563(0.12%)#71 | 2,246,463(0.00%)#3,643 |
| 72. | Pevely | 24 | 19,563(0.12%)#72 | 2,246,463(0.00%)#3,652 |
| 73. | Green Ridge | 24 | 19,563(0.12%)#73 | 2,246,463(0.00%)#3,667 |
| 74. | Poplar Bluff | 23 | 19,563(0.12%)#74 | 2,246,463(0.00%)#3,676 |
| 75. | Claycomo | 23 | 19,563(0.12%)#75 | 2,246,463(0.00%)#3,704 |
| 76. | Jackson | 20 | 19,563(0.10%)#76 | 2,246,463(0.00%)#3,823 |
| 77. | Ladue | 20 | 19,563(0.10%)#77 | 2,246,463(0.00%)#3,832 |
| 78. | Whiteman Afb | 20 | 19,563(0.10%)#78 | 2,246,463(0.00%)#3,839 |
| 79. | Excelsior Springs | 18 | 19,563(0.09%)#79 | 2,246,463(0.00%)#3,936 |
| 80. | Conception | 18 | 19,563(0.09%)#80 | 2,246,463(0.00%)#3,972 |
| 81. | Warrensburg | 16 | 19,563(0.08%)#81 | 2,246,463(0.00%)#4,050 |
| 82. | Crestwood | 15 | 19,563(0.08%)#82 | 2,246,463(0.00%)#4,127 |
| 83. | Alton | 15 | 19,563(0.08%)#83 | 2,246,463(0.00%)#4,166 |
| 84. | Festus | 14 | 19,563(0.07%)#84 | 2,246,463(0.00%)#4,190 |
| 85. | Pleasant Valley | 14 | 19,563(0.07%)#85 | 2,246,463(0.00%)#4,220 |
| 86. | Weatherby Lake | 14 | 19,563(0.07%)#86 | 2,246,463(0.00%)#4,221 |
| 87. | Grantwood Village | 13 | 19,563(0.07%)#87 | 2,246,463(0.00%)#4,307 |
| 88. | Clayton | 12 | 19,563(0.06%)#88 | 2,246,463(0.00%)#4,330 |
| 89. | Washington | 12 | 19,563(0.06%)#89 | 2,246,463(0.00%)#4,333 |
| 90. | Des Peres | 12 | 19,563(0.06%)#90 | 2,246,463(0.00%)#4,348 |
| 91. | Pleasant Hill | 12 | 19,563(0.06%)#91 | 2,246,463(0.00%)#4,350 |
| 92. | Weldon Spring | 12 | 19,563(0.06%)#92 | 2,246,463(0.00%)#4,372 |
| 93. | Perryville | 11 | 19,563(0.06%)#93 | 2,246,463(0.00%)#4,440 |
| 94. | California | 11 | 19,563(0.06%)#94 | 2,246,463(0.00%)#4,459 |
| 95. | Carterville | 11 | 19,563(0.06%)#95 | 2,246,463(0.00%)#4,488 |
| 96. | Queen City | 11 | 19,563(0.06%)#96 | 2,246,463(0.00%)#4,500 |
| 97. | Belton | 10 | 19,563(0.05%)#97 | 2,246,463(0.00%)#4,519 |
| 98. | Branson | 10 | 19,563(0.05%)#98 | 2,246,463(0.00%)#4,537 |
| 99. | Trenton | 10 | 19,563(0.05%)#99 | 2,246,463(0.00%)#4,560 |
| 100. | Brookfield | 10 | 19,563(0.05%)#100 | 2,246,463(0.00%)#4,568 |
Common Questions
What are the Top 10 Cities with the Largest Sri Lankan Community in Missouri?
Top 10 Cities with the Largest Sri Lankan Community in Missouri are:
#1
3,392
#2
2,080
#3
863
#4
564
#5
545
#6
390
#7
354
#8
347
#9
332
#10
306
What city has the Largest Sri Lankan Community in Missouri?
Kansas City has the Largest Sri Lankan Community in Missouri with 3,392.
What is the Total Sri Lankan Population in the State of Missouri?
Total Sri Lankan Population in Missouri is 19,563.
What is the Total Sri Lankan Population in the United States?
Total Sri Lankan Population in the United States is 2,246,463.