Cities with the Largest Sri Lankan Community in Illinois
RELATED REPORTS & OPTIONS
Sri Lankan
Illinois
Compare Cities
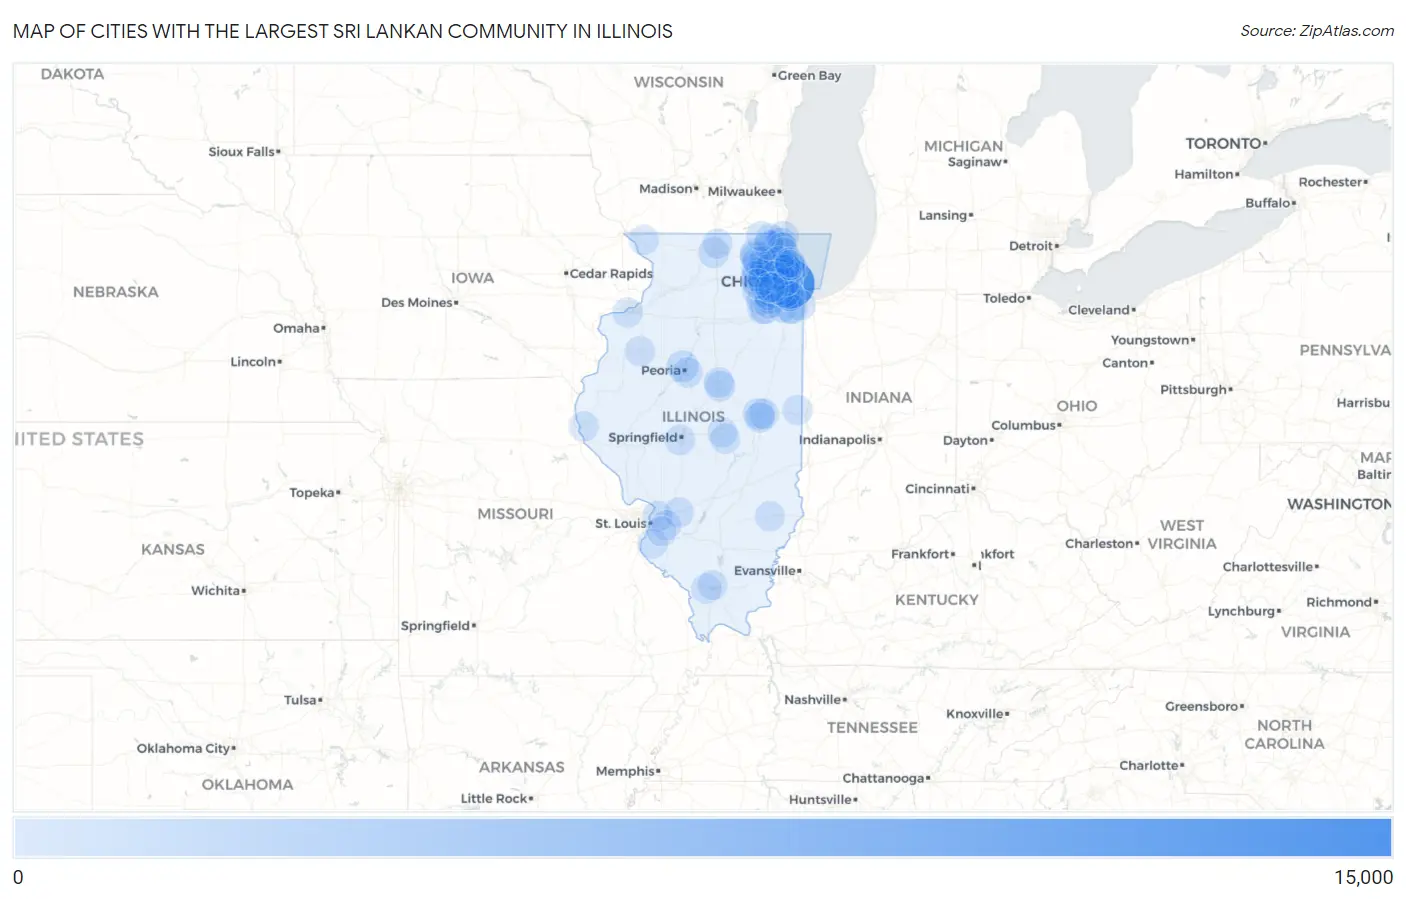
Map of Cities with the Largest Sri Lankan Community in Illinois
0
15,000
Cities with the Largest Sri Lankan Community in Illinois
| City | Sri Lankan | vs State | vs National | |
| 1. | Chicago | 12,280 | 37,590(32.67%)#1 | 2,246,463(0.55%)#19 |
| 2. | Skokie | 1,047 | 37,590(2.79%)#2 | 2,246,463(0.05%)#293 |
| 3. | Glendale Heights | 1,008 | 37,590(2.68%)#3 | 2,246,463(0.04%)#304 |
| 4. | Peoria | 960 | 37,590(2.55%)#4 | 2,246,463(0.04%)#316 |
| 5. | Carol Stream | 947 | 37,590(2.52%)#5 | 2,246,463(0.04%)#324 |
| 6. | Champaign | 832 | 37,590(2.21%)#6 | 2,246,463(0.04%)#364 |
| 7. | Aurora | 740 | 37,590(1.97%)#7 | 2,246,463(0.03%)#405 |
| 8. | Rockford | 547 | 37,590(1.46%)#8 | 2,246,463(0.02%)#555 |
| 9. | Lincolnwood | 544 | 37,590(1.45%)#9 | 2,246,463(0.02%)#558 |
| 10. | Lansing | 525 | 37,590(1.40%)#10 | 2,246,463(0.02%)#576 |
| 11. | Naperville | 524 | 37,590(1.39%)#11 | 2,246,463(0.02%)#577 |
| 12. | Mount Prospect | 519 | 37,590(1.38%)#12 | 2,246,463(0.02%)#582 |
| 13. | Arlington Heights | 516 | 37,590(1.37%)#13 | 2,246,463(0.02%)#584 |
| 14. | Evanston | 482 | 37,590(1.28%)#14 | 2,246,463(0.02%)#626 |
| 15. | Morton Grove | 447 | 37,590(1.19%)#15 | 2,246,463(0.02%)#670 |
| 16. | Niles | 377 | 37,590(1.00%)#16 | 2,246,463(0.02%)#762 |
| 17. | Bloomington | 328 | 37,590(0.87%)#17 | 2,246,463(0.01%)#841 |
| 18. | Hoffman Estates | 324 | 37,590(0.86%)#18 | 2,246,463(0.01%)#845 |
| 19. | Harwood Heights | 306 | 37,590(0.81%)#19 | 2,246,463(0.01%)#892 |
| 20. | Hanover Park | 297 | 37,590(0.79%)#20 | 2,246,463(0.01%)#910 |
| 21. | Pontoon Beach | 278 | 37,590(0.74%)#21 | 2,246,463(0.01%)#977 |
| 22. | Burbank | 273 | 37,590(0.73%)#22 | 2,246,463(0.01%)#989 |
| 23. | Shorewood | 244 | 37,590(0.65%)#23 | 2,246,463(0.01%)#1,067 |
| 24. | Plainfield | 238 | 37,590(0.63%)#24 | 2,246,463(0.01%)#1,080 |
| 25. | Wheaton | 236 | 37,590(0.63%)#25 | 2,246,463(0.01%)#1,085 |
| 26. | Springfield | 234 | 37,590(0.62%)#26 | 2,246,463(0.01%)#1,094 |
| 27. | Normal | 232 | 37,590(0.62%)#27 | 2,246,463(0.01%)#1,098 |
| 28. | Elgin | 227 | 37,590(0.60%)#28 | 2,246,463(0.01%)#1,112 |
| 29. | Gurnee | 225 | 37,590(0.60%)#29 | 2,246,463(0.01%)#1,125 |
| 30. | Algonquin | 223 | 37,590(0.59%)#30 | 2,246,463(0.01%)#1,135 |
| 31. | East Peoria | 212 | 37,590(0.56%)#31 | 2,246,463(0.01%)#1,178 |
| 32. | Grayslake | 210 | 37,590(0.56%)#32 | 2,246,463(0.01%)#1,185 |
| 33. | Zion | 208 | 37,590(0.55%)#33 | 2,246,463(0.01%)#1,190 |
| 34. | Waukegan | 204 | 37,590(0.54%)#34 | 2,246,463(0.01%)#1,206 |
| 35. | Lake In The Hills | 203 | 37,590(0.54%)#35 | 2,246,463(0.01%)#1,212 |
| 36. | Palatine | 192 | 37,590(0.51%)#36 | 2,246,463(0.01%)#1,265 |
| 37. | Joliet | 184 | 37,590(0.49%)#37 | 2,246,463(0.01%)#1,311 |
| 38. | Urbana | 184 | 37,590(0.49%)#38 | 2,246,463(0.01%)#1,315 |
| 39. | Berwyn | 182 | 37,590(0.48%)#39 | 2,246,463(0.01%)#1,328 |
| 40. | Highland | 182 | 37,590(0.48%)#40 | 2,246,463(0.01%)#1,332 |
| 41. | Streamwood | 162 | 37,590(0.43%)#41 | 2,246,463(0.01%)#1,429 |
| 42. | Glenview | 160 | 37,590(0.43%)#42 | 2,246,463(0.01%)#1,441 |
| 43. | Lake Villa | 152 | 37,590(0.40%)#43 | 2,246,463(0.01%)#1,486 |
| 44. | Northlake | 146 | 37,590(0.39%)#44 | 2,246,463(0.01%)#1,525 |
| 45. | Savoy | 145 | 37,590(0.39%)#45 | 2,246,463(0.01%)#1,536 |
| 46. | Carbondale | 143 | 37,590(0.38%)#46 | 2,246,463(0.01%)#1,548 |
| 47. | Crystal Lake | 141 | 37,590(0.38%)#47 | 2,246,463(0.01%)#1,559 |
| 48. | Romeoville | 141 | 37,590(0.38%)#48 | 2,246,463(0.01%)#1,560 |
| 49. | Woodridge | 136 | 37,590(0.36%)#49 | 2,246,463(0.01%)#1,594 |
| 50. | Olympia Fields | 132 | 37,590(0.35%)#50 | 2,246,463(0.01%)#1,636 |
| 51. | Oak Lawn | 130 | 37,590(0.35%)#51 | 2,246,463(0.01%)#1,646 |
| 52. | Quincy | 127 | 37,590(0.34%)#52 | 2,246,463(0.01%)#1,678 |
| 53. | Geneva | 119 | 37,590(0.32%)#53 | 2,246,463(0.01%)#1,754 |
| 54. | Broadview | 118 | 37,590(0.31%)#54 | 2,246,463(0.01%)#1,764 |
| 55. | Mount Zion | 117 | 37,590(0.31%)#55 | 2,246,463(0.01%)#1,774 |
| 56. | Bolingbrook | 109 | 37,590(0.29%)#56 | 2,246,463(0.00%)#1,833 |
| 57. | Mokena | 109 | 37,590(0.29%)#57 | 2,246,463(0.00%)#1,835 |
| 58. | Des Plaines | 108 | 37,590(0.29%)#58 | 2,246,463(0.00%)#1,847 |
| 59. | Crest Hill | 106 | 37,590(0.28%)#59 | 2,246,463(0.00%)#1,869 |
| 60. | Bloomingdale | 105 | 37,590(0.28%)#60 | 2,246,463(0.00%)#1,878 |
| 61. | Matteson | 102 | 37,590(0.27%)#61 | 2,246,463(0.00%)#1,903 |
| 62. | Warrenville | 101 | 37,590(0.27%)#62 | 2,246,463(0.00%)#1,914 |
| 63. | Danville | 100 | 37,590(0.27%)#63 | 2,246,463(0.00%)#1,925 |
| 64. | Rock Island | 99 | 37,590(0.26%)#64 | 2,246,463(0.00%)#1,936 |
| 65. | Galesburg | 98 | 37,590(0.26%)#65 | 2,246,463(0.00%)#1,953 |
| 66. | Arbury Hills | 97 | 37,590(0.26%)#66 | 2,246,463(0.00%)#1,975 |
| 67. | Eagle Lake | 94 | 37,590(0.25%)#67 | 2,246,463(0.00%)#2,007 |
| 68. | Bartlett | 92 | 37,590(0.24%)#68 | 2,246,463(0.00%)#2,021 |
| 69. | Bensenville | 92 | 37,590(0.24%)#69 | 2,246,463(0.00%)#2,025 |
| 70. | O Fallon | 90 | 37,590(0.24%)#70 | 2,246,463(0.00%)#2,052 |
| 71. | South Elgin | 87 | 37,590(0.23%)#71 | 2,246,463(0.00%)#2,088 |
| 72. | Burr Ridge | 87 | 37,590(0.23%)#72 | 2,246,463(0.00%)#2,095 |
| 73. | St Charles | 85 | 37,590(0.23%)#73 | 2,246,463(0.00%)#2,107 |
| 74. | West Chicago | 85 | 37,590(0.23%)#74 | 2,246,463(0.00%)#2,108 |
| 75. | The Galena Territory | 84 | 37,590(0.22%)#75 | 2,246,463(0.00%)#2,133 |
| 76. | North Chicago | 81 | 37,590(0.22%)#76 | 2,246,463(0.00%)#2,167 |
| 77. | Oak Park | 78 | 37,590(0.21%)#77 | 2,246,463(0.00%)#2,212 |
| 78. | Schaumburg | 74 | 37,590(0.20%)#78 | 2,246,463(0.00%)#2,280 |
| 79. | Machesney Park | 73 | 37,590(0.19%)#79 | 2,246,463(0.00%)#2,308 |
| 80. | Hickory Hills | 73 | 37,590(0.19%)#80 | 2,246,463(0.00%)#2,312 |
| 81. | Forest Park | 73 | 37,590(0.19%)#81 | 2,246,463(0.00%)#2,313 |
| 82. | Carterville | 73 | 37,590(0.19%)#82 | 2,246,463(0.00%)#2,319 |
| 83. | Park Ridge | 71 | 37,590(0.19%)#83 | 2,246,463(0.00%)#2,344 |
| 84. | Lake Forest | 71 | 37,590(0.19%)#84 | 2,246,463(0.00%)#2,351 |
| 85. | Decatur | 69 | 37,590(0.18%)#85 | 2,246,463(0.00%)#2,378 |
| 86. | Barrington Hills | 69 | 37,590(0.18%)#86 | 2,246,463(0.00%)#2,395 |
| 87. | Wheeling | 68 | 37,590(0.18%)#87 | 2,246,463(0.00%)#2,399 |
| 88. | Olney | 66 | 37,590(0.18%)#88 | 2,246,463(0.00%)#2,435 |
| 89. | Addison | 64 | 37,590(0.17%)#89 | 2,246,463(0.00%)#2,459 |
| 90. | Winnetka | 62 | 37,590(0.16%)#90 | 2,246,463(0.00%)#2,494 |
| 91. | Carpentersville | 59 | 37,590(0.16%)#91 | 2,246,463(0.00%)#2,551 |
| 92. | Alsip | 59 | 37,590(0.16%)#92 | 2,246,463(0.00%)#2,556 |
| 93. | Round Lake | 59 | 37,590(0.16%)#93 | 2,246,463(0.00%)#2,557 |
| 94. | Spring Grove | 58 | 37,590(0.15%)#94 | 2,246,463(0.00%)#2,600 |
| 95. | Waterloo | 57 | 37,590(0.15%)#95 | 2,246,463(0.00%)#2,617 |
| 96. | Belleville | 56 | 37,590(0.15%)#96 | 2,246,463(0.00%)#2,628 |
| 97. | Downers Grove | 55 | 37,590(0.15%)#97 | 2,246,463(0.00%)#2,647 |
| 98. | Batavia | 52 | 37,590(0.14%)#98 | 2,246,463(0.00%)#2,709 |
| 99. | Lisle | 52 | 37,590(0.14%)#99 | 2,246,463(0.00%)#2,710 |
| 100. | Wilmette | 51 | 37,590(0.14%)#100 | 2,246,463(0.00%)#2,733 |
Common Questions
What are the Top 10 Cities with the Largest Sri Lankan Community in Illinois?
Top 10 Cities with the Largest Sri Lankan Community in Illinois are:
#1
12,280
#2
1,047
#3
1,008
#4
960
#5
947
#6
832
#7
740
#8
547
#9
544
#10
525
What city has the Largest Sri Lankan Community in Illinois?
Chicago has the Largest Sri Lankan Community in Illinois with 12,280.
What is the Total Sri Lankan Population in the State of Illinois?
Total Sri Lankan Population in Illinois is 37,590.
What is the Total Sri Lankan Population in the United States?
Total Sri Lankan Population in the United States is 2,246,463.