Cities with the Largest Sri Lankan Community in Virginia
RELATED REPORTS & OPTIONS
Sri Lankan
Virginia
Compare Cities
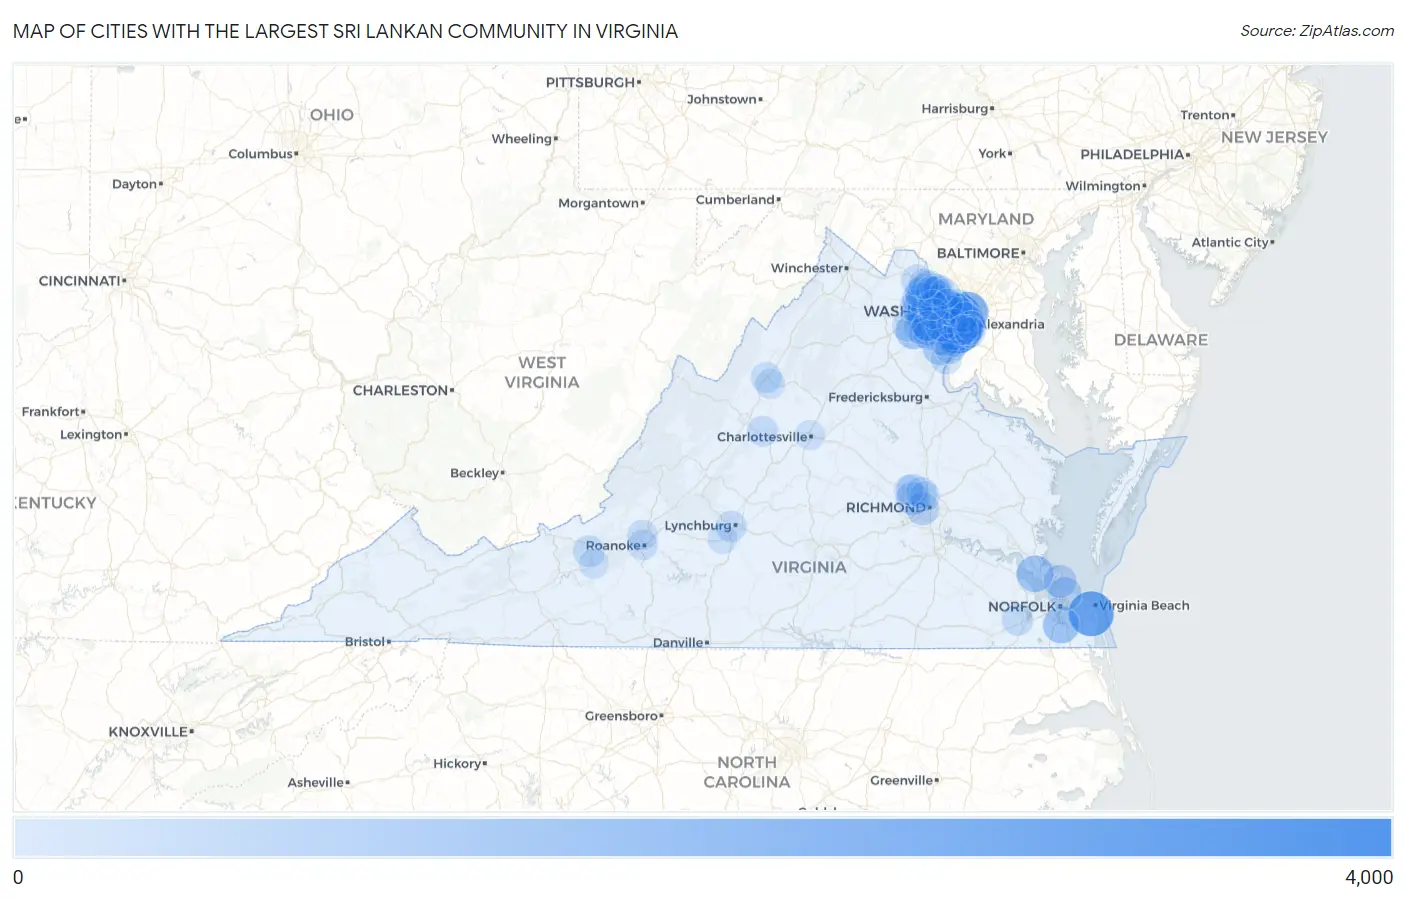
Map of Cities with the Largest Sri Lankan Community in Virginia
0
4,000
Cities with the Largest Sri Lankan Community in Virginia
| City | Sri Lankan | vs State | vs National | |
| 1. | Annandale | 3,521 | 76,442(4.61%)#1 | 2,246,463(0.16%)#76 |
| 2. | Springfield | 3,449 | 76,442(4.51%)#2 | 2,246,463(0.15%)#79 |
| 3. | Virginia Beach | 2,706 | 76,442(3.54%)#3 | 2,246,463(0.12%)#107 |
| 4. | West Falls Church | 2,675 | 76,442(3.50%)#4 | 2,246,463(0.12%)#110 |
| 5. | Centreville | 2,083 | 76,442(2.72%)#5 | 2,246,463(0.09%)#132 |
| 6. | Arlington | 2,072 | 76,442(2.71%)#6 | 2,246,463(0.09%)#134 |
| 7. | North Springfield | 1,801 | 76,442(2.36%)#7 | 2,246,463(0.08%)#165 |
| 8. | Oakton | 1,288 | 76,442(1.68%)#8 | 2,246,463(0.06%)#240 |
| 9. | Newport News | 1,260 | 76,442(1.65%)#9 | 2,246,463(0.06%)#248 |
| 10. | Burke | 1,258 | 76,442(1.65%)#10 | 2,246,463(0.06%)#250 |
| 11. | Chesapeake | 1,256 | 76,442(1.64%)#11 | 2,246,463(0.06%)#252 |
| 12. | Chantilly | 1,220 | 76,442(1.60%)#12 | 2,246,463(0.05%)#256 |
| 13. | South Riding | 1,191 | 76,442(1.56%)#13 | 2,246,463(0.05%)#261 |
| 14. | Linton Hall | 1,157 | 76,442(1.51%)#14 | 2,246,463(0.05%)#266 |
| 15. | Reston | 1,122 | 76,442(1.47%)#15 | 2,246,463(0.05%)#275 |
| 16. | Franconia | 1,059 | 76,442(1.39%)#16 | 2,246,463(0.05%)#288 |
| 17. | Dale City | 959 | 76,442(1.25%)#17 | 2,246,463(0.04%)#319 |
| 18. | Sterling | 936 | 76,442(1.22%)#18 | 2,246,463(0.04%)#328 |
| 19. | Ashburn | 872 | 76,442(1.14%)#19 | 2,246,463(0.04%)#346 |
| 20. | Fairfax | 872 | 76,442(1.14%)#20 | 2,246,463(0.04%)#347 |
| 21. | West Springfield | 749 | 76,442(0.98%)#21 | 2,246,463(0.03%)#403 |
| 22. | Newington | 730 | 76,442(0.95%)#22 | 2,246,463(0.03%)#411 |
| 23. | Rose Hill Cdp Fairfax County | 724 | 76,442(0.95%)#23 | 2,246,463(0.03%)#417 |
| 24. | Alexandria | 719 | 76,442(0.94%)#24 | 2,246,463(0.03%)#421 |
| 25. | Norfolk | 710 | 76,442(0.93%)#25 | 2,246,463(0.03%)#428 |
| 26. | Lorton | 690 | 76,442(0.90%)#26 | 2,246,463(0.03%)#437 |
| 27. | Idylwood | 689 | 76,442(0.90%)#27 | 2,246,463(0.03%)#438 |
| 28. | Hampton | 674 | 76,442(0.88%)#28 | 2,246,463(0.03%)#447 |
| 29. | Tuckahoe | 657 | 76,442(0.86%)#29 | 2,246,463(0.03%)#461 |
| 30. | Brambleton | 649 | 76,442(0.85%)#30 | 2,246,463(0.03%)#468 |
| 31. | Manassas Park | 648 | 76,442(0.85%)#31 | 2,246,463(0.03%)#469 |
| 32. | Merrifield | 645 | 76,442(0.84%)#32 | 2,246,463(0.03%)#473 |
| 33. | Richmond | 639 | 76,442(0.84%)#33 | 2,246,463(0.03%)#475 |
| 34. | Bull Run | 591 | 76,442(0.77%)#34 | 2,246,463(0.03%)#513 |
| 35. | Seven Corners | 583 | 76,442(0.76%)#35 | 2,246,463(0.03%)#524 |
| 36. | Burke Centre | 576 | 76,442(0.75%)#36 | 2,246,463(0.03%)#530 |
| 37. | Lincolnia | 572 | 76,442(0.75%)#37 | 2,246,463(0.03%)#533 |
| 38. | Newington Forest | 570 | 76,442(0.75%)#38 | 2,246,463(0.03%)#536 |
| 39. | Stone Ridge | 561 | 76,442(0.73%)#39 | 2,246,463(0.02%)#544 |
| 40. | Lake Barcroft | 535 | 76,442(0.70%)#40 | 2,246,463(0.02%)#565 |
| 41. | Woodburn | 530 | 76,442(0.69%)#41 | 2,246,463(0.02%)#570 |
| 42. | Ravensworth | 509 | 76,442(0.67%)#42 | 2,246,463(0.02%)#593 |
| 43. | Fair Lakes | 500 | 76,442(0.65%)#43 | 2,246,463(0.02%)#603 |
| 44. | Fair Oaks | 498 | 76,442(0.65%)#44 | 2,246,463(0.02%)#606 |
| 45. | Mclean | 482 | 76,442(0.63%)#45 | 2,246,463(0.02%)#628 |
| 46. | Innsbrook | 473 | 76,442(0.62%)#46 | 2,246,463(0.02%)#644 |
| 47. | Union Mill | 456 | 76,442(0.60%)#47 | 2,246,463(0.02%)#658 |
| 48. | Woodlawn Cdp Fairfax County | 434 | 76,442(0.57%)#48 | 2,246,463(0.02%)#684 |
| 49. | Tysons | 431 | 76,442(0.56%)#49 | 2,246,463(0.02%)#687 |
| 50. | University Center | 414 | 76,442(0.54%)#50 | 2,246,463(0.02%)#709 |
| 51. | Kings Park West | 388 | 76,442(0.51%)#51 | 2,246,463(0.02%)#741 |
| 52. | Herndon | 386 | 76,442(0.50%)#52 | 2,246,463(0.02%)#748 |
| 53. | Blacksburg | 384 | 76,442(0.50%)#53 | 2,246,463(0.02%)#752 |
| 54. | Suffolk | 379 | 76,442(0.50%)#54 | 2,246,463(0.02%)#757 |
| 55. | Loudoun Valley Estates | 377 | 76,442(0.49%)#55 | 2,246,463(0.02%)#764 |
| 56. | Franklin Farm | 323 | 76,442(0.42%)#56 | 2,246,463(0.01%)#847 |
| 57. | Midlothian | 316 | 76,442(0.41%)#57 | 2,246,463(0.01%)#862 |
| 58. | Cherry Hill | 315 | 76,442(0.41%)#58 | 2,246,463(0.01%)#865 |
| 59. | Braddock | 314 | 76,442(0.41%)#59 | 2,246,463(0.01%)#869 |
| 60. | Vienna | 313 | 76,442(0.41%)#60 | 2,246,463(0.01%)#873 |
| 61. | Lynchburg | 309 | 76,442(0.40%)#61 | 2,246,463(0.01%)#882 |
| 62. | Harrisonburg | 297 | 76,442(0.39%)#62 | 2,246,463(0.01%)#909 |
| 63. | Laurel | 297 | 76,442(0.39%)#63 | 2,246,463(0.01%)#912 |
| 64. | Dunn Loring | 293 | 76,442(0.38%)#64 | 2,246,463(0.01%)#929 |
| 65. | Pimmit Hills | 293 | 76,442(0.38%)#65 | 2,246,463(0.01%)#931 |
| 66. | Gainesville | 290 | 76,442(0.38%)#66 | 2,246,463(0.01%)#941 |
| 67. | Falls Church | 290 | 76,442(0.38%)#67 | 2,246,463(0.01%)#942 |
| 68. | Waynesboro | 288 | 76,442(0.38%)#68 | 2,246,463(0.01%)#952 |
| 69. | Broadlands | 286 | 76,442(0.37%)#69 | 2,246,463(0.01%)#957 |
| 70. | Leesburg | 282 | 76,442(0.37%)#70 | 2,246,463(0.01%)#969 |
| 71. | Manassas | 274 | 76,442(0.36%)#71 | 2,246,463(0.01%)#985 |
| 72. | Cascades | 269 | 76,442(0.35%)#72 | 2,246,463(0.01%)#998 |
| 73. | Sugarland Run | 238 | 76,442(0.31%)#73 | 2,246,463(0.01%)#1,081 |
| 74. | Roanoke | 230 | 76,442(0.30%)#74 | 2,246,463(0.01%)#1,104 |
| 75. | Lowes Island | 224 | 76,442(0.29%)#75 | 2,246,463(0.01%)#1,134 |
| 76. | Hollins | 222 | 76,442(0.29%)#76 | 2,246,463(0.01%)#1,142 |
| 77. | County Center | 220 | 76,442(0.29%)#77 | 2,246,463(0.01%)#1,145 |
| 78. | Bailey S Crossroads | 212 | 76,442(0.28%)#78 | 2,246,463(0.01%)#1,177 |
| 79. | Buckhall | 209 | 76,442(0.27%)#79 | 2,246,463(0.01%)#1,189 |
| 80. | Kings Park | 207 | 76,442(0.27%)#80 | 2,246,463(0.01%)#1,198 |
| 81. | Lake Ridge | 202 | 76,442(0.26%)#81 | 2,246,463(0.01%)#1,217 |
| 82. | Woodbridge | 200 | 76,442(0.26%)#82 | 2,246,463(0.01%)#1,226 |
| 83. | Huntington | 199 | 76,442(0.26%)#83 | 2,246,463(0.01%)#1,234 |
| 84. | Hybla Valley | 195 | 76,442(0.26%)#84 | 2,246,463(0.01%)#1,250 |
| 85. | Fairfax Station | 193 | 76,442(0.25%)#85 | 2,246,463(0.01%)#1,261 |
| 86. | Timberlake | 189 | 76,442(0.25%)#86 | 2,246,463(0.01%)#1,284 |
| 87. | Dulles Town Center | 182 | 76,442(0.24%)#87 | 2,246,463(0.01%)#1,335 |
| 88. | Great Falls | 181 | 76,442(0.24%)#88 | 2,246,463(0.01%)#1,340 |
| 89. | Wolf Trap | 168 | 76,442(0.22%)#89 | 2,246,463(0.01%)#1,402 |
| 90. | Lakeside | 168 | 76,442(0.22%)#90 | 2,246,463(0.01%)#1,403 |
| 91. | Greenbriar | 165 | 76,442(0.22%)#91 | 2,246,463(0.01%)#1,418 |
| 92. | Christiansburg | 164 | 76,442(0.21%)#92 | 2,246,463(0.01%)#1,420 |
| 93. | Massanetta Springs | 161 | 76,442(0.21%)#93 | 2,246,463(0.01%)#1,439 |
| 94. | Charlottesville | 157 | 76,442(0.21%)#94 | 2,246,463(0.01%)#1,455 |
| 95. | Yorkshire | 157 | 76,442(0.21%)#95 | 2,246,463(0.01%)#1,459 |
| 96. | Floris | 156 | 76,442(0.20%)#96 | 2,246,463(0.01%)#1,466 |
| 97. | Short Pump | 153 | 76,442(0.20%)#97 | 2,246,463(0.01%)#1,479 |
| 98. | Lansdowne | 152 | 76,442(0.20%)#98 | 2,246,463(0.01%)#1,485 |
| 99. | Groveton | 148 | 76,442(0.19%)#99 | 2,246,463(0.01%)#1,509 |
| 100. | Kingstowne | 145 | 76,442(0.19%)#100 | 2,246,463(0.01%)#1,535 |
Common Questions
What are the Top 10 Cities with the Largest Sri Lankan Community in Virginia?
Top 10 Cities with the Largest Sri Lankan Community in Virginia are:
#1
3,521
#2
3,449
#3
2,706
#4
2,675
#5
2,083
#6
2,072
#7
1,801
#8
1,288
#9
1,260
#10
1,258
What city has the Largest Sri Lankan Community in Virginia?
Annandale has the Largest Sri Lankan Community in Virginia with 3,521.
What is the Total Sri Lankan Population in the State of Virginia?
Total Sri Lankan Population in Virginia is 76,442.
What is the Total Sri Lankan Population in the United States?
Total Sri Lankan Population in the United States is 2,246,463.