Cities with the Largest Sri Lankan Community in Michigan
RELATED REPORTS & OPTIONS
Sri Lankan
Michigan
Compare Cities
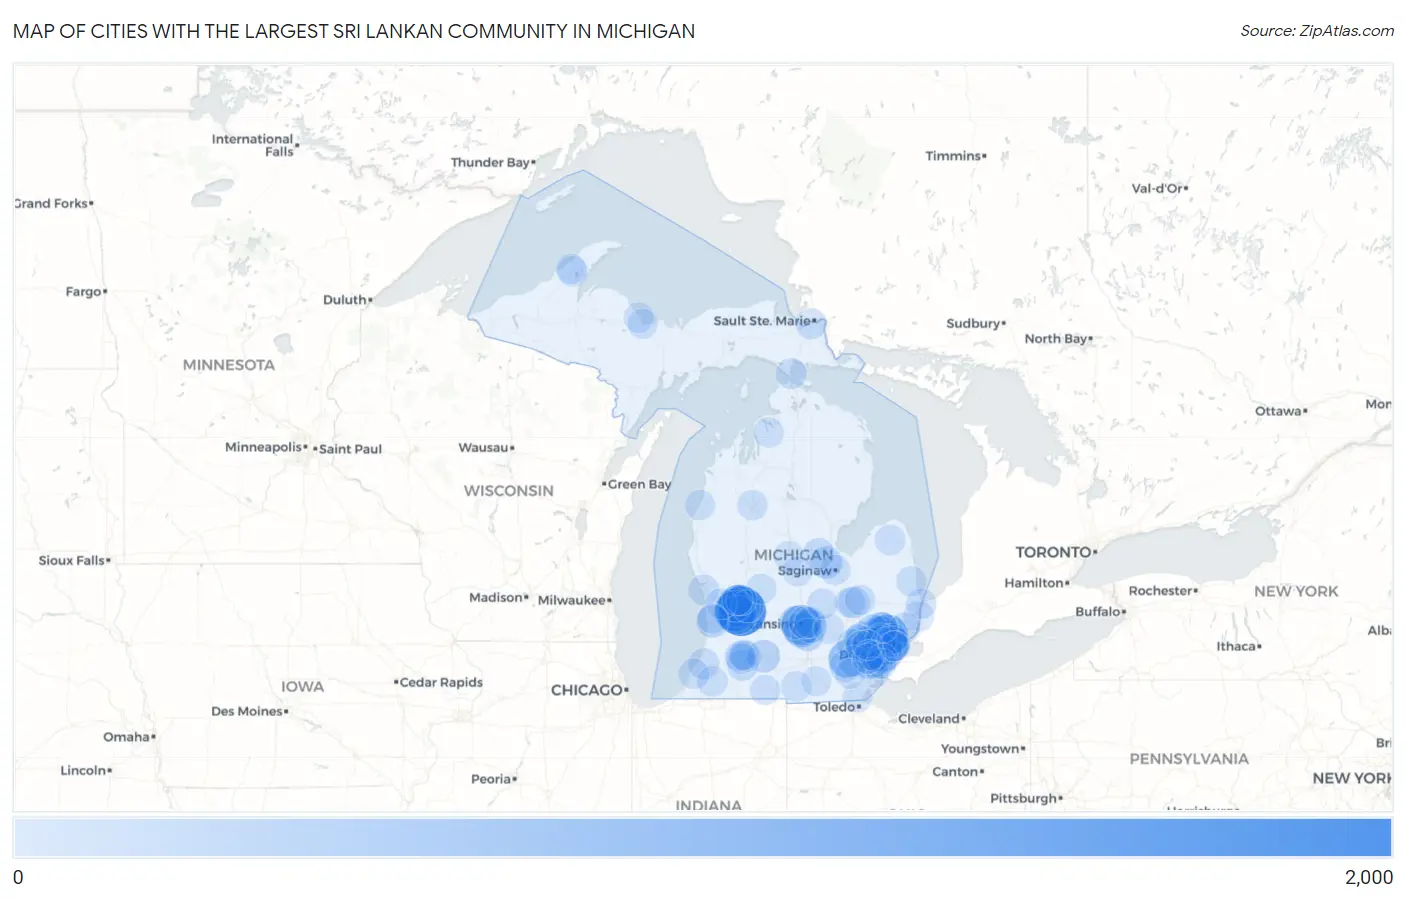
Map of Cities with the Largest Sri Lankan Community in Michigan
0
2,000
Cities with the Largest Sri Lankan Community in Michigan
| City | Sri Lankan | vs State | vs National | |
| 1. | Kentwood | 1,562 | 24,230(6.45%)#1 | 2,246,463(0.07%)#200 |
| 2. | Warren | 1,036 | 24,230(4.28%)#2 | 2,246,463(0.05%)#296 |
| 3. | Grand Rapids | 977 | 24,230(4.03%)#3 | 2,246,463(0.04%)#313 |
| 4. | Sterling Heights | 869 | 24,230(3.59%)#4 | 2,246,463(0.04%)#349 |
| 5. | Wyoming | 860 | 24,230(3.55%)#5 | 2,246,463(0.04%)#354 |
| 6. | Lansing | 771 | 24,230(3.18%)#6 | 2,246,463(0.03%)#398 |
| 7. | Cutlerville | 684 | 24,230(2.82%)#7 | 2,246,463(0.03%)#440 |
| 8. | Ann Arbor | 612 | 24,230(2.53%)#8 | 2,246,463(0.03%)#495 |
| 9. | Detroit | 608 | 24,230(2.51%)#9 | 2,246,463(0.03%)#499 |
| 10. | Troy | 577 | 24,230(2.38%)#10 | 2,246,463(0.03%)#527 |
| 11. | Livonia | 487 | 24,230(2.01%)#11 | 2,246,463(0.02%)#619 |
| 12. | Oak Park | 387 | 24,230(1.60%)#12 | 2,246,463(0.02%)#744 |
| 13. | Holt | 386 | 24,230(1.59%)#13 | 2,246,463(0.02%)#747 |
| 14. | Walled Lake | 301 | 24,230(1.24%)#14 | 2,246,463(0.01%)#902 |
| 15. | Madison Heights | 289 | 24,230(1.19%)#15 | 2,246,463(0.01%)#945 |
| 16. | Walker | 272 | 24,230(1.12%)#16 | 2,246,463(0.01%)#992 |
| 17. | Rochester Hills | 271 | 24,230(1.12%)#17 | 2,246,463(0.01%)#994 |
| 18. | Okemos | 269 | 24,230(1.11%)#18 | 2,246,463(0.01%)#997 |
| 19. | Waverly | 263 | 24,230(1.09%)#19 | 2,246,463(0.01%)#1,010 |
| 20. | Battle Creek | 213 | 24,230(0.88%)#20 | 2,246,463(0.01%)#1,170 |
| 21. | Holland | 211 | 24,230(0.87%)#21 | 2,246,463(0.01%)#1,181 |
| 22. | Romulus | 203 | 24,230(0.84%)#22 | 2,246,463(0.01%)#1,213 |
| 23. | Freeland | 189 | 24,230(0.78%)#23 | 2,246,463(0.01%)#1,288 |
| 24. | Mason | 172 | 24,230(0.71%)#24 | 2,246,463(0.01%)#1,387 |
| 25. | Forest Hills | 169 | 24,230(0.70%)#25 | 2,246,463(0.01%)#1,396 |
| 26. | Dearborn | 166 | 24,230(0.69%)#26 | 2,246,463(0.01%)#1,412 |
| 27. | East Lansing | 163 | 24,230(0.67%)#27 | 2,246,463(0.01%)#1,423 |
| 28. | Novi | 157 | 24,230(0.65%)#28 | 2,246,463(0.01%)#1,454 |
| 29. | Southfield | 155 | 24,230(0.64%)#29 | 2,246,463(0.01%)#1,467 |
| 30. | Farmington Hills | 150 | 24,230(0.62%)#30 | 2,246,463(0.01%)#1,492 |
| 31. | Westland | 137 | 24,230(0.57%)#31 | 2,246,463(0.01%)#1,587 |
| 32. | Burton | 135 | 24,230(0.56%)#32 | 2,246,463(0.01%)#1,608 |
| 33. | Saline | 112 | 24,230(0.46%)#33 | 2,246,463(0.00%)#1,814 |
| 34. | Portage | 111 | 24,230(0.46%)#34 | 2,246,463(0.00%)#1,819 |
| 35. | Pontiac | 106 | 24,230(0.44%)#35 | 2,246,463(0.00%)#1,865 |
| 36. | South Lyon | 100 | 24,230(0.41%)#36 | 2,246,463(0.00%)#1,931 |
| 37. | Midland | 99 | 24,230(0.41%)#37 | 2,246,463(0.00%)#1,935 |
| 38. | Royal Oak | 90 | 24,230(0.37%)#38 | 2,246,463(0.00%)#2,049 |
| 39. | Wixom | 87 | 24,230(0.36%)#39 | 2,246,463(0.00%)#2,091 |
| 40. | Haslett | 83 | 24,230(0.34%)#40 | 2,246,463(0.00%)#2,143 |
| 41. | Inkster | 77 | 24,230(0.32%)#41 | 2,246,463(0.00%)#2,229 |
| 42. | Southgate | 74 | 24,230(0.31%)#42 | 2,246,463(0.00%)#2,285 |
| 43. | Hamtramck | 74 | 24,230(0.31%)#43 | 2,246,463(0.00%)#2,287 |
| 44. | St Clair Shores | 72 | 24,230(0.30%)#44 | 2,246,463(0.00%)#2,320 |
| 45. | Sault Ste Marie | 71 | 24,230(0.29%)#45 | 2,246,463(0.00%)#2,354 |
| 46. | Clawson | 71 | 24,230(0.29%)#46 | 2,246,463(0.00%)#2,356 |
| 47. | Paw Paw Lake | 68 | 24,230(0.28%)#47 | 2,246,463(0.00%)#2,412 |
| 48. | Taylor | 66 | 24,230(0.27%)#48 | 2,246,463(0.00%)#2,427 |
| 49. | Ypsilanti | 65 | 24,230(0.27%)#49 | 2,246,463(0.00%)#2,447 |
| 50. | Comstock Northwest | 61 | 24,230(0.25%)#50 | 2,246,463(0.00%)#2,528 |
| 51. | Northville | 59 | 24,230(0.24%)#51 | 2,246,463(0.00%)#2,569 |
| 52. | St Ignace | 59 | 24,230(0.24%)#52 | 2,246,463(0.00%)#2,574 |
| 53. | Norton Shores | 58 | 24,230(0.24%)#53 | 2,246,463(0.00%)#2,582 |
| 54. | Allendale | 54 | 24,230(0.22%)#54 | 2,246,463(0.00%)#2,668 |
| 55. | Center Line | 54 | 24,230(0.22%)#55 | 2,246,463(0.00%)#2,676 |
| 56. | Dearborn Heights | 46 | 24,230(0.19%)#56 | 2,246,463(0.00%)#2,838 |
| 57. | St Clair | 46 | 24,230(0.19%)#57 | 2,246,463(0.00%)#2,856 |
| 58. | Kalamazoo | 45 | 24,230(0.19%)#58 | 2,246,463(0.00%)#2,865 |
| 59. | Fair Plain | 45 | 24,230(0.19%)#59 | 2,246,463(0.00%)#2,879 |
| 60. | Flint | 41 | 24,230(0.17%)#60 | 2,246,463(0.00%)#2,973 |
| 61. | Port Huron | 37 | 24,230(0.15%)#61 | 2,246,463(0.00%)#3,104 |
| 62. | Owosso | 37 | 24,230(0.15%)#62 | 2,246,463(0.00%)#3,110 |
| 63. | New Baltimore | 36 | 24,230(0.15%)#63 | 2,246,463(0.00%)#3,137 |
| 64. | Bad Axe | 36 | 24,230(0.15%)#64 | 2,246,463(0.00%)#3,151 |
| 65. | Davison | 35 | 24,230(0.14%)#65 | 2,246,463(0.00%)#3,183 |
| 66. | Roseville | 32 | 24,230(0.13%)#66 | 2,246,463(0.00%)#3,265 |
| 67. | Westwood | 31 | 24,230(0.13%)#67 | 2,246,463(0.00%)#3,329 |
| 68. | Dowagiac | 30 | 24,230(0.12%)#68 | 2,246,463(0.00%)#3,381 |
| 69. | Saginaw | 28 | 24,230(0.12%)#69 | 2,246,463(0.00%)#3,435 |
| 70. | Fraser | 27 | 24,230(0.11%)#70 | 2,246,463(0.00%)#3,479 |
| 71. | Grosse Pointe Woods | 26 | 24,230(0.11%)#71 | 2,246,463(0.00%)#3,526 |
| 72. | Greenville | 26 | 24,230(0.11%)#72 | 2,246,463(0.00%)#3,539 |
| 73. | Northview | 25 | 24,230(0.10%)#73 | 2,246,463(0.00%)#3,575 |
| 74. | Cadillac | 25 | 24,230(0.10%)#74 | 2,246,463(0.00%)#3,586 |
| 75. | Comstock Park | 25 | 24,230(0.10%)#75 | 2,246,463(0.00%)#3,587 |
| 76. | Hillsdale | 25 | 24,230(0.10%)#76 | 2,246,463(0.00%)#3,595 |
| 77. | River Rouge | 25 | 24,230(0.10%)#77 | 2,246,463(0.00%)#3,598 |
| 78. | Bronson | 25 | 24,230(0.10%)#78 | 2,246,463(0.00%)#3,615 |
| 79. | Croswell | 24 | 24,230(0.10%)#79 | 2,246,463(0.00%)#3,662 |
| 80. | Flat Rock | 20 | 24,230(0.08%)#80 | 2,246,463(0.00%)#3,829 |
| 81. | Mount Pleasant | 19 | 24,230(0.08%)#81 | 2,246,463(0.00%)#3,865 |
| 82. | Wyandotte | 17 | 24,230(0.07%)#82 | 2,246,463(0.00%)#3,981 |
| 83. | Harper Woods | 17 | 24,230(0.07%)#83 | 2,246,463(0.00%)#3,986 |
| 84. | Beechwood | 17 | 24,230(0.07%)#84 | 2,246,463(0.00%)#4,019 |
| 85. | Manitou Beach Devils Lake | 17 | 24,230(0.07%)#85 | 2,246,463(0.00%)#4,030 |
| 86. | Garden City | 16 | 24,230(0.07%)#86 | 2,246,463(0.00%)#4,044 |
| 87. | Houghton | 16 | 24,230(0.07%)#87 | 2,246,463(0.00%)#4,074 |
| 88. | East Jordan | 16 | 24,230(0.07%)#88 | 2,246,463(0.00%)#4,101 |
| 89. | Rochester | 14 | 24,230(0.06%)#89 | 2,246,463(0.00%)#4,188 |
| 90. | Temperance | 13 | 24,230(0.05%)#90 | 2,246,463(0.00%)#4,260 |
| 91. | Milan | 13 | 24,230(0.05%)#91 | 2,246,463(0.00%)#4,268 |
| 92. | Hancock | 13 | 24,230(0.05%)#92 | 2,246,463(0.00%)#4,274 |
| 93. | Fowlerville | 13 | 24,230(0.05%)#93 | 2,246,463(0.00%)#4,289 |
| 94. | Parchment | 13 | 24,230(0.05%)#94 | 2,246,463(0.00%)#4,296 |
| 95. | Marquette | 12 | 24,230(0.05%)#95 | 2,246,463(0.00%)#4,325 |
| 96. | Wayne | 12 | 24,230(0.05%)#96 | 2,246,463(0.00%)#4,329 |
| 97. | Manistee | 12 | 24,230(0.05%)#97 | 2,246,463(0.00%)#4,365 |
| 98. | Harvey | 12 | 24,230(0.05%)#98 | 2,246,463(0.00%)#4,382 |
| 99. | Farmington | 11 | 24,230(0.05%)#99 | 2,246,463(0.00%)#4,430 |
| 100. | St Louis | 11 | 24,230(0.05%)#100 | 2,246,463(0.00%)#4,443 |
Common Questions
What are the Top 10 Cities with the Largest Sri Lankan Community in Michigan?
Top 10 Cities with the Largest Sri Lankan Community in Michigan are:
#1
1,562
#2
1,036
#3
977
#4
869
#5
860
#6
771
#7
684
#8
612
#9
608
#10
577
What city has the Largest Sri Lankan Community in Michigan?
Kentwood has the Largest Sri Lankan Community in Michigan with 1,562.
What is the Total Sri Lankan Population in the State of Michigan?
Total Sri Lankan Population in Michigan is 24,230.
What is the Total Sri Lankan Population in the United States?
Total Sri Lankan Population in the United States is 2,246,463.