Zip Codes with the Highest Percentage of Population with a Degree in Communications in Washington
RELATED REPORTS & OPTIONS
Communications
Washington
Compare Zip Codes
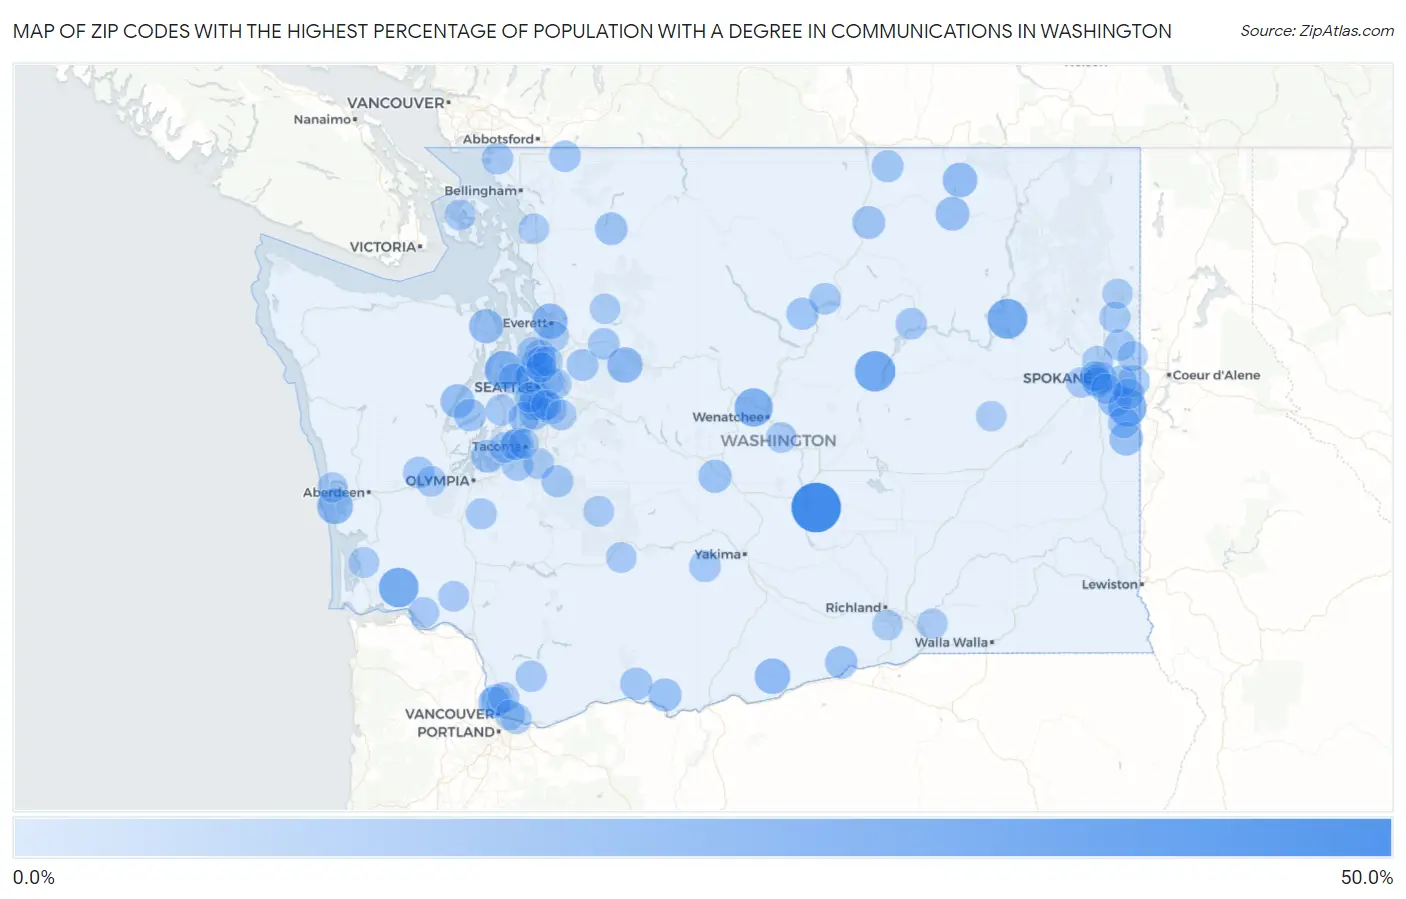
Map of Zip Codes with the Highest Percentage of Population with a Degree in Communications in Washington
0.0%
50.0%
Zip Codes with the Highest Percentage of Population with a Degree in Communications in Washington
| Zip Code | % Graduates | vs State | vs National | |
| 1. | 99321 | 43.4% | 3.9%(+39.5)#1 | 4.1%(+39.3)#72 |
| 2. | 99115 | 24.8% | 3.9%(+20.9)#2 | 4.1%(+20.7)#223 |
| 3. | 99129 | 23.7% | 3.9%(+19.8)#3 | 4.1%(+19.6)#240 |
| 4. | 98621 | 23.3% | 3.9%(+19.3)#4 | 4.1%(+19.1)#244 |
| 5. | 98836 | 20.4% | 3.9%(+16.5)#5 | 4.1%(+16.3)#320 |
| 6. | 98345 | 20.3% | 3.9%(+16.4)#6 | 4.1%(+16.2)#324 |
| 7. | 99030 | 20.2% | 3.9%(+16.3)#7 | 4.1%(+16.1)#325 |
| 8. | 98595 | 15.6% | 3.9%(+11.6)#8 | 4.1%(+11.4)#525 |
| 9. | 99356 | 15.2% | 3.9%(+11.2)#9 | 4.1%(+11.0)#540 |
| 10. | 98224 | 15.0% | 3.9%(+11.1)#10 | 4.1%(+10.9)#551 |
| 11. | 98207 | 14.7% | 3.9%(+10.8)#11 | 4.1%(+10.6)#567 |
| 12. | 99150 | 13.5% | 3.9%(+9.57)#12 | 4.1%(+9.38)#658 |
| 13. | 98325 | 12.9% | 3.9%(+8.92)#13 | 4.1%(+8.72)#719 |
| 14. | 98555 | 12.2% | 3.9%(+8.22)#14 | 4.1%(+8.03)#797 |
| 15. | 99166 | 12.0% | 3.9%(+8.08)#15 | 4.1%(+7.89)#819 |
| 16. | 99036 | 11.7% | 3.9%(+7.81)#16 | 4.1%(+7.61)#860 |
| 17. | 99018 | 11.4% | 3.9%(+7.42)#17 | 4.1%(+7.23)#921 |
| 18. | 98946 | 10.4% | 3.9%(+6.45)#18 | 4.1%(+6.25)#1,074 |
| 19. | 98635 | 10.4% | 3.9%(+6.42)#19 | 4.1%(+6.23)#1,078 |
| 20. | 98849 | 10.0% | 3.9%(+6.06)#20 | 4.1%(+5.86)#1,138 |
| 21. | 98351 | 9.8% | 3.9%(+5.89)#21 | 4.1%(+5.70)#1,188 |
| 22. | 98237 | 9.4% | 3.9%(+5.47)#22 | 4.1%(+5.28)#1,296 |
| 23. | 99345 | 9.4% | 3.9%(+5.43)#23 | 4.1%(+5.24)#1,311 |
| 24. | 98528 | 9.1% | 3.9%(+5.19)#24 | 4.1%(+5.00)#1,383 |
| 25. | 98672 | 8.8% | 3.9%(+4.86)#25 | 4.1%(+4.67)#1,509 |
| 26. | 98846 | 8.6% | 3.9%(+4.65)#26 | 4.1%(+4.45)#1,596 |
| 27. | 98844 | 8.3% | 3.9%(+4.41)#27 | 4.1%(+4.21)#1,700 |
| 28. | 99019 | 8.0% | 3.9%(+4.07)#28 | 4.1%(+3.88)#1,872 |
| 29. | 98360 | 7.9% | 3.9%(+3.98)#29 | 4.1%(+3.78)#1,930 |
| 30. | 98019 | 7.7% | 3.9%(+3.79)#30 | 4.1%(+3.60)#2,037 |
| 31. | 98903 | 7.7% | 3.9%(+3.73)#31 | 4.1%(+3.54)#2,082 |
| 32. | 98812 | 7.6% | 3.9%(+3.68)#32 | 4.1%(+3.48)#2,118 |
| 33. | 98439 | 7.5% | 3.9%(+3.56)#33 | 4.1%(+3.37)#2,185 |
| 34. | 99012 | 7.5% | 3.9%(+3.53)#34 | 4.1%(+3.33)#2,218 |
| 35. | 98166 | 7.5% | 3.9%(+3.52)#35 | 4.1%(+3.32)#2,231 |
| 36. | 98266 | 7.4% | 3.9%(+3.43)#36 | 4.1%(+3.24)#2,285 |
| 37. | 98294 | 7.3% | 3.9%(+3.39)#37 | 4.1%(+3.20)#2,314 |
| 38. | 99133 | 7.3% | 3.9%(+3.37)#38 | 4.1%(+3.17)#2,333 |
| 39. | 98541 | 7.2% | 3.9%(+3.29)#39 | 4.1%(+3.09)#2,416 |
| 40. | 98230 | 7.2% | 3.9%(+3.25)#40 | 4.1%(+3.06)#2,438 |
| 41. | 98685 | 7.2% | 3.9%(+3.23)#41 | 4.1%(+3.03)#2,459 |
| 42. | 98406 | 7.0% | 3.9%(+3.08)#42 | 4.1%(+2.89)#2,589 |
| 43. | 99037 | 7.0% | 3.9%(+3.07)#43 | 4.1%(+2.88)#2,597 |
| 44. | 98660 | 7.0% | 3.9%(+3.01)#44 | 4.1%(+2.82)#2,648 |
| 45. | 98675 | 6.8% | 3.9%(+2.86)#45 | 4.1%(+2.67)#2,790 |
| 46. | 98367 | 6.8% | 3.9%(+2.82)#46 | 4.1%(+2.63)#2,829 |
| 47. | 99021 | 6.7% | 3.9%(+2.74)#47 | 4.1%(+2.54)#2,930 |
| 48. | 99202 | 6.6% | 3.9%(+2.68)#48 | 4.1%(+2.49)#2,990 |
| 49. | 98106 | 6.5% | 3.9%(+2.61)#49 | 4.1%(+2.41)#3,074 |
| 50. | 99009 | 6.5% | 3.9%(+2.55)#50 | 4.1%(+2.36)#3,145 |
| 51. | 98589 | 6.2% | 3.9%(+2.30)#51 | 4.1%(+2.11)#3,436 |
| 52. | 98168 | 6.1% | 3.9%(+2.18)#52 | 4.1%(+1.98)#3,602 |
| 53. | 98373 | 6.1% | 3.9%(+2.17)#53 | 4.1%(+1.98)#3,613 |
| 54. | 98057 | 6.1% | 3.9%(+2.16)#54 | 4.1%(+1.97)#3,628 |
| 55. | 99218 | 6.1% | 3.9%(+2.15)#55 | 4.1%(+1.95)#3,646 |
| 56. | 98586 | 6.0% | 3.9%(+2.10)#56 | 4.1%(+1.90)#3,718 |
| 57. | 98146 | 6.0% | 3.9%(+2.09)#57 | 4.1%(+1.90)#3,727 |
| 58. | 99023 | 6.0% | 3.9%(+2.06)#58 | 4.1%(+1.86)#3,777 |
| 59. | 98304 | 6.0% | 3.9%(+2.02)#59 | 4.1%(+1.83)#3,835 |
| 60. | 98243 | 6.0% | 3.9%(+2.01)#60 | 4.1%(+1.82)#3,854 |
| 61. | 98043 | 5.9% | 3.9%(+1.95)#61 | 4.1%(+1.75)#3,953 |
| 62. | 98070 | 5.9% | 3.9%(+1.93)#62 | 4.1%(+1.74)#3,989 |
| 63. | 98199 | 5.9% | 3.9%(+1.93)#63 | 4.1%(+1.74)#3,995 |
| 64. | 98612 | 5.9% | 3.9%(+1.92)#64 | 4.1%(+1.73)#4,015 |
| 65. | 98683 | 5.9% | 3.9%(+1.92)#65 | 4.1%(+1.72)#4,023 |
| 66. | 98333 | 5.8% | 3.9%(+1.89)#66 | 4.1%(+1.70)#4,056 |
| 67. | 98107 | 5.8% | 3.9%(+1.86)#67 | 4.1%(+1.67)#4,105 |
| 68. | 98686 | 5.8% | 3.9%(+1.86)#68 | 4.1%(+1.66)#4,113 |
| 69. | 98828 | 5.8% | 3.9%(+1.84)#69 | 4.1%(+1.65)#4,138 |
| 70. | 98133 | 5.7% | 3.9%(+1.77)#70 | 4.1%(+1.58)#4,245 |
| 71. | 98020 | 5.7% | 3.9%(+1.72)#71 | 4.1%(+1.52)#4,346 |
| 72. | 98361 | 5.6% | 3.9%(+1.69)#72 | 4.1%(+1.50)#4,390 |
| 73. | 98039 | 5.6% | 3.9%(+1.68)#73 | 4.1%(+1.48)#4,411 |
| 74. | 98557 | 5.6% | 3.9%(+1.66)#74 | 4.1%(+1.47)#4,439 |
| 75. | 98581 | 5.6% | 3.9%(+1.61)#75 | 4.1%(+1.42)#4,550 |
| 76. | 99204 | 5.6% | 3.9%(+1.61)#76 | 4.1%(+1.42)#4,559 |
| 77. | 98233 | 5.5% | 3.9%(+1.57)#77 | 4.1%(+1.38)#4,617 |
| 78. | 99338 | 5.5% | 3.9%(+1.56)#78 | 4.1%(+1.37)#4,634 |
| 79. | 98465 | 5.5% | 3.9%(+1.53)#79 | 4.1%(+1.34)#4,688 |
| 80. | 98110 | 5.4% | 3.9%(+1.49)#80 | 4.1%(+1.30)#4,766 |
| 81. | 99224 | 5.4% | 3.9%(+1.49)#81 | 4.1%(+1.29)#4,790 |
| 82. | 98208 | 5.4% | 3.9%(+1.45)#82 | 4.1%(+1.25)#4,868 |
| 83. | 99203 | 5.4% | 3.9%(+1.44)#83 | 4.1%(+1.25)#4,886 |
| 84. | 99201 | 5.4% | 3.9%(+1.42)#84 | 4.1%(+1.23)#4,921 |
| 85. | 98005 | 5.3% | 3.9%(+1.38)#85 | 4.1%(+1.19)#4,986 |
| 86. | 98664 | 5.3% | 3.9%(+1.38)#86 | 4.1%(+1.19)#4,992 |
| 87. | 98155 | 5.3% | 3.9%(+1.37)#87 | 4.1%(+1.17)#5,028 |
| 88. | 98136 | 5.3% | 3.9%(+1.36)#88 | 4.1%(+1.16)#5,044 |
| 89. | 98178 | 5.2% | 3.9%(+1.26)#89 | 4.1%(+1.07)#5,247 |
| 90. | 99323 | 5.2% | 3.9%(+1.26)#90 | 4.1%(+1.06)#5,260 |
| 91. | 98058 | 5.2% | 3.9%(+1.24)#91 | 4.1%(+1.05)#5,284 |
| 92. | 99025 | 5.2% | 3.9%(+1.24)#92 | 4.1%(+1.04)#5,290 |
| 93. | 98028 | 5.2% | 3.9%(+1.21)#93 | 4.1%(+1.02)#5,340 |
| 94. | 98403 | 5.1% | 3.9%(+1.20)#94 | 4.1%(+1.01)#5,362 |
| 95. | 98252 | 5.1% | 3.9%(+1.20)#95 | 4.1%(+1.01)#5,372 |
| 96. | 98569 | 5.1% | 3.9%(+1.18)#96 | 4.1%(+0.982)#5,422 |
| 97. | 99134 | 5.1% | 3.9%(+1.17)#97 | 4.1%(+0.974)#5,442 |
| 98. | 99156 | 5.1% | 3.9%(+1.16)#98 | 4.1%(+0.970)#5,452 |
| 99. | 98125 | 5.0% | 3.9%(+1.10)#99 | 4.1%(+0.909)#5,591 |
| 100. | 99223 | 5.0% | 3.9%(+1.09)#100 | 4.1%(+0.895)#5,619 |
Common Questions
What are the Top 10 Zip Codes with the Highest Percentage of Population with a Degree in Communications in Washington?
Top 10 Zip Codes with the Highest Percentage of Population with a Degree in Communications in Washington are:
What zip code has the Highest Percentage of Population with a Degree in Communications in Washington?
99321 has the Highest Percentage of Population with a Degree in Communications in Washington with 43.4%.
What is the Percentage of Population with a Degree in Communications in the State of Washington?
Percentage of Population with a Degree in Communications in Washington is 3.9%.
What is the Percentage of Population with a Degree in Communications in the United States?
Percentage of Population with a Degree in Communications in the United States is 4.1%.