Cities with the Lowest Unemployment Rate Amomg Youth Under the Age of 25 in Iowa
RELATED REPORTS & OPTIONS
Lowest Unemployment | Youth < 25
Iowa
Compare Cities
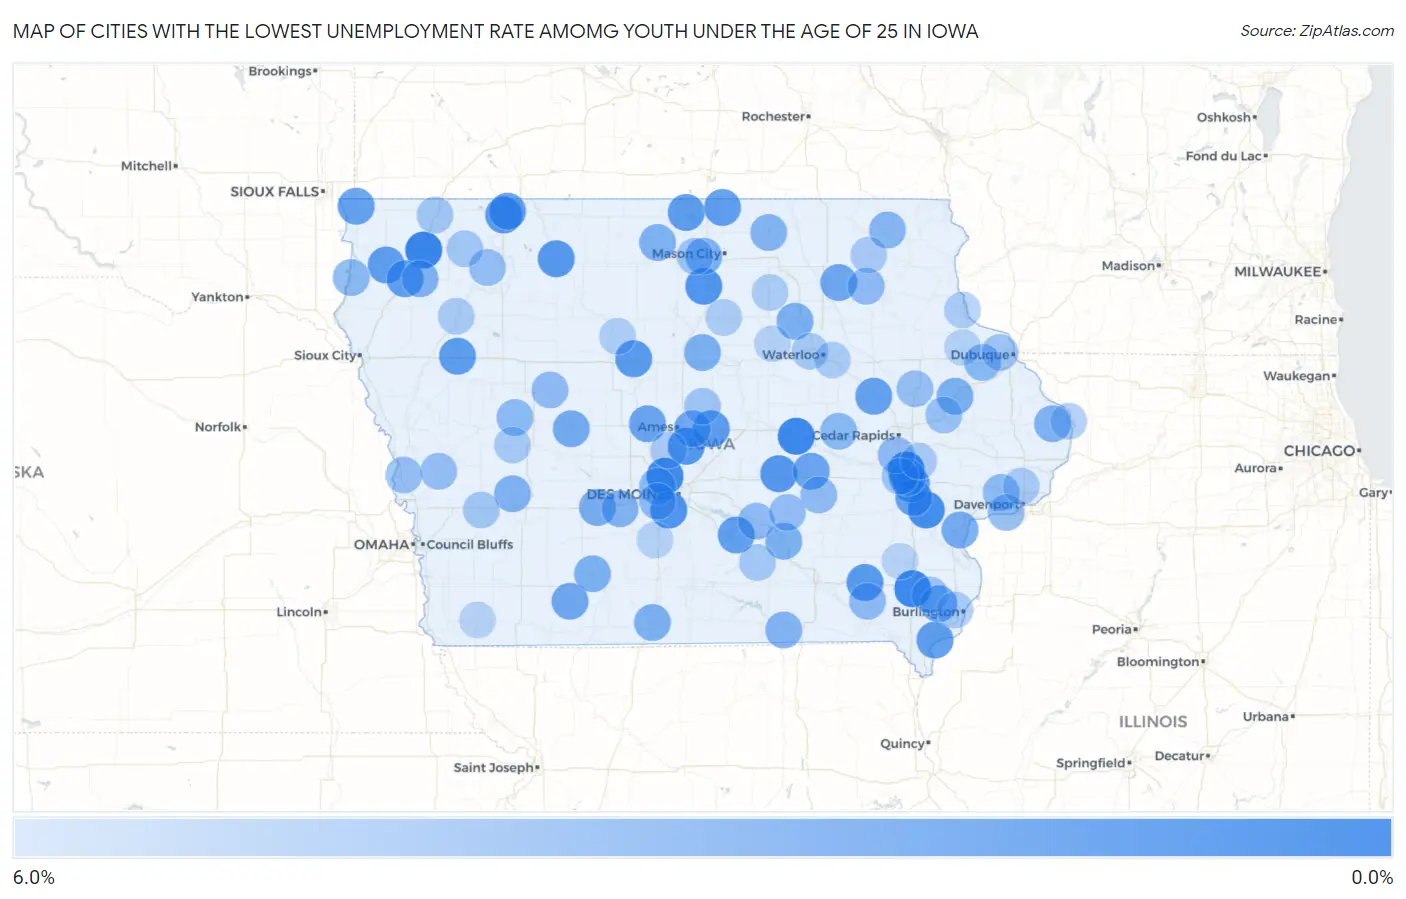
Map of Cities with the Lowest Unemployment Rate Amomg Youth Under the Age of 25 in Iowa
6.0%
0.0%
Cities with the Lowest Unemployment Rate Amomg Youth Under the Age of 25 in Iowa
| City | Youth Unemployment | vs State | vs National | |
| 1. | North Liberty | 0.20% | 7.9%(-7.70)#1 | 10.9%(-10.7)#2 |
| 2. | Sheldon | 0.20% | 7.9%(-7.70)#2 | 10.9%(-10.7)#10 |
| 3. | Mount Pleasant | 0.40% | 7.9%(-7.50)#3 | 10.9%(-10.5)#25 |
| 4. | Tama | 0.40% | 7.9%(-7.50)#4 | 10.9%(-10.5)#34 |
| 5. | Johnston | 0.50% | 7.9%(-7.40)#5 | 10.9%(-10.4)#39 |
| 6. | Lone Tree | 0.70% | 7.9%(-7.20)#6 | 10.9%(-10.2)#76 |
| 7. | Norwalk | 1.1% | 7.9%(-6.80)#7 | 10.9%(-9.80)#144 |
| 8. | Thornton | 1.2% | 7.9%(-6.70)#8 | 10.9%(-9.70)#187 |
| 9. | Cambridge | 1.3% | 7.9%(-6.60)#9 | 10.9%(-9.60)#209 |
| 10. | Grinnell | 1.4% | 7.9%(-6.50)#10 | 10.9%(-9.50)#219 |
| 11. | Emmetsburg | 1.5% | 7.9%(-6.40)#11 | 10.9%(-9.40)#253 |
| 12. | University Heights | 1.5% | 7.9%(-6.40)#12 | 10.9%(-9.40)#266 |
| 13. | Okoboji | 1.5% | 7.9%(-6.40)#13 | 10.9%(-9.40)#274 |
| 14. | Fairfield | 1.6% | 7.9%(-6.30)#14 | 10.9%(-9.30)#280 |
| 15. | Duncombe | 1.6% | 7.9%(-6.30)#15 | 10.9%(-9.30)#301 |
| 16. | Fort Madison | 1.7% | 7.9%(-6.20)#16 | 10.9%(-9.20)#318 |
| 17. | Sioux Center | 1.7% | 7.9%(-6.20)#17 | 10.9%(-9.20)#320 |
| 18. | Lake Mills | 1.7% | 7.9%(-6.20)#18 | 10.9%(-9.20)#337 |
| 19. | Holstein | 1.7% | 7.9%(-6.20)#19 | 10.9%(-9.20)#340 |
| 20. | Colo | 1.7% | 7.9%(-6.20)#20 | 10.9%(-9.20)#347 |
| 21. | Spirit Lake | 1.8% | 7.9%(-6.10)#21 | 10.9%(-9.10)#372 |
| 22. | Northwood | 1.8% | 7.9%(-6.10)#22 | 10.9%(-9.10)#386 |
| 23. | Alton | 1.8% | 7.9%(-6.10)#23 | 10.9%(-9.10)#392 |
| 24. | Knoxville | 1.9% | 7.9%(-6.00)#24 | 10.9%(-9.00)#408 |
| 25. | Urbana | 2.0% | 7.9%(-5.90)#25 | 10.9%(-8.90)#472 |
| 26. | Larchwood | 2.1% | 7.9%(-5.80)#26 | 10.9%(-8.80)#523 |
| 27. | Hills | 2.1% | 7.9%(-5.80)#27 | 10.9%(-8.80)#524 |
| 28. | Boone | 2.2% | 7.9%(-5.70)#28 | 10.9%(-8.70)#534 |
| 29. | Brooklyn | 2.2% | 7.9%(-5.70)#29 | 10.9%(-8.70)#566 |
| 30. | Danville | 2.3% | 7.9%(-5.60)#30 | 10.9%(-8.60)#624 |
| 31. | Lenox | 2.4% | 7.9%(-5.50)#31 | 10.9%(-8.50)#685 |
| 32. | Fredericksburg | 2.4% | 7.9%(-5.50)#32 | 10.9%(-8.50)#691 |
| 33. | Nevada | 2.5% | 7.9%(-5.40)#33 | 10.9%(-8.40)#715 |
| 34. | Scranton | 2.6% | 7.9%(-5.30)#34 | 10.9%(-8.30)#820 |
| 35. | Fruitland | 2.7% | 7.9%(-5.20)#35 | 10.9%(-8.20)#874 |
| 36. | Coralville | 2.8% | 7.9%(-5.10)#36 | 10.9%(-8.10)#897 |
| 37. | Stuart | 2.8% | 7.9%(-5.10)#37 | 10.9%(-8.10)#936 |
| 38. | Clear Lake | 2.9% | 7.9%(-5.00)#38 | 10.9%(-8.00)#970 |
| 39. | Monticello | 2.9% | 7.9%(-5.00)#39 | 10.9%(-8.00)#979 |
| 40. | Shell Rock | 2.9% | 7.9%(-5.00)#40 | 10.9%(-8.00)#994 |
| 41. | Alden | 2.9% | 7.9%(-5.00)#41 | 10.9%(-8.00)#1,005 |
| 42. | Creston | 3.0% | 7.9%(-4.90)#42 | 10.9%(-7.90)#1,027 |
| 43. | Beacon | 3.0% | 7.9%(-4.90)#43 | 10.9%(-7.90)#1,067 |
| 44. | Decatur City | 3.0% | 7.9%(-4.90)#44 | 10.9%(-7.90)#1,069 |
| 45. | Elk Horn | 3.1% | 7.9%(-4.80)#45 | 10.9%(-7.80)#1,139 |
| 46. | Miles | 3.1% | 7.9%(-4.80)#46 | 10.9%(-7.80)#1,144 |
| 47. | Granville | 3.1% | 7.9%(-4.80)#47 | 10.9%(-7.80)#1,147 |
| 48. | Crystal Lake | 3.1% | 7.9%(-4.80)#48 | 10.9%(-7.80)#1,149 |
| 49. | Earlham | 3.2% | 7.9%(-4.70)#49 | 10.9%(-7.70)#1,208 |
| 50. | Osage | 3.3% | 7.9%(-4.60)#50 | 10.9%(-7.60)#1,254 |
| 51. | Moulton | 3.3% | 7.9%(-4.60)#51 | 10.9%(-7.60)#1,277 |
| 52. | Decorah | 3.4% | 7.9%(-4.50)#52 | 10.9%(-7.50)#1,306 |
| 53. | Urbandale | 3.5% | 7.9%(-4.40)#53 | 10.9%(-7.40)#1,349 |
| 54. | Hawarden | 3.5% | 7.9%(-4.40)#54 | 10.9%(-7.40)#1,381 |
| 55. | Epworth | 3.5% | 7.9%(-4.40)#55 | 10.9%(-7.40)#1,387 |
| 56. | Keystone | 3.5% | 7.9%(-4.40)#56 | 10.9%(-7.40)#1,401 |
| 57. | West Des Moines | 3.6% | 7.9%(-4.30)#57 | 10.9%(-7.30)#1,416 |
| 58. | Walcott | 3.6% | 7.9%(-4.30)#58 | 10.9%(-7.30)#1,459 |
| 59. | Arcadia | 3.6% | 7.9%(-4.30)#59 | 10.9%(-7.30)#1,467 |
| 60. | Lake City | 3.7% | 7.9%(-4.20)#60 | 10.9%(-7.20)#1,514 |
| 61. | Birmingham | 3.7% | 7.9%(-4.20)#61 | 10.9%(-7.20)#1,537 |
| 62. | Hawkeye | 3.7% | 7.9%(-4.20)#62 | 10.9%(-7.20)#1,538 |
| 63. | Pella | 3.8% | 7.9%(-4.10)#63 | 10.9%(-7.10)#1,558 |
| 64. | Swisher | 3.8% | 7.9%(-4.10)#64 | 10.9%(-7.10)#1,599 |
| 65. | Buffalo | 3.8% | 7.9%(-4.10)#65 | 10.9%(-7.10)#1,601 |
| 66. | Deep River | 3.8% | 7.9%(-4.10)#66 | 10.9%(-7.10)#1,610 |
| 67. | Woodbine | 3.9% | 7.9%(-4.00)#67 | 10.9%(-7.00)#1,653 |
| 68. | New Sharon | 3.9% | 7.9%(-4.00)#68 | 10.9%(-7.00)#1,656 |
| 69. | Royal | 3.9% | 7.9%(-4.00)#69 | 10.9%(-7.00)#1,666 |
| 70. | Coggon | 4.0% | 7.9%(-3.90)#70 | 10.9%(-6.90)#1,735 |
| 71. | Mondamin | 4.0% | 7.9%(-3.90)#71 | 10.9%(-6.90)#1,746 |
| 72. | Anamosa | 4.2% | 7.9%(-3.70)#72 | 10.9%(-6.70)#1,844 |
| 73. | Tiffin | 4.3% | 7.9%(-3.60)#73 | 10.9%(-6.60)#1,912 |
| 74. | New London | 4.3% | 7.9%(-3.60)#74 | 10.9%(-6.60)#1,922 |
| 75. | Ventura | 4.3% | 7.9%(-3.60)#75 | 10.9%(-6.60)#1,939 |
| 76. | Asbury | 4.4% | 7.9%(-3.50)#76 | 10.9%(-6.50)#1,982 |
| 77. | Mccallsburg | 4.4% | 7.9%(-3.50)#77 | 10.9%(-6.50)#2,020 |
| 78. | Sibley | 4.5% | 7.9%(-3.40)#78 | 10.9%(-6.40)#2,068 |
| 79. | Hartley | 4.5% | 7.9%(-3.40)#79 | 10.9%(-6.40)#2,076 |
| 80. | Avoca | 4.5% | 7.9%(-3.40)#80 | 10.9%(-6.40)#2,077 |
| 81. | Lovilia | 4.6% | 7.9%(-3.30)#81 | 10.9%(-6.30)#2,168 |
| 82. | Cedar Falls | 4.7% | 7.9%(-3.20)#82 | 10.9%(-6.20)#2,177 |
| 83. | Manning | 4.7% | 7.9%(-3.20)#83 | 10.9%(-6.20)#2,231 |
| 84. | Eldridge | 4.8% | 7.9%(-3.10)#84 | 10.9%(-6.10)#2,283 |
| 85. | Cherokee | 4.8% | 7.9%(-3.10)#85 | 10.9%(-6.10)#2,285 |
| 86. | West Burlington | 4.8% | 7.9%(-3.10)#86 | 10.9%(-6.10)#2,293 |
| 87. | Solon | 4.8% | 7.9%(-3.10)#87 | 10.9%(-6.10)#2,294 |
| 88. | Slater | 4.8% | 7.9%(-3.10)#88 | 10.9%(-6.10)#2,313 |
| 89. | Sabula | 4.8% | 7.9%(-3.10)#89 | 10.9%(-6.10)#2,326 |
| 90. | Fort Atkinson | 4.8% | 7.9%(-3.10)#90 | 10.9%(-6.10)#2,329 |
| 91. | Hampton | 4.9% | 7.9%(-3.00)#91 | 10.9%(-6.00)#2,362 |
| 92. | Guttenberg | 4.9% | 7.9%(-3.00)#92 | 10.9%(-6.00)#2,377 |
| 93. | Greene | 4.9% | 7.9%(-3.00)#93 | 10.9%(-6.00)#2,383 |
| 94. | Elk Run Heights | 4.9% | 7.9%(-3.00)#94 | 10.9%(-6.00)#2,390 |
| 95. | Badger | 5.0% | 7.9%(-2.90)#95 | 10.9%(-5.90)#2,457 |
| 96. | St Charles | 5.2% | 7.9%(-2.70)#96 | 10.9%(-5.70)#2,599 |
| 97. | New Vienna | 5.2% | 7.9%(-2.70)#97 | 10.9%(-5.70)#2,614 |
| 98. | Shenandoah | 5.3% | 7.9%(-2.60)#98 | 10.9%(-5.60)#2,655 |
| 99. | Parkersburg | 5.3% | 7.9%(-2.60)#99 | 10.9%(-5.60)#2,679 |
| 100. | Wayland | 5.3% | 7.9%(-2.60)#100 | 10.9%(-5.60)#2,685 |
Common Questions
What are the Top 10 Cities with the Lowest Unemployment Rate Amomg Youth Under the Age of 25 in Iowa?
Top 10 Cities with the Lowest Unemployment Rate Amomg Youth Under the Age of 25 in Iowa are:
#1
0.20%
#2
0.20%
#3
0.40%
#4
0.40%
#5
0.50%
#6
0.70%
#7
1.1%
#8
1.2%
#9
1.3%
#10
1.4%
What city has the Lowest Unemployment Rate Amomg Youth Under the Age of 25 in Iowa?
North Liberty has the Lowest Unemployment Rate Amomg Youth Under the Age of 25 in Iowa with 0.20%.
What is the Unemployment Rate Amomg Youth Under the Age of 25 in the State of Iowa?
Unemployment Rate Amomg Youth Under the Age of 25 in Iowa is 7.9%.
What is the Unemployment Rate Amomg Youth Under the Age of 25 in the United States?
Unemployment Rate Amomg Youth Under the Age of 25 in the United States is 10.9%.