Cities with the Lowest Unemployment Rate Amomg Youth Under the Age of 25 in Missouri
RELATED REPORTS & OPTIONS
Lowest Unemployment | Youth < 25
Missouri
Compare Cities
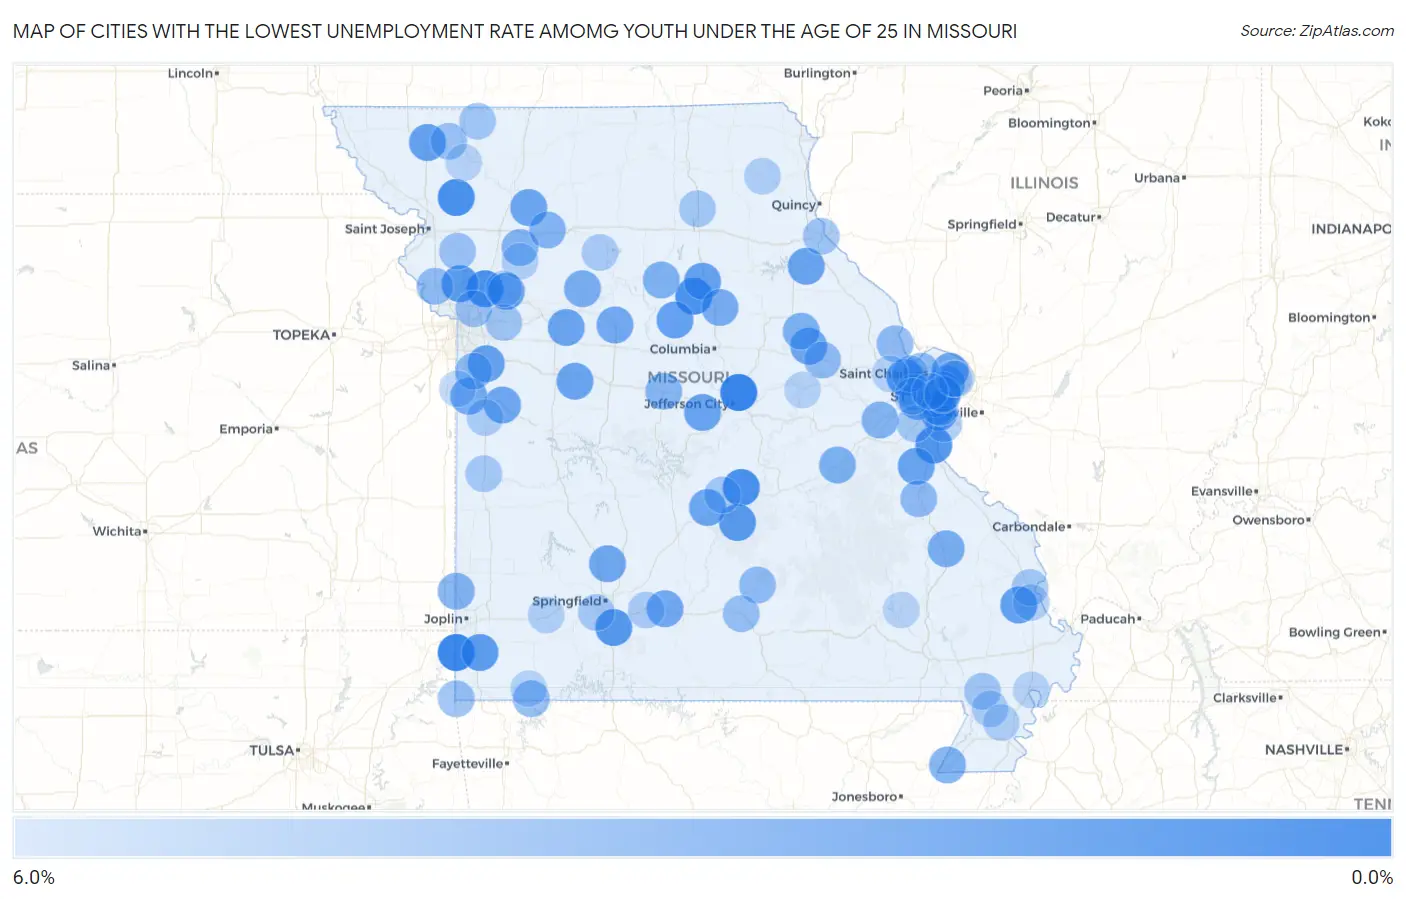
Map of Cities with the Lowest Unemployment Rate Amomg Youth Under the Age of 25 in Missouri
6.0%
0.0%
Cities with the Lowest Unemployment Rate Amomg Youth Under the Age of 25 in Missouri
| City | Youth Unemployment | vs State | vs National | |
| 1. | Holts Summit | 0.40% | 8.7%(-8.30)#1 | 10.9%(-10.5)#32 |
| 2. | Seneca | 0.50% | 8.7%(-8.20)#2 | 10.9%(-10.4)#48 |
| 3. | Dixon | 1.0% | 8.7%(-7.70)#3 | 10.9%(-9.90)#138 |
| 4. | Kearney | 1.1% | 8.7%(-7.60)#4 | 10.9%(-9.80)#149 |
| 5. | Higbee | 1.1% | 8.7%(-7.60)#5 | 10.9%(-9.80)#161 |
| 6. | Union Star | 1.1% | 8.7%(-7.60)#6 | 10.9%(-9.80)#163 |
| 7. | Pevely | 1.4% | 8.7%(-7.30)#7 | 10.9%(-9.50)#225 |
| 8. | Ozark | 1.6% | 8.7%(-7.10)#8 | 10.9%(-9.30)#276 |
| 9. | Fort Leonard Wood | 1.7% | 8.7%(-7.00)#9 | 10.9%(-9.20)#310 |
| 10. | Smithville | 1.7% | 8.7%(-7.00)#10 | 10.9%(-9.20)#316 |
| 11. | Cottleville | 1.7% | 8.7%(-7.00)#11 | 10.9%(-9.20)#326 |
| 12. | Neosho | 1.8% | 8.7%(-6.90)#12 | 10.9%(-9.10)#358 |
| 13. | Chaffee | 2.0% | 8.7%(-6.70)#13 | 10.9%(-8.90)#463 |
| 14. | Fayette | 2.1% | 8.7%(-6.60)#14 | 10.9%(-8.80)#513 |
| 15. | Moberly | 2.2% | 8.7%(-6.50)#15 | 10.9%(-8.70)#533 |
| 16. | Maryville | 2.2% | 8.7%(-6.50)#16 | 10.9%(-8.70)#536 |
| 17. | Greenwood | 2.2% | 8.7%(-6.50)#17 | 10.9%(-8.70)#549 |
| 18. | Wood Heights | 2.2% | 8.7%(-6.50)#18 | 10.9%(-8.70)#573 |
| 19. | Concord | 2.3% | 8.7%(-6.40)#19 | 10.9%(-8.60)#582 |
| 20. | Crestwood | 2.3% | 8.7%(-6.40)#20 | 10.9%(-8.60)#591 |
| 21. | De Soto | 2.3% | 8.7%(-6.40)#21 | 10.9%(-8.60)#603 |
| 22. | Whiteman Afb | 2.3% | 8.7%(-6.40)#22 | 10.9%(-8.60)#610 |
| 23. | Russellville | 2.3% | 8.7%(-6.40)#23 | 10.9%(-8.60)#626 |
| 24. | Pasadena Park | 2.3% | 8.7%(-6.40)#24 | 10.9%(-8.60)#628 |
| 25. | Corder | 2.3% | 8.7%(-6.40)#25 | 10.9%(-8.60)#630 |
| 26. | Center | 2.3% | 8.7%(-6.40)#26 | 10.9%(-8.60)#633 |
| 27. | Ballwin | 2.4% | 8.7%(-6.30)#27 | 10.9%(-8.50)#636 |
| 28. | Montgomery City | 2.4% | 8.7%(-6.30)#28 | 10.9%(-8.50)#671 |
| 29. | Richland | 2.4% | 8.7%(-6.30)#29 | 10.9%(-8.50)#673 |
| 30. | Gallatin | 2.4% | 8.7%(-6.30)#30 | 10.9%(-8.50)#679 |
| 31. | Garden City | 2.5% | 8.7%(-6.20)#31 | 10.9%(-8.40)#743 |
| 32. | Pleasant Hope | 2.5% | 8.7%(-6.20)#32 | 10.9%(-8.40)#749 |
| 33. | Marshall | 2.6% | 8.7%(-6.10)#33 | 10.9%(-8.30)#767 |
| 34. | Black Jack | 2.6% | 8.7%(-6.10)#34 | 10.9%(-8.30)#778 |
| 35. | Seymour | 2.6% | 8.7%(-6.10)#35 | 10.9%(-8.30)#807 |
| 36. | Freeman | 2.7% | 8.7%(-6.00)#36 | 10.9%(-8.20)#887 |
| 37. | Sturgeon | 2.8% | 8.7%(-5.90)#37 | 10.9%(-8.10)#944 |
| 38. | Fredericktown | 2.9% | 8.7%(-5.80)#38 | 10.9%(-8.00)#976 |
| 39. | Carrollton | 2.9% | 8.7%(-5.80)#39 | 10.9%(-8.00)#983 |
| 40. | Bourbon | 3.0% | 8.7%(-5.70)#40 | 10.9%(-7.90)#1,051 |
| 41. | Wellsville | 3.0% | 8.7%(-5.70)#41 | 10.9%(-7.90)#1,057 |
| 42. | University City | 3.1% | 8.7%(-5.60)#42 | 10.9%(-7.80)#1,071 |
| 43. | Salisbury | 3.1% | 8.7%(-5.60)#43 | 10.9%(-7.80)#1,125 |
| 44. | Cardwell | 3.1% | 8.7%(-5.60)#44 | 10.9%(-7.80)#1,134 |
| 45. | Asbury | 3.1% | 8.7%(-5.60)#45 | 10.9%(-7.80)#1,136 |
| 46. | Kingston | 3.2% | 8.7%(-5.50)#46 | 10.9%(-7.70)#1,223 |
| 47. | Villa Ridge | 3.3% | 8.7%(-5.40)#47 | 10.9%(-7.60)#1,256 |
| 48. | Breckenridge | 3.3% | 8.7%(-5.40)#48 | 10.9%(-7.60)#1,279 |
| 49. | Tipton | 3.4% | 8.7%(-5.30)#49 | 10.9%(-7.50)#1,327 |
| 50. | St Charles | 3.6% | 8.7%(-5.10)#50 | 10.9%(-7.30)#1,415 |
| 51. | Raymore | 3.6% | 8.7%(-5.10)#51 | 10.9%(-7.30)#1,419 |
| 52. | Bonne Terre | 3.7% | 8.7%(-5.00)#52 | 10.9%(-7.20)#1,491 |
| 53. | Winfield | 3.7% | 8.7%(-5.00)#53 | 10.9%(-7.20)#1,515 |
| 54. | Seligman | 3.7% | 8.7%(-5.00)#54 | 10.9%(-7.20)#1,525 |
| 55. | Houston | 3.8% | 8.7%(-4.90)#55 | 10.9%(-7.10)#1,587 |
| 56. | High Hill | 3.8% | 8.7%(-4.90)#56 | 10.9%(-7.10)#1,611 |
| 57. | Tracy | 3.8% | 8.7%(-4.90)#57 | 10.9%(-7.10)#1,612 |
| 58. | Cabool | 4.0% | 8.7%(-4.70)#58 | 10.9%(-6.90)#1,716 |
| 59. | Southwest City | 4.0% | 8.7%(-4.70)#59 | 10.9%(-6.90)#1,732 |
| 60. | Gower | 4.1% | 8.7%(-4.60)#60 | 10.9%(-6.80)#1,794 |
| 61. | Glenaire | 4.1% | 8.7%(-4.60)#61 | 10.9%(-6.80)#1,805 |
| 62. | Ravenwood | 4.1% | 8.7%(-4.60)#62 | 10.9%(-6.80)#1,808 |
| 63. | Hannibal | 4.2% | 8.7%(-4.50)#63 | 10.9%(-6.70)#1,828 |
| 64. | Chesterfield | 4.3% | 8.7%(-4.40)#64 | 10.9%(-6.60)#1,883 |
| 65. | Malden | 4.3% | 8.7%(-4.40)#65 | 10.9%(-6.60)#1,914 |
| 66. | Buckner | 4.3% | 8.7%(-4.40)#66 | 10.9%(-6.60)#1,918 |
| 67. | Warson Woods | 4.3% | 8.7%(-4.40)#67 | 10.9%(-6.60)#1,926 |
| 68. | Grant City | 4.4% | 8.7%(-4.30)#68 | 10.9%(-6.50)#2,013 |
| 69. | Crocker | 4.4% | 8.7%(-4.30)#69 | 10.9%(-6.50)#2,014 |
| 70. | St Peters | 4.5% | 8.7%(-4.20)#70 | 10.9%(-6.40)#2,024 |
| 71. | Cape Girardeau | 4.5% | 8.7%(-4.20)#71 | 10.9%(-6.40)#2,028 |
| 72. | Atlanta | 4.5% | 8.7%(-4.20)#72 | 10.9%(-6.40)#2,093 |
| 73. | Oakville | 4.6% | 8.7%(-4.10)#73 | 10.9%(-6.30)#2,110 |
| 74. | Battlefield | 4.6% | 8.7%(-4.10)#74 | 10.9%(-6.30)#2,137 |
| 75. | Byrnes Mill | 4.6% | 8.7%(-4.10)#75 | 10.9%(-6.30)#2,150 |
| 76. | Rich Hill | 4.6% | 8.7%(-4.10)#76 | 10.9%(-6.30)#2,162 |
| 77. | Grantwood Village | 4.7% | 8.7%(-4.00)#77 | 10.9%(-6.20)#2,240 |
| 78. | Gideon | 4.7% | 8.7%(-4.00)#78 | 10.9%(-6.20)#2,244 |
| 79. | Fordland | 4.7% | 8.7%(-4.00)#79 | 10.9%(-6.20)#2,246 |
| 80. | Hale | 4.7% | 8.7%(-4.00)#80 | 10.9%(-6.20)#2,250 |
| 81. | Richmond Heights | 4.8% | 8.7%(-3.90)#81 | 10.9%(-6.10)#2,280 |
| 82. | Clarkson Valley | 4.8% | 8.7%(-3.90)#82 | 10.9%(-6.10)#2,300 |
| 83. | Archie | 4.8% | 8.7%(-3.90)#83 | 10.9%(-6.10)#2,315 |
| 84. | Clayton | 4.9% | 8.7%(-3.80)#84 | 10.9%(-6.00)#2,342 |
| 85. | Riverview | 4.9% | 8.7%(-3.80)#85 | 10.9%(-6.00)#2,366 |
| 86. | La Belle | 4.9% | 8.7%(-3.80)#86 | 10.9%(-6.00)#2,393 |
| 87. | Kelso | 4.9% | 8.7%(-3.80)#87 | 10.9%(-6.00)#2,395 |
| 88. | Wardell | 4.9% | 8.7%(-3.80)#88 | 10.9%(-6.00)#2,398 |
| 89. | Mount Vernon | 5.0% | 8.7%(-3.70)#89 | 10.9%(-5.90)#2,438 |
| 90. | Polo | 5.0% | 8.7%(-3.70)#90 | 10.9%(-5.90)#2,459 |
| 91. | Crystal Lakes | 5.0% | 8.7%(-3.70)#91 | 10.9%(-5.90)#2,460 |
| 92. | Bellefontaine Neighbors | 5.1% | 8.7%(-3.60)#92 | 10.9%(-5.80)#2,487 |
| 93. | Cleveland | 5.1% | 8.7%(-3.60)#93 | 10.9%(-5.80)#2,516 |
| 94. | Washburn | 5.1% | 8.7%(-3.60)#94 | 10.9%(-5.80)#2,520 |
| 95. | Gasconade | 5.1% | 8.7%(-3.60)#95 | 10.9%(-5.80)#2,526 |
| 96. | Creve Coeur | 5.2% | 8.7%(-3.50)#96 | 10.9%(-5.70)#2,539 |
| 97. | Lake St Louis | 5.2% | 8.7%(-3.50)#97 | 10.9%(-5.70)#2,540 |
| 98. | New Madrid | 5.2% | 8.7%(-3.50)#98 | 10.9%(-5.70)#2,576 |
| 99. | Piedmont | 5.2% | 8.7%(-3.50)#99 | 10.9%(-5.70)#2,577 |
| 100. | Stanberry | 5.2% | 8.7%(-3.50)#100 | 10.9%(-5.70)#2,593 |
Common Questions
What are the Top 10 Cities with the Lowest Unemployment Rate Amomg Youth Under the Age of 25 in Missouri?
Top 10 Cities with the Lowest Unemployment Rate Amomg Youth Under the Age of 25 in Missouri are:
#1
0.40%
#2
0.50%
#3
1.0%
#4
1.1%
#5
1.1%
#6
1.1%
#7
1.4%
#8
1.6%
#9
1.7%
#10
1.7%
What city has the Lowest Unemployment Rate Amomg Youth Under the Age of 25 in Missouri?
Holts Summit has the Lowest Unemployment Rate Amomg Youth Under the Age of 25 in Missouri with 0.40%.
What is the Unemployment Rate Amomg Youth Under the Age of 25 in the State of Missouri?
Unemployment Rate Amomg Youth Under the Age of 25 in Missouri is 8.7%.
What is the Unemployment Rate Amomg Youth Under the Age of 25 in the United States?
Unemployment Rate Amomg Youth Under the Age of 25 in the United States is 10.9%.