Kettle Falls, WA Map & Demographics
Kettle Falls Map
Kettle Falls Overview
$29,720
PER CAPITA INCOME
$79,934
AVG FAMILY INCOME
$48,690
AVG HOUSEHOLD INCOME
38.1%
WAGE / INCOME GAP [ % ]
61.9¢/ $1
WAGE / INCOME GAP [ $ ]
0.41
INEQUALITY / GINI INDEX
1,598
TOTAL POPULATION
835
MALE POPULATION
763
FEMALE POPULATION
109.44
MALES / 100 FEMALES
91.38
FEMALES / 100 MALES
44.2
MEDIAN AGE
3.0
AVG FAMILY SIZE
2.2
AVG HOUSEHOLD SIZE
679
LABOR FORCE [ PEOPLE ]
53.0%
PERCENT IN LABOR FORCE
6.2%
UNEMPLOYMENT RATE
Kettle Falls Zip Codes
Kettle Falls Area Codes
Income in Kettle Falls
Income Overview in Kettle Falls
Per Capita Income in Kettle Falls is $29,720, while median incomes of families and households are $79,934 and $48,690 respectively.
| Characteristic | Number | Measure |
| Per Capita Income | 1,598 | $29,720 |
| Median Family Income | 387 | $79,934 |
| Mean Family Income | 387 | $76,602 |
| Median Household Income | 732 | $48,690 |
| Mean Household Income | 732 | $63,601 |
| Income Deficit | 387 | $0 |
| Wage / Income Gap (%) | 1,598 | 38.13% |
| Wage / Income Gap ($) | 1,598 | 61.87¢ per $1 |
| Gini / Inequality Index | 1,598 | 0.41 |
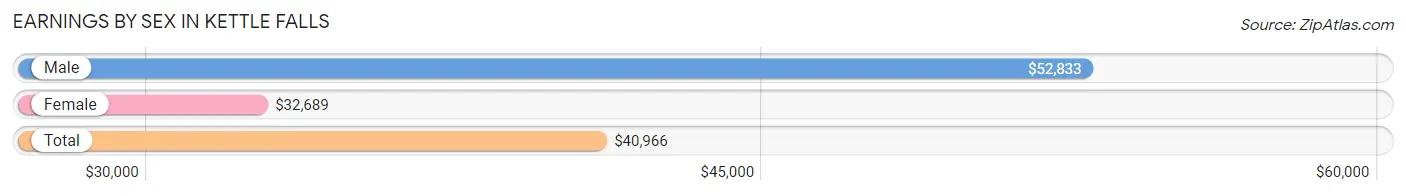
Earnings by Sex in Kettle Falls
Average Earnings in Kettle Falls are $40,966, $52,833 for men and $32,689 for women, a difference of 38.1%.
| Sex | Number | Average Earnings |
| Male | 380 (55.1%) | $52,833 |
| Female | 309 (44.9%) | $32,689 |
| Total | 689 (100.0%) | $40,966 |
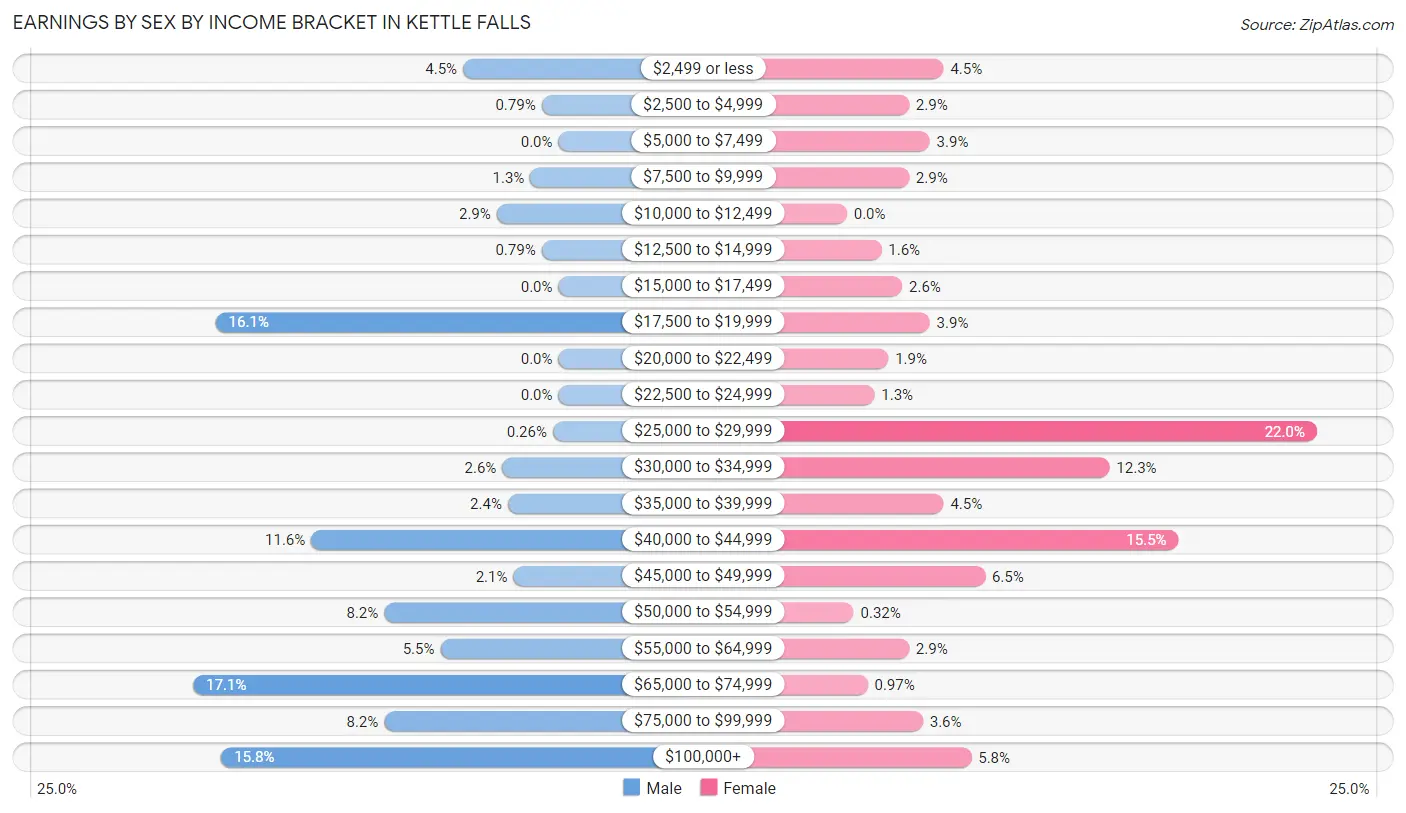
Earnings by Sex by Income Bracket in Kettle Falls
The most common earnings brackets in Kettle Falls are $65,000 to $74,999 for men (65 | 17.1%) and $25,000 to $29,999 for women (68 | 22.0%).
| Income | Male | Female |
| $2,499 or less | 17 (4.5%) | 14 (4.5%) |
| $2,500 to $4,999 | 3 (0.8%) | 9 (2.9%) |
| $5,000 to $7,499 | 0 (0.0%) | 12 (3.9%) |
| $7,500 to $9,999 | 5 (1.3%) | 9 (2.9%) |
| $10,000 to $12,499 | 11 (2.9%) | 0 (0.0%) |
| $12,500 to $14,999 | 3 (0.8%) | 5 (1.6%) |
| $15,000 to $17,499 | 0 (0.0%) | 8 (2.6%) |
| $17,500 to $19,999 | 61 (16.1%) | 12 (3.9%) |
| $20,000 to $22,499 | 0 (0.0%) | 6 (1.9%) |
| $22,500 to $24,999 | 0 (0.0%) | 4 (1.3%) |
| $25,000 to $29,999 | 1 (0.3%) | 68 (22.0%) |
| $30,000 to $34,999 | 10 (2.6%) | 38 (12.3%) |
| $35,000 to $39,999 | 9 (2.4%) | 14 (4.5%) |
| $40,000 to $44,999 | 44 (11.6%) | 48 (15.5%) |
| $45,000 to $49,999 | 8 (2.1%) | 20 (6.5%) |
| $50,000 to $54,999 | 31 (8.2%) | 1 (0.3%) |
| $55,000 to $64,999 | 21 (5.5%) | 9 (2.9%) |
| $65,000 to $74,999 | 65 (17.1%) | 3 (1.0%) |
| $75,000 to $99,999 | 31 (8.2%) | 11 (3.6%) |
| $100,000+ | 60 (15.8%) | 18 (5.8%) |
| Total | 380 (100.0%) | 309 (100.0%) |
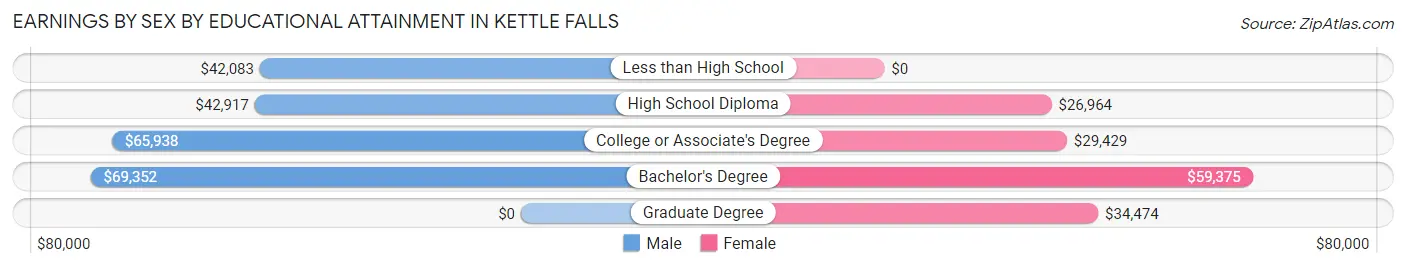
Earnings by Sex by Educational Attainment in Kettle Falls
Average earnings in Kettle Falls are $66,250 for men and $33,289 for women, a difference of 49.7%. Men with an educational attainment of bachelor's degree enjoy the highest average annual earnings of $69,352, while those with less than high school education earn the least with $42,083. Women with an educational attainment of bachelor's degree earn the most with the average annual earnings of $59,375, while those with high school diploma education have the smallest earnings of $26,964.
| Educational Attainment | Male Income | Female Income |
| Less than High School | $42,083 | $0 |
| High School Diploma | $42,917 | $26,964 |
| College or Associate's Degree | $65,938 | $29,429 |
| Bachelor's Degree | $69,352 | $59,375 |
| Graduate Degree | - | - |
| Total | $66,250 | $33,289 |
Family Income in Kettle Falls
Family Income Brackets in Kettle Falls
According to the Kettle Falls family income data, there are 109 families falling into the $75,000 to $99,999 income range, which is the most common income bracket and makes up 28.2% of all families. Conversely, the $10,000 to $14,999 income bracket is the least frequent group with only 3 families (0.8%) belonging to this category.
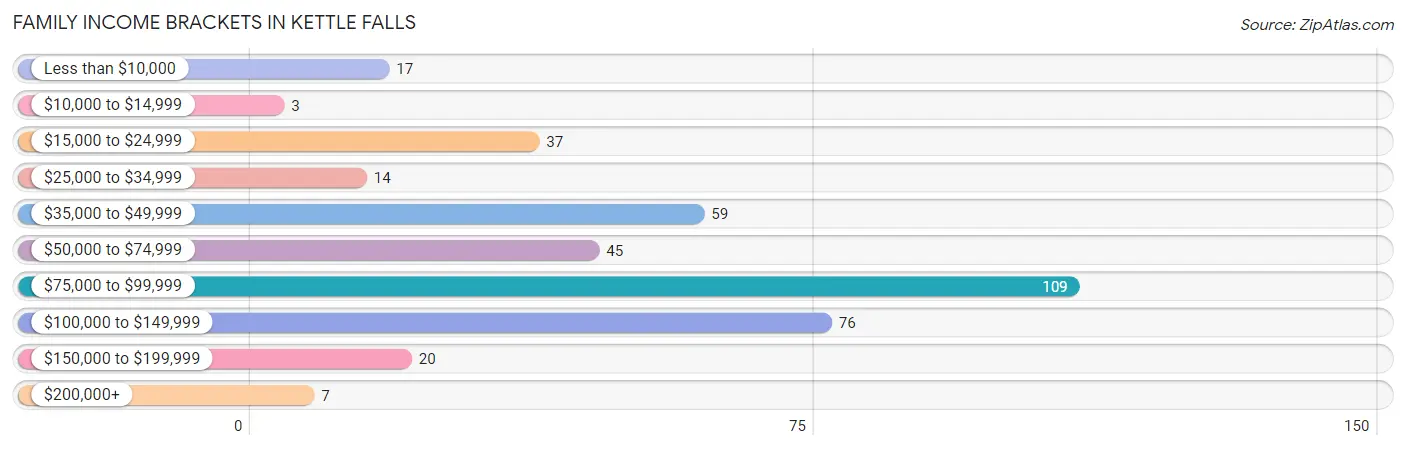
| Income Bracket | # Families | % Families |
| Less than $10,000 | 17 | 4.4% |
| $10,000 to $14,999 | 3 | 0.8% |
| $15,000 to $24,999 | 37 | 9.6% |
| $25,000 to $34,999 | 14 | 3.6% |
| $35,000 to $49,999 | 59 | 15.2% |
| $50,000 to $74,999 | 45 | 11.6% |
| $75,000 to $99,999 | 109 | 28.2% |
| $100,000 to $149,999 | 76 | 19.6% |
| $150,000 to $199,999 | 20 | 5.2% |
| $200,000+ | 7 | 1.8% |
Family Income by Famaliy Size in Kettle Falls
3-person families (58 | 15.0%) account for the highest median family income in Kettle Falls with $92,308 per family, while 3-person families (58 | 15.0%) have the highest median income of $30,769 per family member.
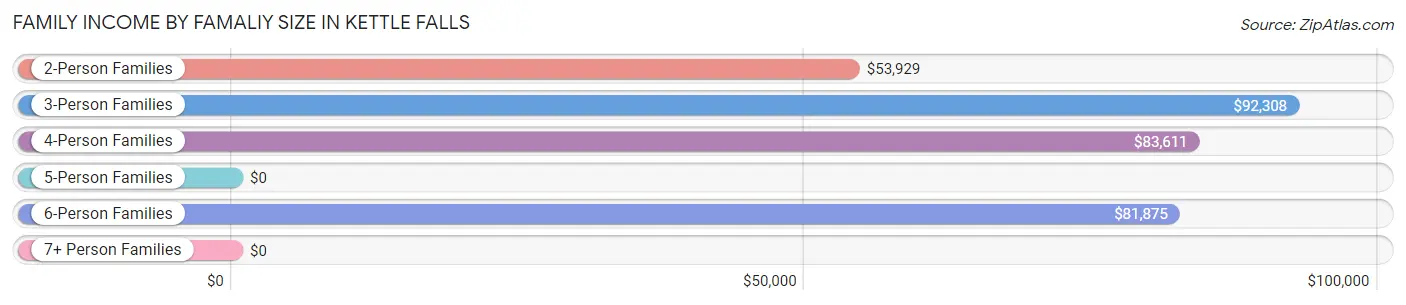
| Income Bracket | # Families | Median Income |
| 2-Person Families | 208 (53.7%) | $53,929 |
| 3-Person Families | 58 (15.0%) | $92,308 |
| 4-Person Families | 78 (20.2%) | $83,611 |
| 5-Person Families | 27 (7.0%) | $0 |
| 6-Person Families | 16 (4.1%) | $81,875 |
| 7+ Person Families | 0 (0.0%) | $0 |
| Total | 387 (100.0%) | $79,934 |
Family Income by Number of Earners in Kettle Falls
The median family income in Kettle Falls is $79,934, with families comprising 3+ earners (18) having the highest median family income of $157,000, while families with no earners (71) have the lowest median family income of $23,558, accounting for 4.6% and 18.3% of families, respectively.
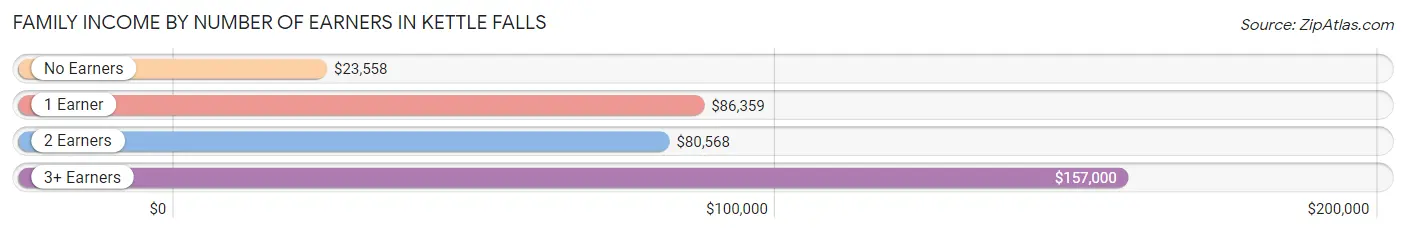
| Number of Earners | # Families | Median Income |
| No Earners | 71 (18.3%) | $23,558 |
| 1 Earner | 177 (45.7%) | $86,359 |
| 2 Earners | 121 (31.3%) | $80,568 |
| 3+ Earners | 18 (4.6%) | $157,000 |
| Total | 387 (100.0%) | $79,934 |
Household Income in Kettle Falls
Household Income Brackets in Kettle Falls
With 137 households falling in the category, the $75,000 to $99,999 income range is the most frequent in Kettle Falls, accounting for 18.7% of all households. In contrast, only 24 households (3.3%) fall into the $150,000 to $199,999 income bracket, making it the least populous group.
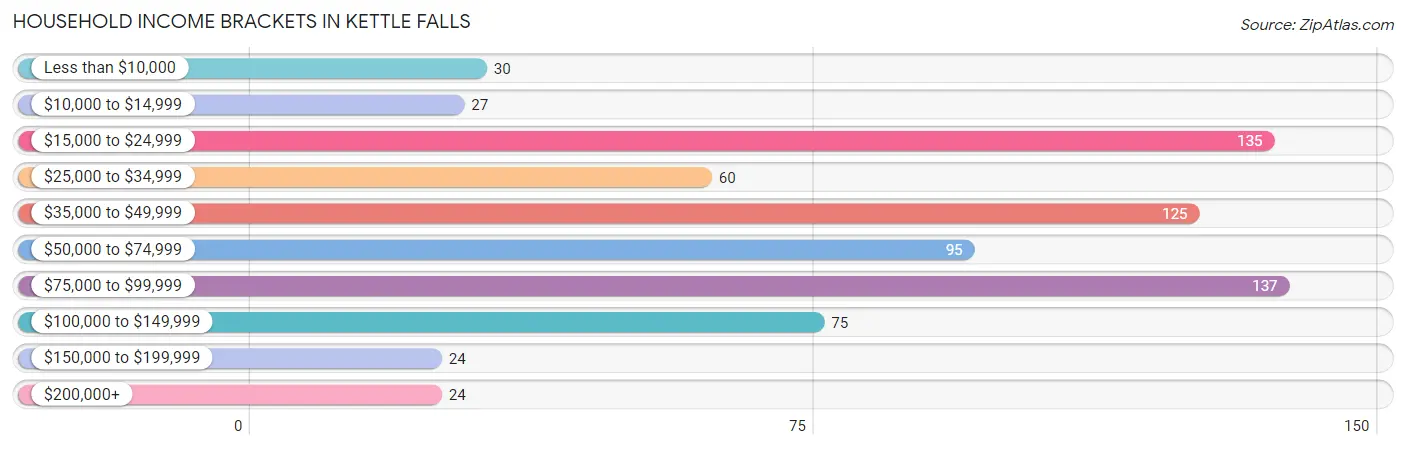
| Income Bracket | # Households | % Households |
| Less than $10,000 | 30 | 4.1% |
| $10,000 to $14,999 | 27 | 3.7% |
| $15,000 to $24,999 | 135 | 18.4% |
| $25,000 to $34,999 | 60 | 8.2% |
| $35,000 to $49,999 | 125 | 17.1% |
| $50,000 to $74,999 | 95 | 13.0% |
| $75,000 to $99,999 | 137 | 18.7% |
| $100,000 to $149,999 | 75 | 10.2% |
| $150,000 to $199,999 | 24 | 3.3% |
| $200,000+ | 24 | 3.3% |
Household Income by Householder Age in Kettle Falls
The median household income in Kettle Falls is $48,690, with the highest median household income of $68,750 found in the 25 to 44 years age bracket for the primary householder. A total of 199 households (27.2%) fall into this category. Meanwhile, the 15 to 24 years age bracket for the primary householder has the lowest median household income of $0, with 72 households (9.8%) in this group.
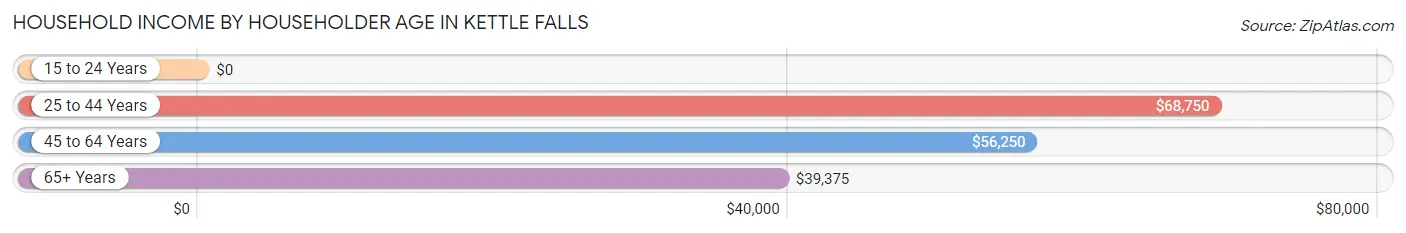
| Income Bracket | # Households | Median Income |
| 15 to 24 Years | 72 (9.8%) | $0 |
| 25 to 44 Years | 199 (27.2%) | $68,750 |
| 45 to 64 Years | 254 (34.7%) | $56,250 |
| 65+ Years | 207 (28.3%) | $39,375 |
| Total | 732 (100.0%) | $48,690 |
Poverty in Kettle Falls
Income Below Poverty by Sex and Age in Kettle Falls
With 12.5% poverty level for males and 16.3% for females among the residents of Kettle Falls, 12 to 14 year old males and 16 and 17 year old females are the most vulnerable to poverty, with 4 males (100.0%) and 15 females (62.5%) in their respective age groups living below the poverty level.
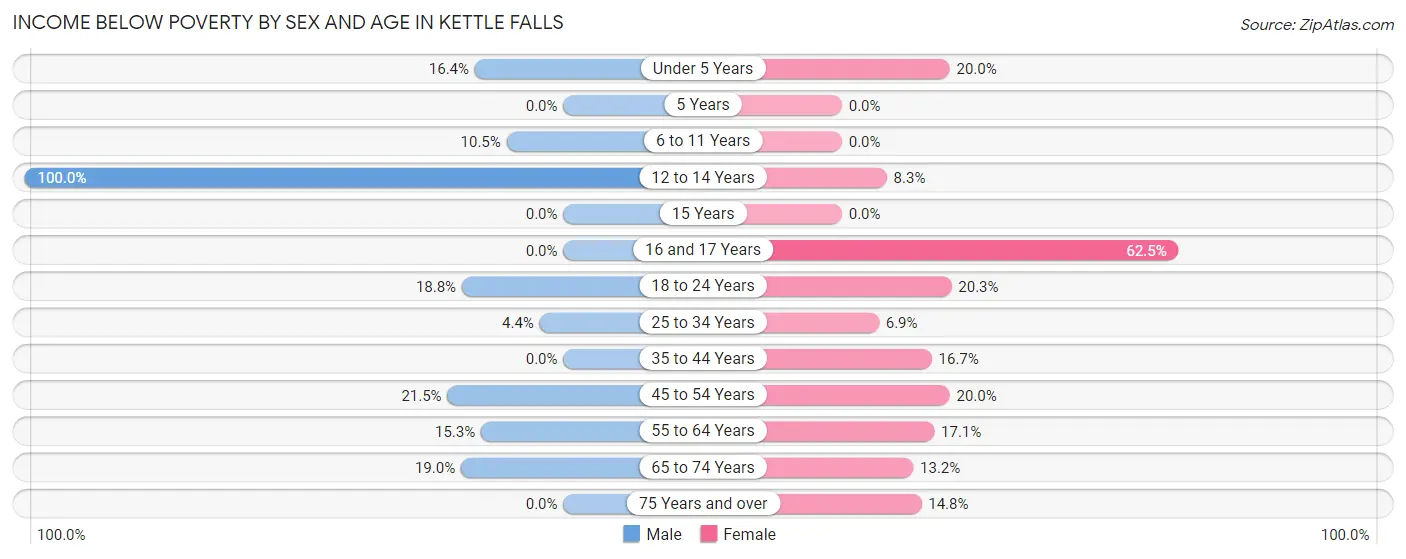
| Age Bracket | Male | Female |
| Under 5 Years | 11 (16.4%) | 13 (20.0%) |
| 5 Years | 0 (0.0%) | 0 (0.0%) |
| 6 to 11 Years | 8 (10.5%) | 0 (0.0%) |
| 12 to 14 Years | 4 (100.0%) | 2 (8.3%) |
| 15 Years | 0 (0.0%) | 0 (0.0%) |
| 16 and 17 Years | 0 (0.0%) | 15 (62.5%) |
| 18 to 24 Years | 16 (18.8%) | 12 (20.3%) |
| 25 to 34 Years | 4 (4.4%) | 7 (6.9%) |
| 35 to 44 Years | 0 (0.0%) | 12 (16.7%) |
| 45 to 54 Years | 20 (21.5%) | 12 (20.0%) |
| 55 to 64 Years | 20 (15.3%) | 24 (17.1%) |
| 65 to 74 Years | 19 (19.0%) | 18 (13.2%) |
| 75 Years and over | 0 (0.0%) | 9 (14.7%) |
| Total | 102 (12.5%) | 124 (16.3%) |
Income Above Poverty by Sex and Age in Kettle Falls
According to the poverty statistics in Kettle Falls, males aged 5 years and females aged 6 to 11 years are the age groups that are most secure financially, with 100.0% of males and 100.0% of females in these age groups living above the poverty line.
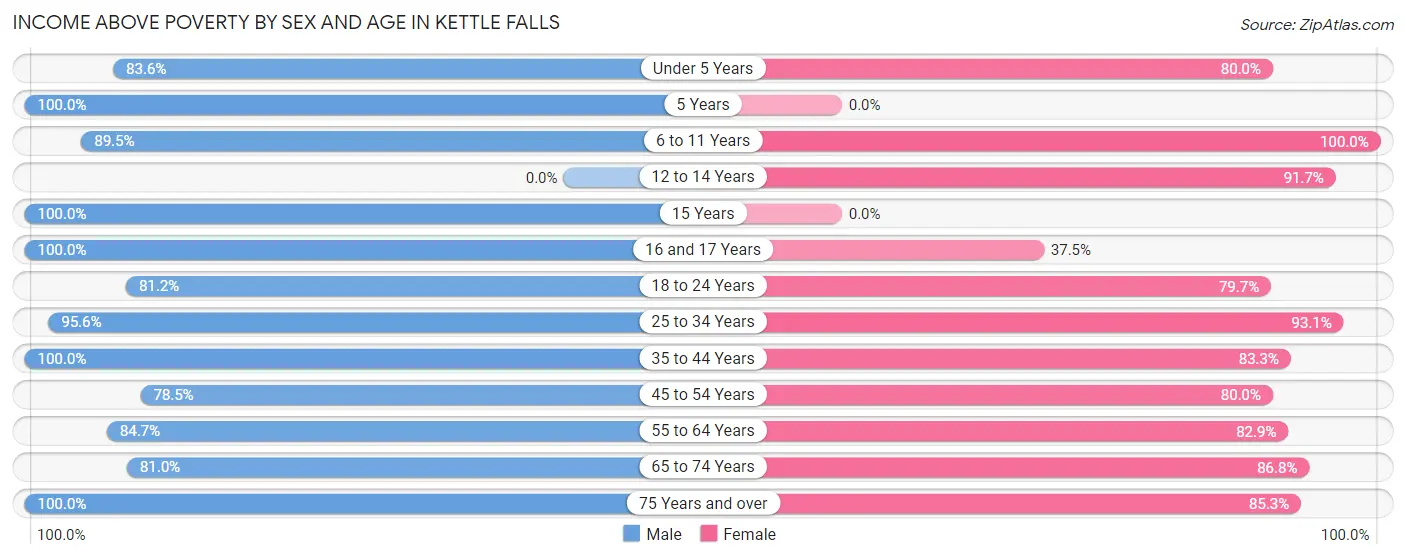
| Age Bracket | Male | Female |
| Under 5 Years | 56 (83.6%) | 52 (80.0%) |
| 5 Years | 41 (100.0%) | 0 (0.0%) |
| 6 to 11 Years | 68 (89.5%) | 20 (100.0%) |
| 12 to 14 Years | 0 (0.0%) | 22 (91.7%) |
| 15 Years | 12 (100.0%) | 0 (0.0%) |
| 16 and 17 Years | 5 (100.0%) | 9 (37.5%) |
| 18 to 24 Years | 69 (81.2%) | 47 (79.7%) |
| 25 to 34 Years | 87 (95.6%) | 95 (93.1%) |
| 35 to 44 Years | 77 (100.0%) | 60 (83.3%) |
| 45 to 54 Years | 73 (78.5%) | 48 (80.0%) |
| 55 to 64 Years | 111 (84.7%) | 116 (82.9%) |
| 65 to 74 Years | 81 (81.0%) | 118 (86.8%) |
| 75 Years and over | 33 (100.0%) | 52 (85.3%) |
| Total | 713 (87.5%) | 639 (83.8%) |
Income Below Poverty Among Married-Couple Families in Kettle Falls
The poverty statistics for married-couple families in Kettle Falls show that 2.8% or 7 of the total 255 families live below the poverty line. Families with 3 or 4 children have the highest poverty rate of 30.4%, comprising of 7 families. On the other hand, families with no children have the lowest poverty rate of 0.0%, which includes 0 families.
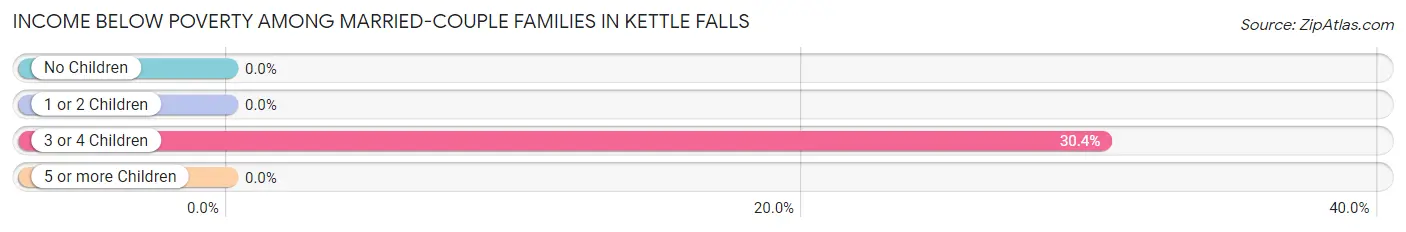
| Children | Above Poverty | Below Poverty |
| No Children | 153 (100.0%) | 0 (0.0%) |
| 1 or 2 Children | 79 (100.0%) | 0 (0.0%) |
| 3 or 4 Children | 16 (69.6%) | 7 (30.4%) |
| 5 or more Children | 0 (0.0%) | 0 (0.0%) |
| Total | 248 (97.3%) | 7 (2.8%) |
Income Below Poverty Among Single-Parent Households in Kettle Falls
According to the poverty data in Kettle Falls, 25.0% or 4 single-father households and 17.2% or 20 single-mother households are living below the poverty line. Among single-father households, those with 1 or 2 children have the highest poverty rate, with 4 households (100.0%) experiencing poverty. Likewise, among single-mother households, those with 3 or 4 children have the highest poverty rate, with 12 households (46.2%) falling below the poverty line.
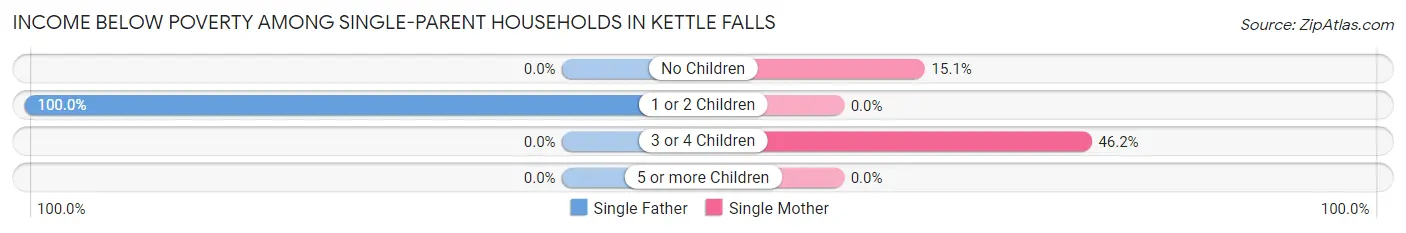
| Children | Single Father | Single Mother |
| No Children | 0 (0.0%) | 8 (15.1%) |
| 1 or 2 Children | 4 (100.0%) | 0 (0.0%) |
| 3 or 4 Children | 0 (0.0%) | 12 (46.2%) |
| 5 or more Children | 0 (0.0%) | 0 (0.0%) |
| Total | 4 (25.0%) | 20 (17.2%) |
Income Below Poverty Among Married-Couple vs Single-Parent Households in Kettle Falls
The poverty data for Kettle Falls shows that 7 of the married-couple family households (2.8%) and 24 of the single-parent households (18.2%) are living below the poverty level. Within the married-couple family households, those with 3 or 4 children have the highest poverty rate, with 7 households (30.4%) falling below the poverty line. Among the single-parent households, those with 3 or 4 children have the highest poverty rate, with 12 household (35.3%) living below poverty.
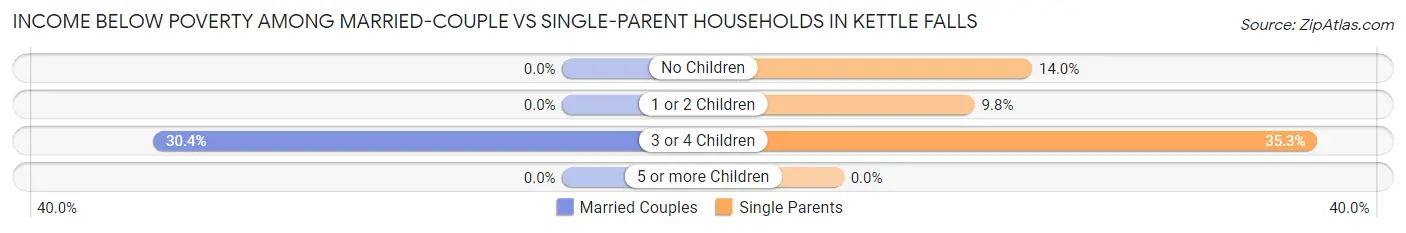
| Children | Married-Couple Families | Single-Parent Households |
| No Children | 0 (0.0%) | 8 (14.0%) |
| 1 or 2 Children | 0 (0.0%) | 4 (9.8%) |
| 3 or 4 Children | 7 (30.4%) | 12 (35.3%) |
| 5 or more Children | 0 (0.0%) | 0 (0.0%) |
| Total | 7 (2.8%) | 24 (18.2%) |
Race in Kettle Falls
The most populous races in Kettle Falls are White / Caucasian (1,429 | 89.4%), Two or more Races (148 | 9.3%), and Hispanic or Latino (36 | 2.2%).
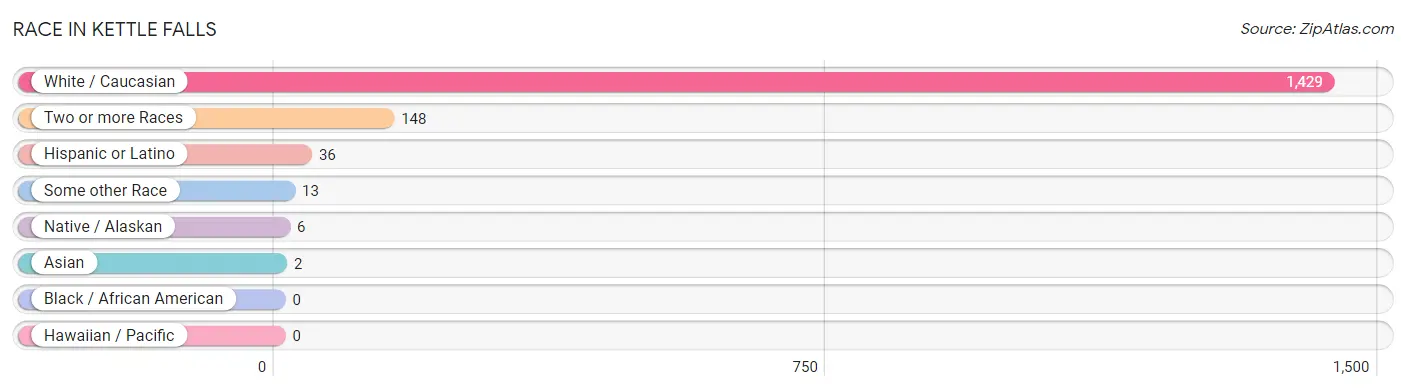
| Race | # Population | % Population |
| Asian | 2 | 0.1% |
| Black / African American | 0 | 0.0% |
| Hawaiian / Pacific | 0 | 0.0% |
| Hispanic or Latino | 36 | 2.2% |
| Native / Alaskan | 6 | 0.4% |
| White / Caucasian | 1,429 | 89.4% |
| Two or more Races | 148 | 9.3% |
| Some other Race | 13 | 0.8% |
| Total | 1,598 | 100.0% |
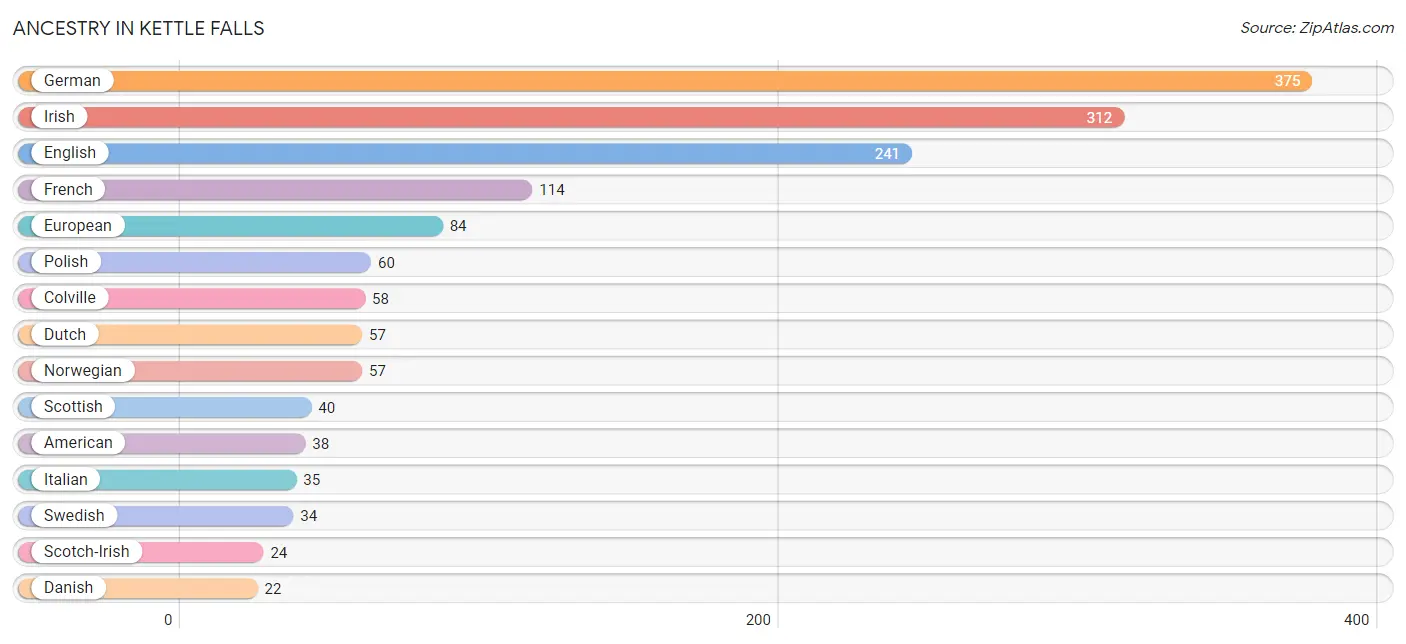
Ancestry in Kettle Falls
The most populous ancestries reported in Kettle Falls are German (375 | 23.5%), Irish (312 | 19.5%), English (241 | 15.1%), French (114 | 7.1%), and European (84 | 5.3%), together accounting for 70.5% of all Kettle Falls residents.
| Ancestry | # Population | % Population |
| American | 38 | 2.4% |
| Austrian | 9 | 0.6% |
| British | 17 | 1.1% |
| Carpatho Rusyn | 10 | 0.6% |
| Cherokee | 4 | 0.3% |
| Chickasaw | 7 | 0.4% |
| Colville | 58 | 3.6% |
| Croatian | 13 | 0.8% |
| Czech | 3 | 0.2% |
| Czechoslovakian | 4 | 0.3% |
| Danish | 22 | 1.4% |
| Dutch | 57 | 3.6% |
| English | 241 | 15.1% |
| European | 84 | 5.3% |
| French | 114 | 7.1% |
| French Canadian | 14 | 0.9% |
| German | 375 | 23.5% |
| Greek | 4 | 0.3% |
| Hungarian | 3 | 0.2% |
| Irish | 312 | 19.5% |
| Italian | 35 | 2.2% |
| Korean | 4 | 0.3% |
| Lithuanian | 3 | 0.2% |
| Mexican | 21 | 1.3% |
| Native Hawaiian | 4 | 0.3% |
| Northern European | 18 | 1.1% |
| Norwegian | 57 | 3.6% |
| Pennsylvania German | 3 | 0.2% |
| Polish | 60 | 3.7% |
| Scandinavian | 20 | 1.3% |
| Scotch-Irish | 24 | 1.5% |
| Scottish | 40 | 2.5% |
| Slovak | 3 | 0.2% |
| Spanish | 5 | 0.3% |
| Sri Lankan | 2 | 0.1% |
| Swedish | 34 | 2.1% |
| Tlingit-Haida | 3 | 0.2% |
| Welsh | 11 | 0.7% |
| Yugoslavian | 3 | 0.2% | View All 39 Rows |
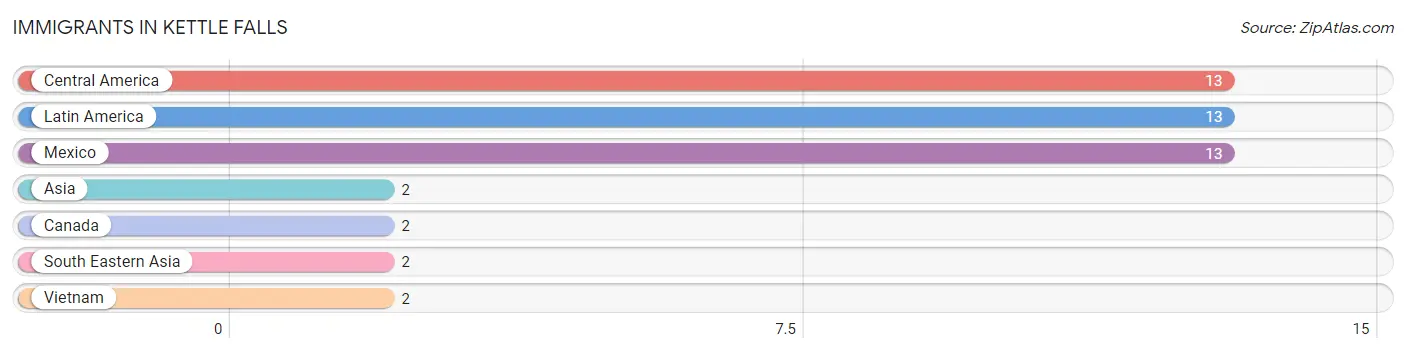
Immigrants in Kettle Falls
The most numerous immigrant groups reported in Kettle Falls came from Central America (13 | 0.8%), Latin America (13 | 0.8%), Mexico (13 | 0.8%), Asia (2 | 0.1%), and Canada (2 | 0.1%), together accounting for 2.7% of all Kettle Falls residents.
| Immigration Origin | # Population | % Population |
| Asia | 2 | 0.1% |
| Canada | 2 | 0.1% |
| Central America | 13 | 0.8% |
| Latin America | 13 | 0.8% |
| Mexico | 13 | 0.8% |
| South Eastern Asia | 2 | 0.1% |
| Vietnam | 2 | 0.1% | View All 7 Rows |
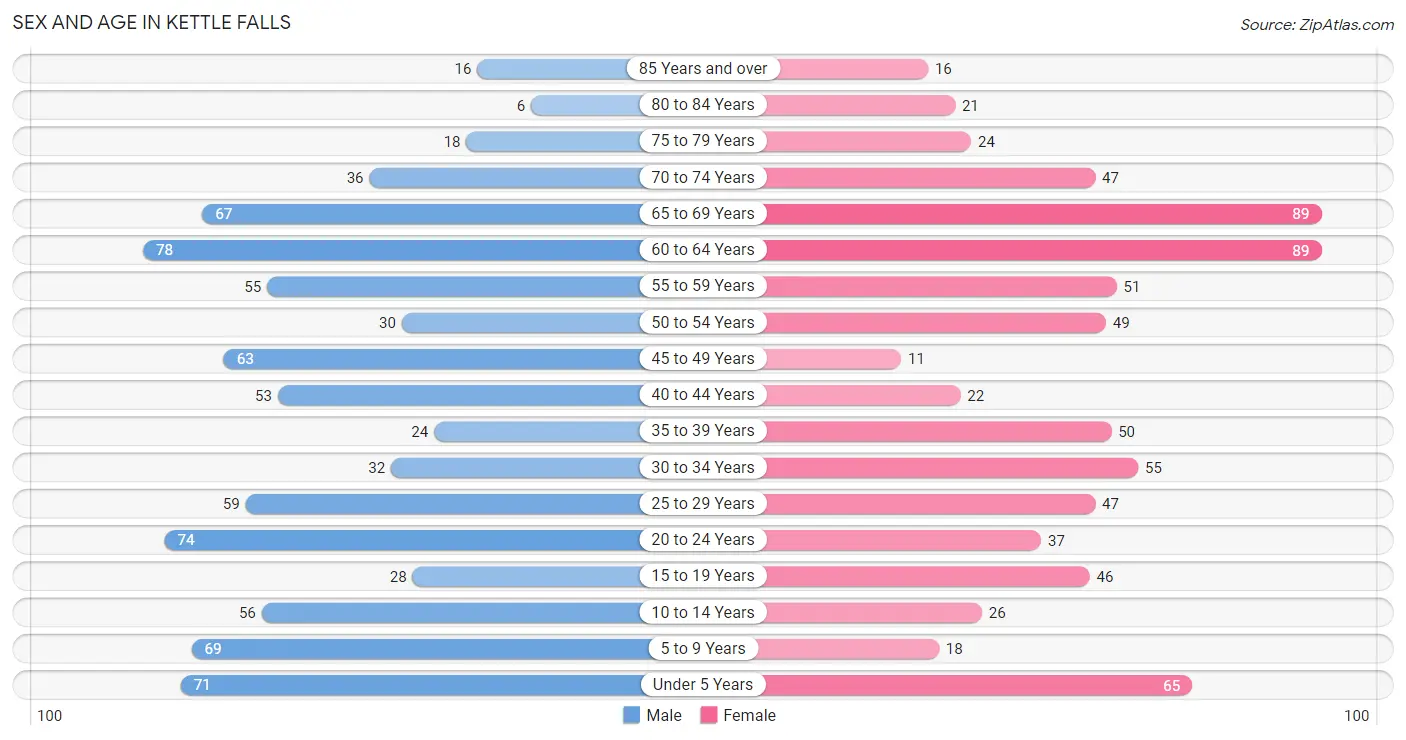
Sex and Age in Kettle Falls
Sex and Age in Kettle Falls
The most populous age groups in Kettle Falls are 60 to 64 Years (78 | 9.3%) for men and 60 to 64 Years (89 | 11.7%) for women.
| Age Bracket | Male | Female |
| Under 5 Years | 71 (8.5%) | 65 (8.5%) |
| 5 to 9 Years | 69 (8.3%) | 18 (2.4%) |
| 10 to 14 Years | 56 (6.7%) | 26 (3.4%) |
| 15 to 19 Years | 28 (3.4%) | 46 (6.0%) |
| 20 to 24 Years | 74 (8.9%) | 37 (4.9%) |
| 25 to 29 Years | 59 (7.1%) | 47 (6.2%) |
| 30 to 34 Years | 32 (3.8%) | 55 (7.2%) |
| 35 to 39 Years | 24 (2.9%) | 50 (6.6%) |
| 40 to 44 Years | 53 (6.4%) | 22 (2.9%) |
| 45 to 49 Years | 63 (7.5%) | 11 (1.4%) |
| 50 to 54 Years | 30 (3.6%) | 49 (6.4%) |
| 55 to 59 Years | 55 (6.6%) | 51 (6.7%) |
| 60 to 64 Years | 78 (9.3%) | 89 (11.7%) |
| 65 to 69 Years | 67 (8.0%) | 89 (11.7%) |
| 70 to 74 Years | 36 (4.3%) | 47 (6.2%) |
| 75 to 79 Years | 18 (2.2%) | 24 (3.2%) |
| 80 to 84 Years | 6 (0.7%) | 21 (2.8%) |
| 85 Years and over | 16 (1.9%) | 16 (2.1%) |
| Total | 835 (100.0%) | 763 (100.0%) |
Families and Households in Kettle Falls
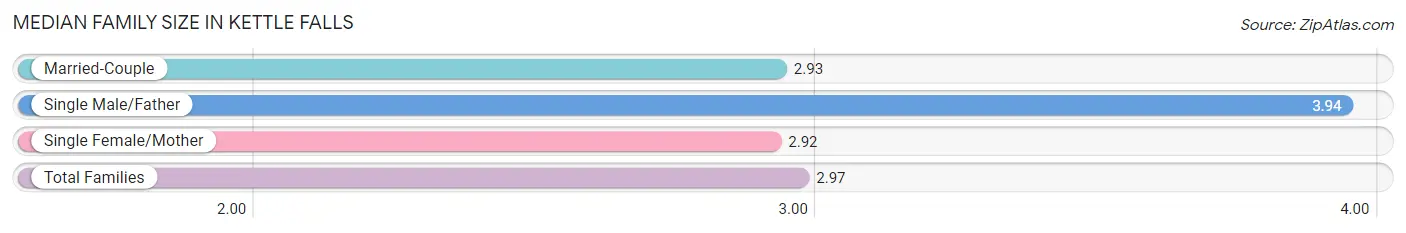
Median Family Size in Kettle Falls
The median family size in Kettle Falls is 2.97 persons per family, with single male/father families (16 | 4.1%) accounting for the largest median family size of 3.94 persons per family. On the other hand, single female/mother families (116 | 30.0%) represent the smallest median family size with 2.92 persons per family.
| Family Type | # Families | Family Size |
| Married-Couple | 255 (65.9%) | 2.93 |
| Single Male/Father | 16 (4.1%) | 3.94 |
| Single Female/Mother | 116 (30.0%) | 2.92 |
| Total Families | 387 (100.0%) | 2.97 |
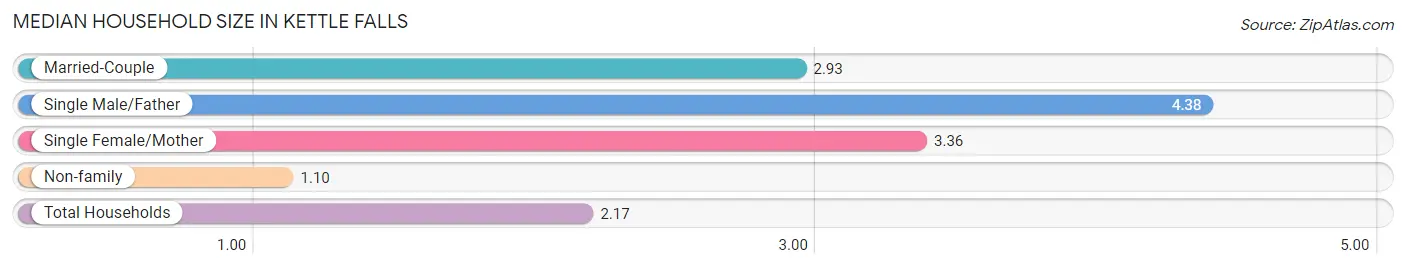
Median Household Size in Kettle Falls
The median household size in Kettle Falls is 2.17 persons per household, with single male/father households (16 | 2.2%) accounting for the largest median household size of 4.38 persons per household. non-family households (345 | 47.1%) represent the smallest median household size with 1.10 persons per household.
| Household Type | # Households | Household Size |
| Married-Couple | 255 (34.8%) | 2.93 |
| Single Male/Father | 16 (2.2%) | 4.38 |
| Single Female/Mother | 116 (15.9%) | 3.36 |
| Non-family | 345 (47.1%) | 1.10 |
| Total Households | 732 (100.0%) | 2.17 |
Household Size by Marriage Status in Kettle Falls
Out of a total of 732 households in Kettle Falls, 387 (52.9%) are family households, while 345 (47.1%) are nonfamily households. The most numerous type of family households are 2-person households, comprising 187, and the most common type of nonfamily households are 1-person households, comprising 311.
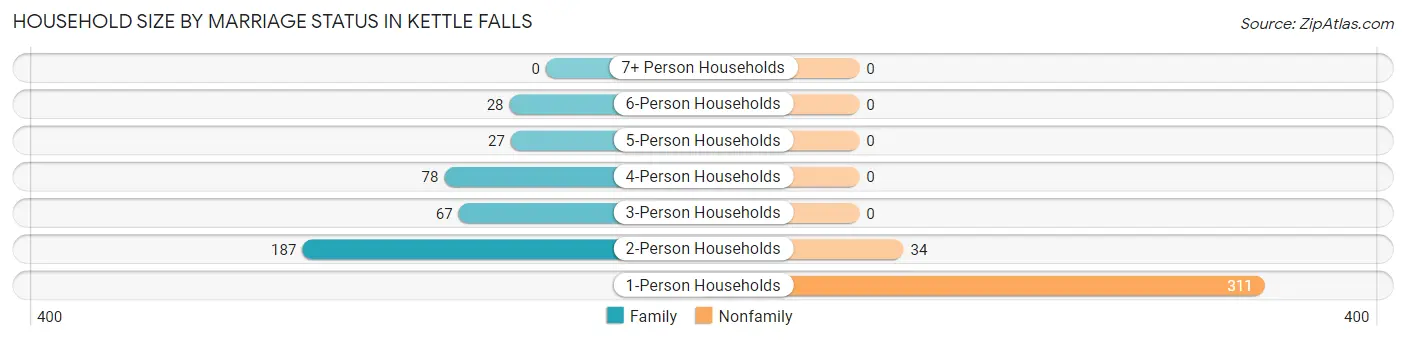
| Household Size | Family Households | Nonfamily Households |
| 1-Person Households | - | 311 (42.5%) |
| 2-Person Households | 187 (25.6%) | 34 (4.6%) |
| 3-Person Households | 67 (9.1%) | 0 (0.0%) |
| 4-Person Households | 78 (10.7%) | 0 (0.0%) |
| 5-Person Households | 27 (3.7%) | 0 (0.0%) |
| 6-Person Households | 28 (3.8%) | 0 (0.0%) |
| 7+ Person Households | 0 (0.0%) | 0 (0.0%) |
| Total | 387 (52.9%) | 345 (47.1%) |
Female Fertility in Kettle Falls
Fertility by Age in Kettle Falls
Average fertility rate in Kettle Falls is 92.0 births per 1,000 women. Women in the age bracket of 20 to 34 years have the highest fertility rate with 180.0 births per 1,000 women. Women in the age bracket of 20 to 34 years acount for 100.0% of all women with births.
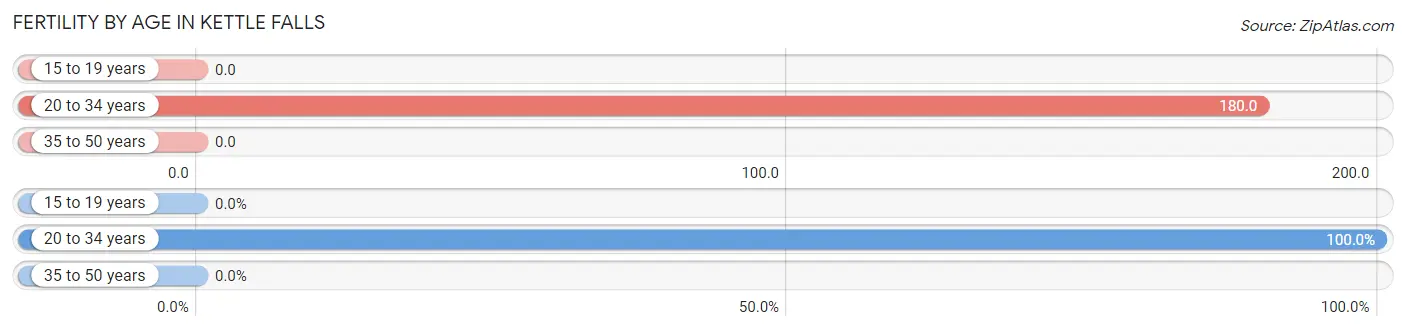
| Age Bracket | Women with Births | Births / 1,000 Women |
| 15 to 19 years | 0 (0.0%) | 0.0 |
| 20 to 34 years | 25 (100.0%) | 180.0 |
| 35 to 50 years | 0 (0.0%) | 0.0 |
| Total | 25 (100.0%) | 92.0 |
Fertility by Age by Marriage Status in Kettle Falls
44.0% of women with births (25) in Kettle Falls are married. The highest percentage of unmarried women with births falls into 20 to 34 years age bracket with 56.0% of them unmarried at the time of birth, while the lowest percentage of unmarried women with births belong to 20 to 34 years age bracket with 56.0% of them unmarried.
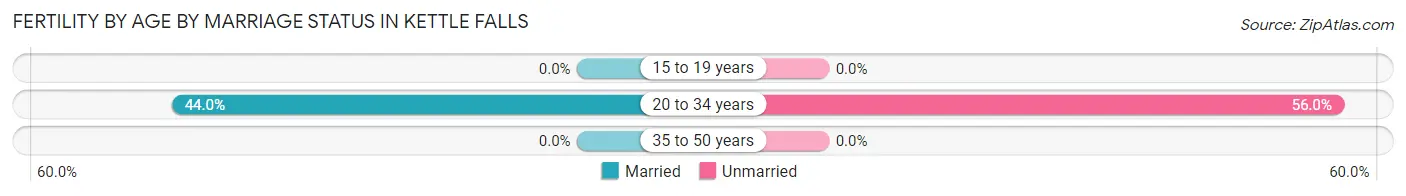
| Age Bracket | Married | Unmarried |
| 15 to 19 years | 0 (0.0%) | 0 (0.0%) |
| 20 to 34 years | 11 (44.0%) | 14 (56.0%) |
| 35 to 50 years | 0 (0.0%) | 0 (0.0%) |
| Total | 11 (44.0%) | 14 (56.0%) |
Fertility by Education in Kettle Falls
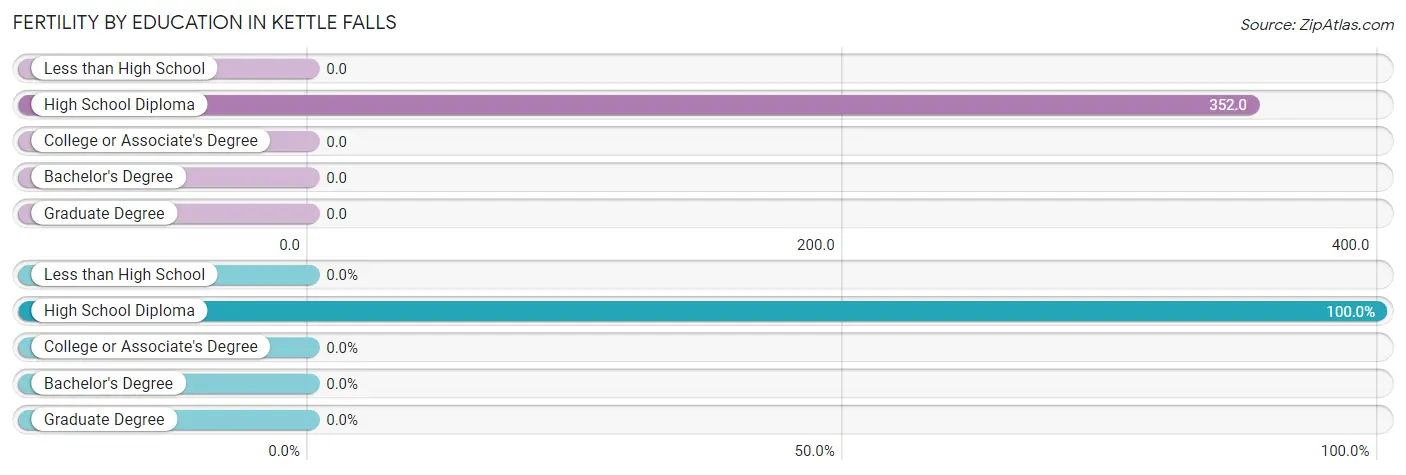
| Educational Attainment | Women with Births | Births / 1,000 Women |
| Less than High School | 0 (0.0%) | 0.0 |
| High School Diploma | 25 (100.0%) | 352.0 |
| College or Associate's Degree | 0 (0.0%) | 0.0 |
| Bachelor's Degree | 0 (0.0%) | 0.0 |
| Graduate Degree | 0 (0.0%) | 0.0 |
| Total | 25 (100.0%) | 92.0 |
Fertility by Education by Marriage Status in Kettle Falls
56.0% of women with births in Kettle Falls are unmarried. Women with the educational attainment of high school diploma are most likely to be married with 44.0% of them married at childbirth, while women with the educational attainment of high school diploma are least likely to be married with 56.0% of them unmarried at childbirth.
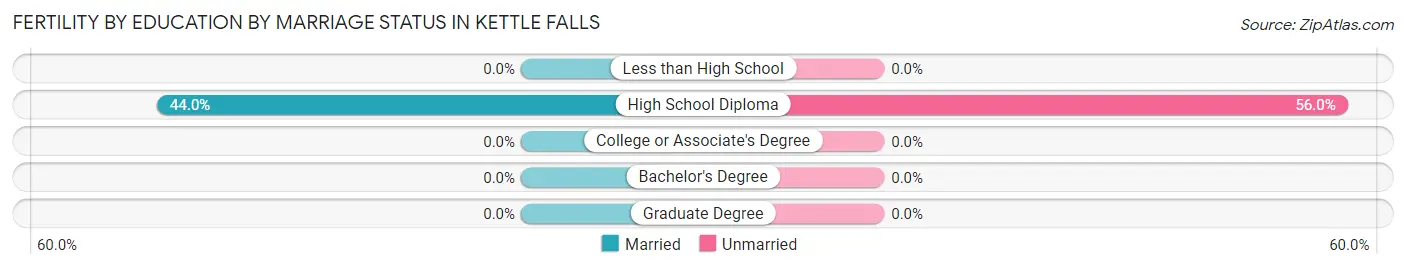
| Educational Attainment | Married | Unmarried |
| Less than High School | 0 (0.0%) | 0 (0.0%) |
| High School Diploma | 11 (44.0%) | 14 (56.0%) |
| College or Associate's Degree | 0 (0.0%) | 0 (0.0%) |
| Bachelor's Degree | 0 (0.0%) | 0 (0.0%) |
| Graduate Degree | 0 (0.0%) | 0 (0.0%) |
| Total | 11 (44.0%) | 14 (56.0%) |
Employment Characteristics in Kettle Falls
Employment by Class of Employer in Kettle Falls
Among the 634 employed individuals in Kettle Falls, private company employees (408 | 64.3%), state government employees (63 | 9.9%), and self-employed (not incorporated) (47 | 7.4%) make up the most common classes of employment.
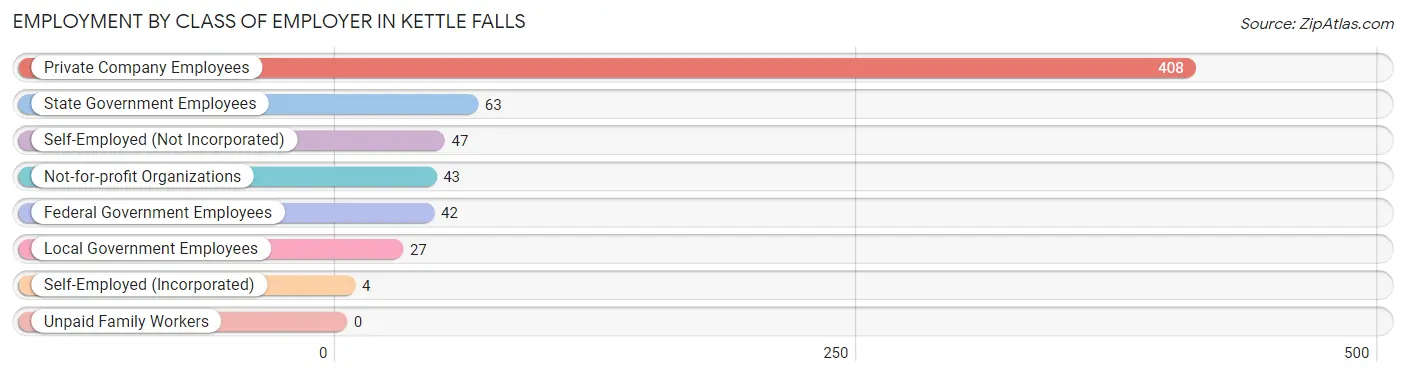
| Employer Class | # Employees | % Employees |
| Private Company Employees | 408 | 64.3% |
| Self-Employed (Incorporated) | 4 | 0.6% |
| Self-Employed (Not Incorporated) | 47 | 7.4% |
| Not-for-profit Organizations | 43 | 6.8% |
| Local Government Employees | 27 | 4.3% |
| State Government Employees | 63 | 9.9% |
| Federal Government Employees | 42 | 6.6% |
| Unpaid Family Workers | 0 | 0.0% |
| Total | 634 | 100.0% |
Employment Status by Age in Kettle Falls
According to the labor force statistics for Kettle Falls, out of the total population over 16 years of age (1,281), 53.0% or 679 individuals are in the labor force, with 6.2% or 42 of them unemployed. The age group with the highest labor force participation rate is 25 to 29 years, with 97.2% or 103 individuals in the labor force. Within the labor force, the 65 to 74 years age range has the highest percentage of unemployed individuals, with 25.3% or 20 of them being unemployed.
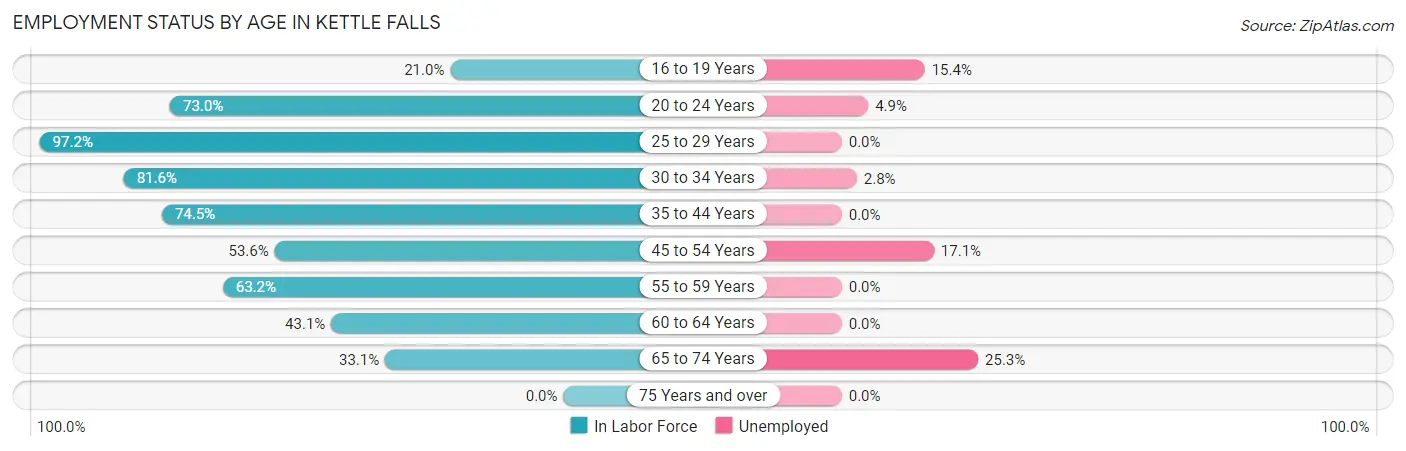
| Age Bracket | In Labor Force | Unemployed |
| 16 to 19 Years | 13 (21.0%) | 2 (15.4%) |
| 20 to 24 Years | 81 (73.0%) | 4 (4.9%) |
| 25 to 29 Years | 103 (97.2%) | 0 (0.0%) |
| 30 to 34 Years | 71 (81.6%) | 2 (2.8%) |
| 35 to 44 Years | 111 (74.5%) | 0 (0.0%) |
| 45 to 54 Years | 82 (53.6%) | 14 (17.1%) |
| 55 to 59 Years | 67 (63.2%) | 0 (0.0%) |
| 60 to 64 Years | 72 (43.1%) | 0 (0.0%) |
| 65 to 74 Years | 79 (33.1%) | 20 (25.3%) |
| 75 Years and over | 0 (0.0%) | 0 (0.0%) |
| Total | 679 (53.0%) | 42 (6.2%) |
Employment Status by Educational Attainment in Kettle Falls
According to labor force statistics for Kettle Falls, 65.9% of individuals (506) out of the total population between 25 and 64 years of age (768) are in the labor force, with 3.2% or 16 of them being unemployed. The group with the highest labor force participation rate are those with the educational attainment of bachelor's degree or higher, with 92.2% or 166 individuals in the labor force. Within the labor force, individuals with less than high school education have the highest percentage of unemployment, with 60.9% or 14 of them being unemployed.
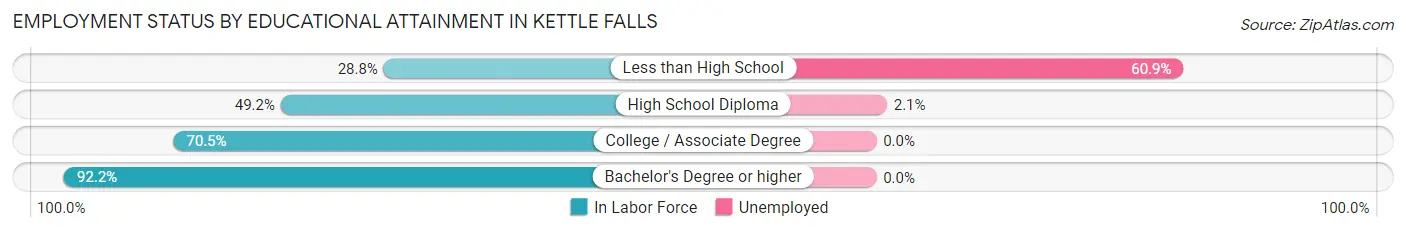
| Educational Attainment | In Labor Force | Unemployed |
| Less than High School | 23 (28.8%) | 49 (60.9%) |
| High School Diploma | 95 (49.2%) | 4 (2.1%) |
| College / Associate Degree | 222 (70.5%) | 0 (0.0%) |
| Bachelor's Degree or higher | 166 (92.2%) | 0 (0.0%) |
| Total | 506 (65.9%) | 25 (3.2%) |
Employment Occupations by Sex in Kettle Falls
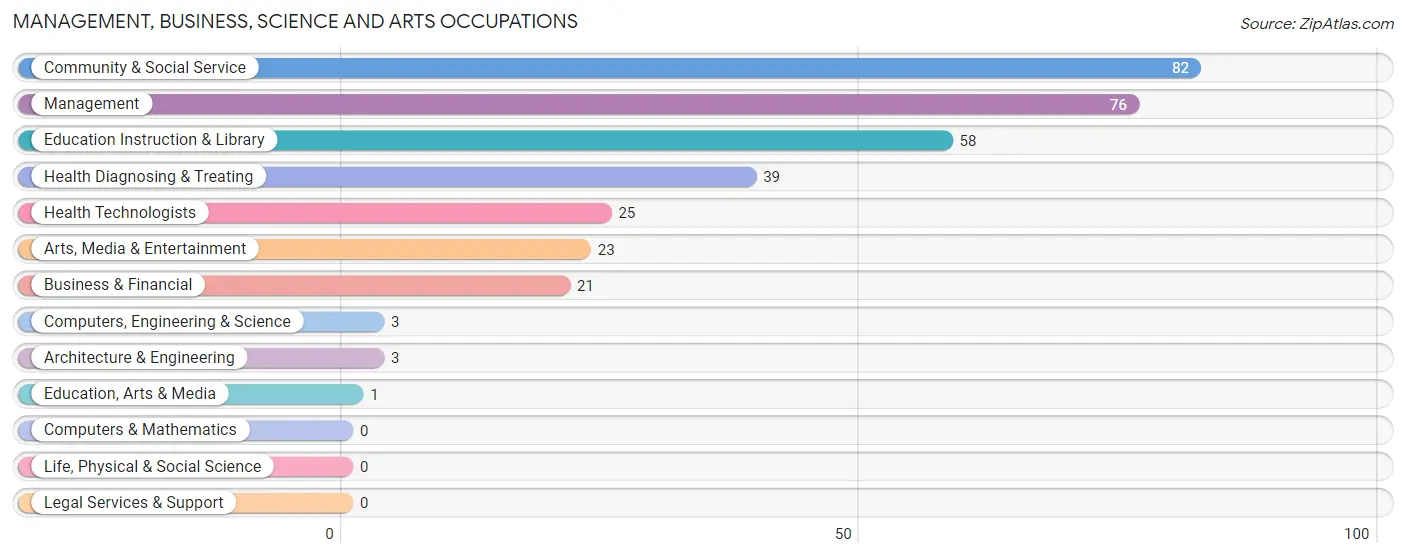
Management, Business, Science and Arts Occupations
The most common Management, Business, Science and Arts occupations in Kettle Falls are Community & Social Service (82 | 12.9%), Management (76 | 11.9%), Education Instruction & Library (58 | 9.1%), Health Diagnosing & Treating (39 | 6.1%), and Health Technologists (25 | 3.9%).
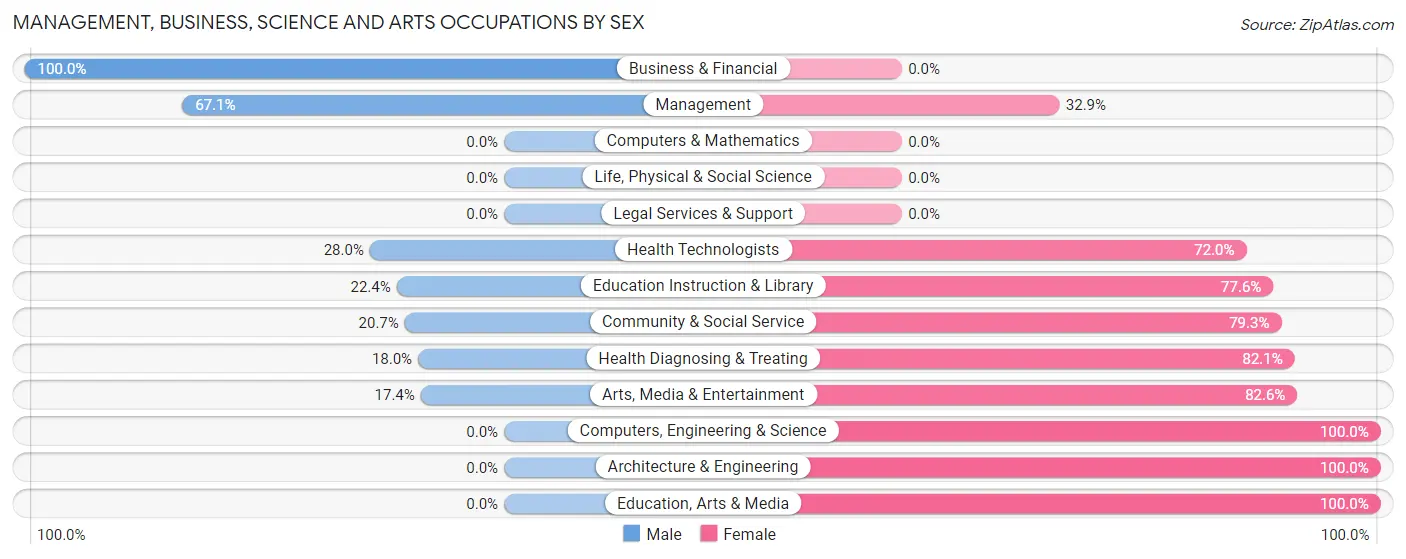
Management, Business, Science and Arts Occupations by Sex
Within the Management, Business, Science and Arts occupations in Kettle Falls, the most male-oriented occupations are Business & Financial (100.0%), Management (67.1%), and Health Technologists (28.0%), while the most female-oriented occupations are Computers, Engineering & Science (100.0%), Architecture & Engineering (100.0%), and Education, Arts & Media (100.0%).
| Occupation | Male | Female |
| Management | 51 (67.1%) | 25 (32.9%) |
| Business & Financial | 21 (100.0%) | 0 (0.0%) |
| Computers, Engineering & Science | 0 (0.0%) | 3 (100.0%) |
| Computers & Mathematics | 0 (0.0%) | 0 (0.0%) |
| Architecture & Engineering | 0 (0.0%) | 3 (100.0%) |
| Life, Physical & Social Science | 0 (0.0%) | 0 (0.0%) |
| Community & Social Service | 17 (20.7%) | 65 (79.3%) |
| Education, Arts & Media | 0 (0.0%) | 1 (100.0%) |
| Legal Services & Support | 0 (0.0%) | 0 (0.0%) |
| Education Instruction & Library | 13 (22.4%) | 45 (77.6%) |
| Arts, Media & Entertainment | 4 (17.4%) | 19 (82.6%) |
| Health Diagnosing & Treating | 7 (17.9%) | 32 (82.1%) |
| Health Technologists | 7 (28.0%) | 18 (72.0%) |
| Total (Category) | 96 (43.4%) | 125 (56.6%) |
| Total (Overall) | 351 (55.1%) | 286 (44.9%) |
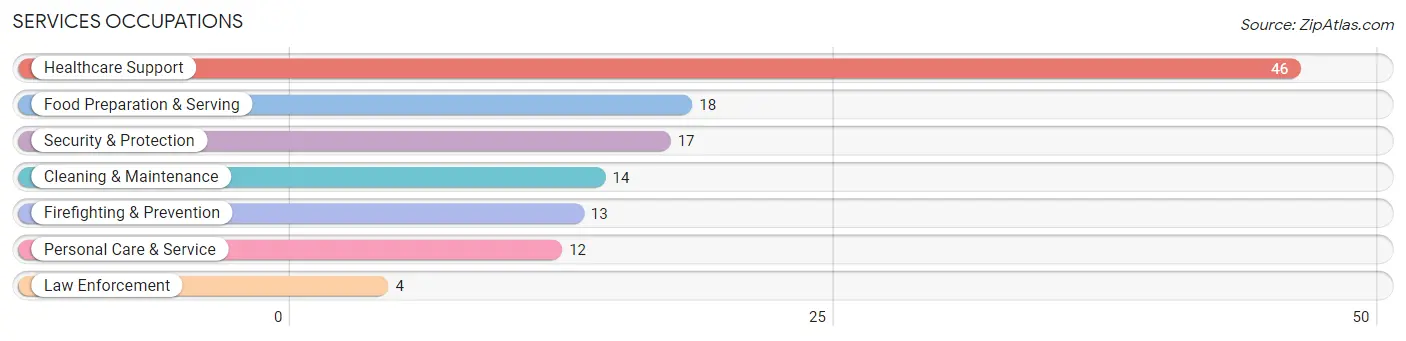
Services Occupations
The most common Services occupations in Kettle Falls are Healthcare Support (46 | 7.2%), Food Preparation & Serving (18 | 2.8%), Security & Protection (17 | 2.7%), Cleaning & Maintenance (14 | 2.2%), and Firefighting & Prevention (13 | 2.0%).
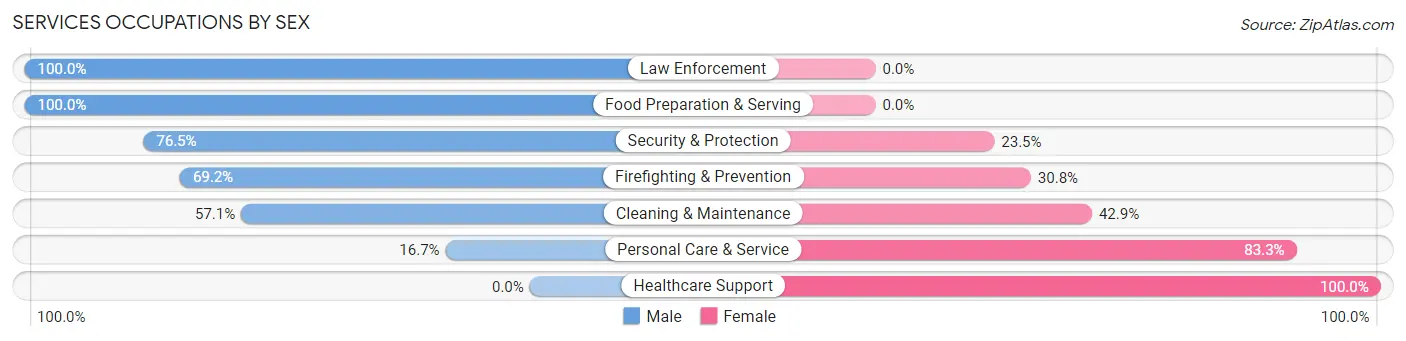
Services Occupations by Sex
Within the Services occupations in Kettle Falls, the most male-oriented occupations are Law Enforcement (100.0%), Food Preparation & Serving (100.0%), and Security & Protection (76.5%), while the most female-oriented occupations are Healthcare Support (100.0%), Personal Care & Service (83.3%), and Cleaning & Maintenance (42.9%).
| Occupation | Male | Female |
| Healthcare Support | 0 (0.0%) | 46 (100.0%) |
| Security & Protection | 13 (76.5%) | 4 (23.5%) |
| Firefighting & Prevention | 9 (69.2%) | 4 (30.8%) |
| Law Enforcement | 4 (100.0%) | 0 (0.0%) |
| Food Preparation & Serving | 18 (100.0%) | 0 (0.0%) |
| Cleaning & Maintenance | 8 (57.1%) | 6 (42.9%) |
| Personal Care & Service | 2 (16.7%) | 10 (83.3%) |
| Total (Category) | 41 (38.3%) | 66 (61.7%) |
| Total (Overall) | 351 (55.1%) | 286 (44.9%) |
Sales and Office Occupations
The most common Sales and Office occupations in Kettle Falls are Office & Administration (60 | 9.4%), and Sales & Related (25 | 3.9%).
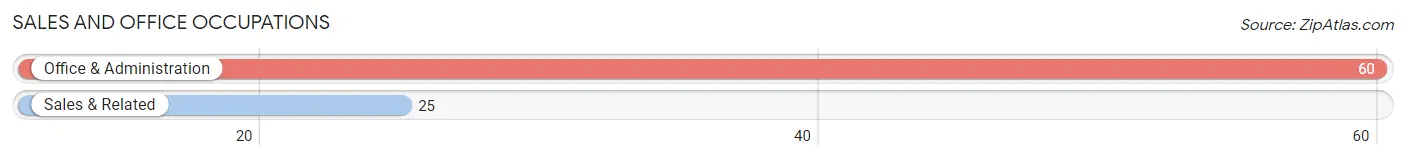
Sales and Office Occupations by Sex
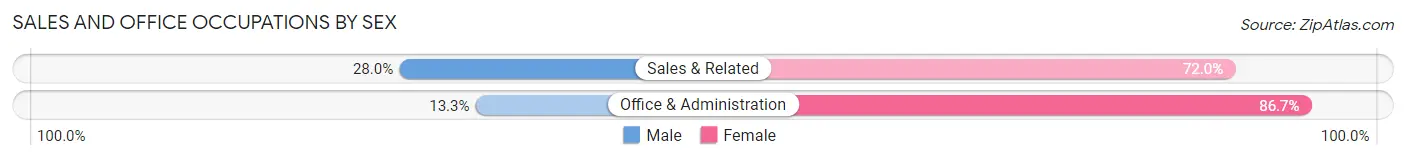
| Occupation | Male | Female |
| Sales & Related | 7 (28.0%) | 18 (72.0%) |
| Office & Administration | 8 (13.3%) | 52 (86.7%) |
| Total (Category) | 15 (17.6%) | 70 (82.4%) |
| Total (Overall) | 351 (55.1%) | 286 (44.9%) |
Natural Resources, Construction and Maintenance Occupations
The most common Natural Resources, Construction and Maintenance occupations in Kettle Falls are Construction & Extraction (45 | 7.1%), Farming, Fishing & Forestry (12 | 1.9%), and Installation, Maintenance & Repair (9 | 1.4%).
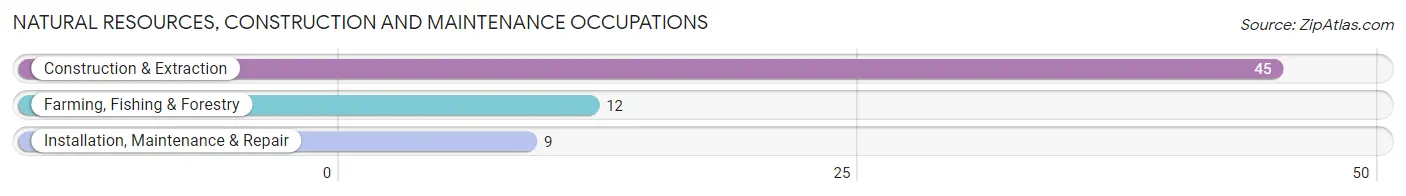
Natural Resources, Construction and Maintenance Occupations by Sex
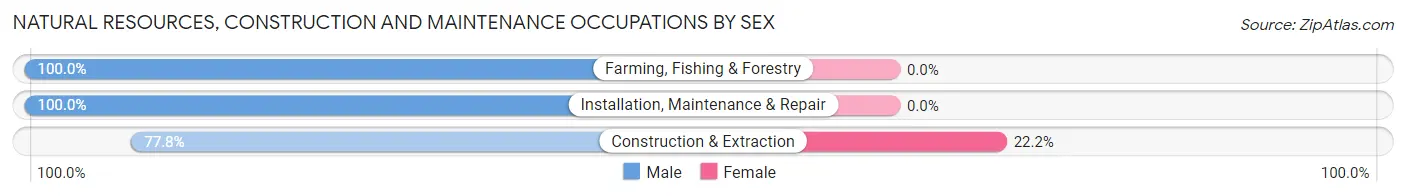
| Occupation | Male | Female |
| Farming, Fishing & Forestry | 12 (100.0%) | 0 (0.0%) |
| Construction & Extraction | 35 (77.8%) | 10 (22.2%) |
| Installation, Maintenance & Repair | 9 (100.0%) | 0 (0.0%) |
| Total (Category) | 56 (84.9%) | 10 (15.1%) |
| Total (Overall) | 351 (55.1%) | 286 (44.9%) |
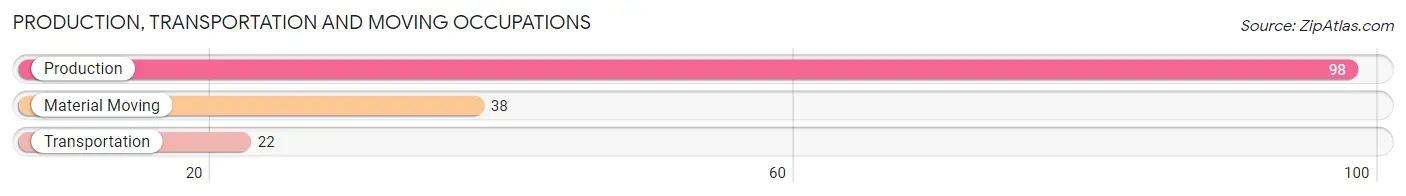
Production, Transportation and Moving Occupations
The most common Production, Transportation and Moving occupations in Kettle Falls are Production (98 | 15.4%), Material Moving (38 | 6.0%), and Transportation (22 | 3.5%).
Production, Transportation and Moving Occupations by Sex
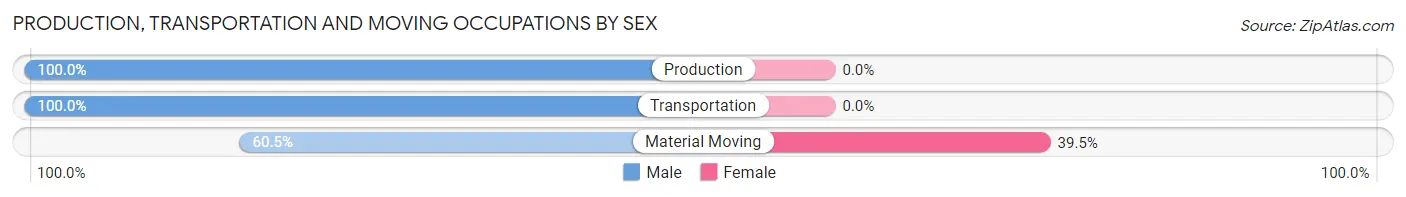
| Occupation | Male | Female |
| Production | 98 (100.0%) | 0 (0.0%) |
| Transportation | 22 (100.0%) | 0 (0.0%) |
| Material Moving | 23 (60.5%) | 15 (39.5%) |
| Total (Category) | 143 (90.5%) | 15 (9.5%) |
| Total (Overall) | 351 (55.1%) | 286 (44.9%) |
Employment Industries by Sex in Kettle Falls
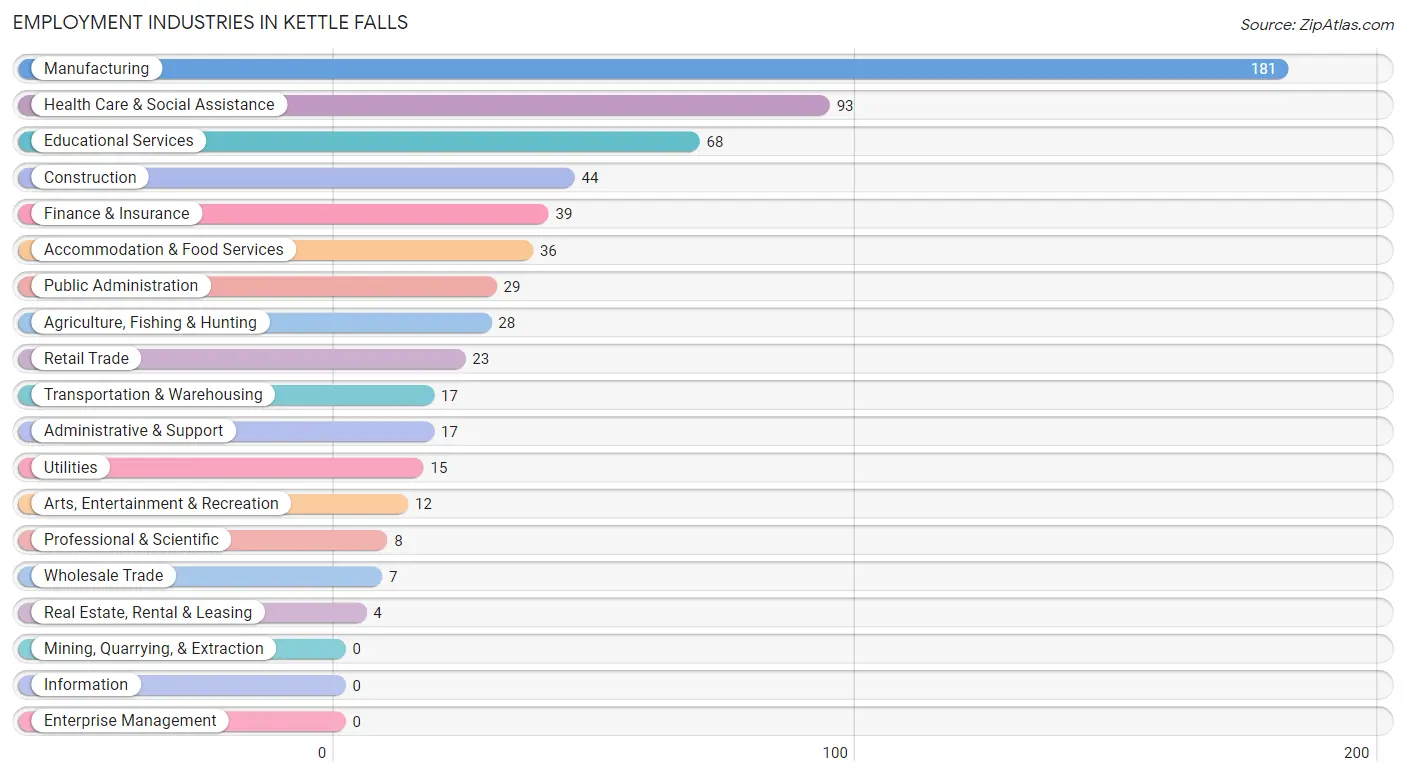
Employment Industries in Kettle Falls
The major employment industries in Kettle Falls include Manufacturing (181 | 28.4%), Health Care & Social Assistance (93 | 14.6%), Educational Services (68 | 10.7%), Construction (44 | 6.9%), and Finance & Insurance (39 | 6.1%).
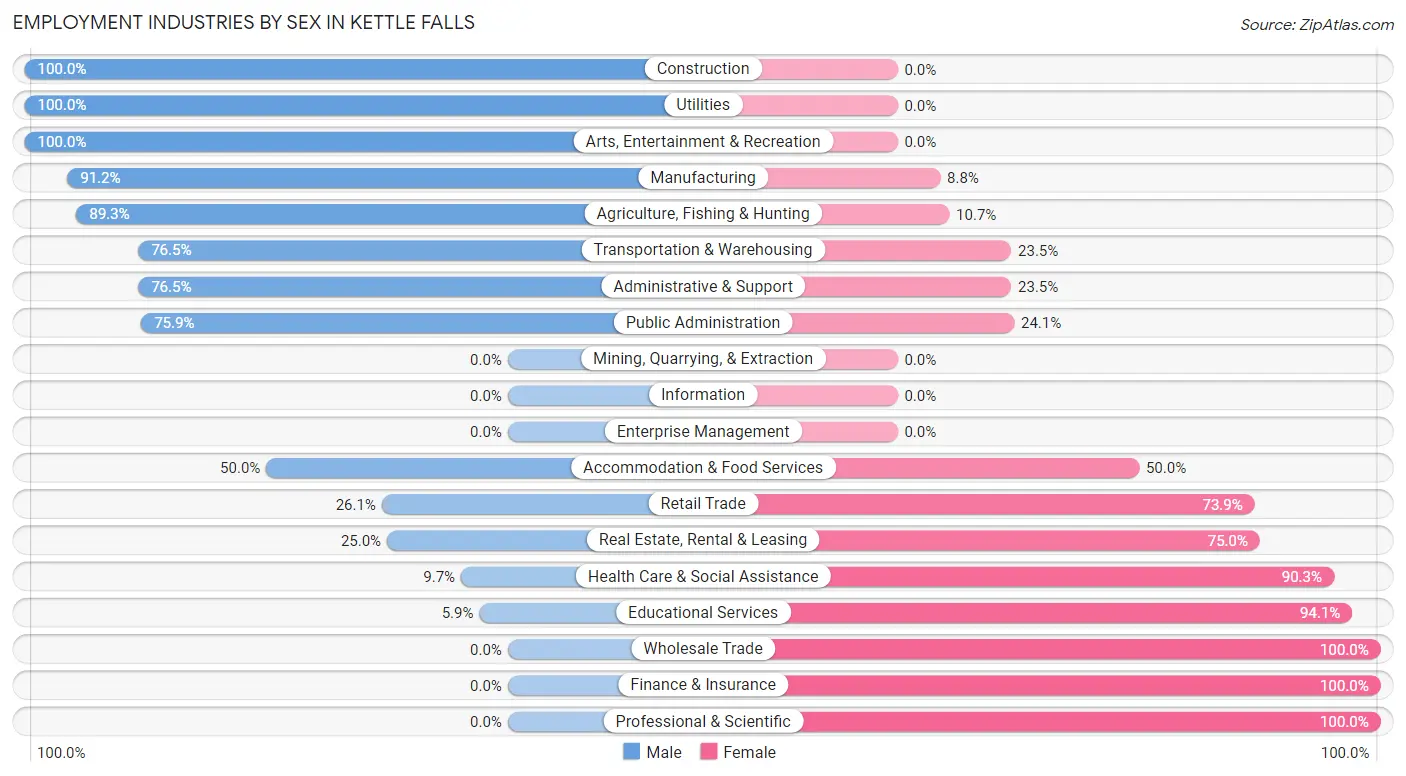
Employment Industries by Sex in Kettle Falls
The Kettle Falls industries that see more men than women are Construction (100.0%), Utilities (100.0%), and Arts, Entertainment & Recreation (100.0%), whereas the industries that tend to have a higher number of women are Wholesale Trade (100.0%), Finance & Insurance (100.0%), and Professional & Scientific (100.0%).
| Industry | Male | Female |
| Agriculture, Fishing & Hunting | 25 (89.3%) | 3 (10.7%) |
| Mining, Quarrying, & Extraction | 0 (0.0%) | 0 (0.0%) |
| Construction | 44 (100.0%) | 0 (0.0%) |
| Manufacturing | 165 (91.2%) | 16 (8.8%) |
| Wholesale Trade | 0 (0.0%) | 7 (100.0%) |
| Retail Trade | 6 (26.1%) | 17 (73.9%) |
| Transportation & Warehousing | 13 (76.5%) | 4 (23.5%) |
| Utilities | 15 (100.0%) | 0 (0.0%) |
| Information | 0 (0.0%) | 0 (0.0%) |
| Finance & Insurance | 0 (0.0%) | 39 (100.0%) |
| Real Estate, Rental & Leasing | 1 (25.0%) | 3 (75.0%) |
| Professional & Scientific | 0 (0.0%) | 8 (100.0%) |
| Enterprise Management | 0 (0.0%) | 0 (0.0%) |
| Administrative & Support | 13 (76.5%) | 4 (23.5%) |
| Educational Services | 4 (5.9%) | 64 (94.1%) |
| Health Care & Social Assistance | 9 (9.7%) | 84 (90.3%) |
| Arts, Entertainment & Recreation | 12 (100.0%) | 0 (0.0%) |
| Accommodation & Food Services | 18 (50.0%) | 18 (50.0%) |
| Public Administration | 22 (75.9%) | 7 (24.1%) |
| Total | 351 (55.1%) | 286 (44.9%) |
Education in Kettle Falls
School Enrollment in Kettle Falls
The most common levels of schooling among the 262 students in Kettle Falls are high school (75 | 28.6%), elementary school (56 | 21.4%), and middle school (55 | 21.0%).
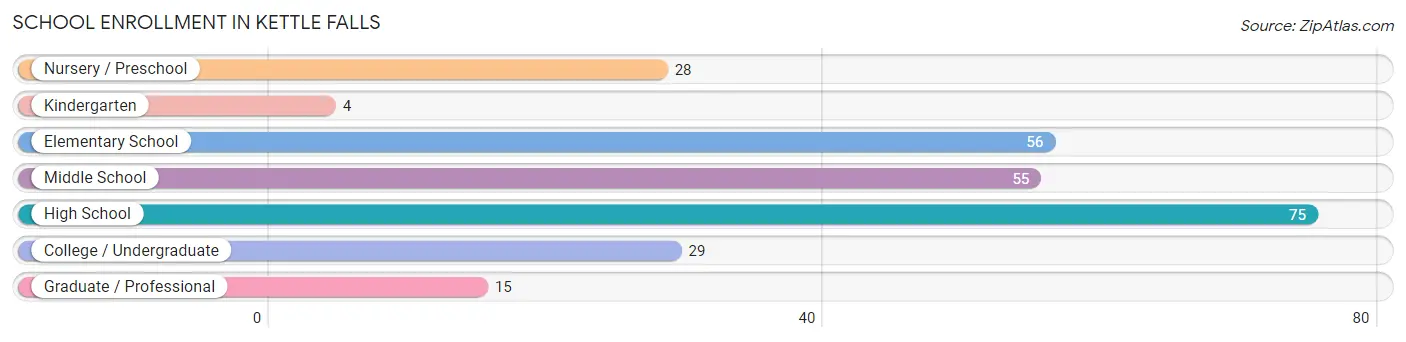
| School Level | # Students | % Students |
| Nursery / Preschool | 28 | 10.7% |
| Kindergarten | 4 | 1.5% |
| Elementary School | 56 | 21.4% |
| Middle School | 55 | 21.0% |
| High School | 75 | 28.6% |
| College / Undergraduate | 29 | 11.1% |
| Graduate / Professional | 15 | 5.7% |
| Total | 262 | 100.0% |
School Enrollment by Age by Funding Source in Kettle Falls
Out of a total of 262 students who are enrolled in schools in Kettle Falls, 26 (9.9%) attend a private institution, while the remaining 236 (90.1%) are enrolled in public schools. The age group of 3 to 4 year olds has the highest likelihood of being enrolled in private schools, with 6 (54.5% in the age bracket) enrolled. Conversely, the age group of 15 to 17 year olds has the lowest likelihood of being enrolled in a private school, with 39 (100.0% in the age bracket) attending a public institution.
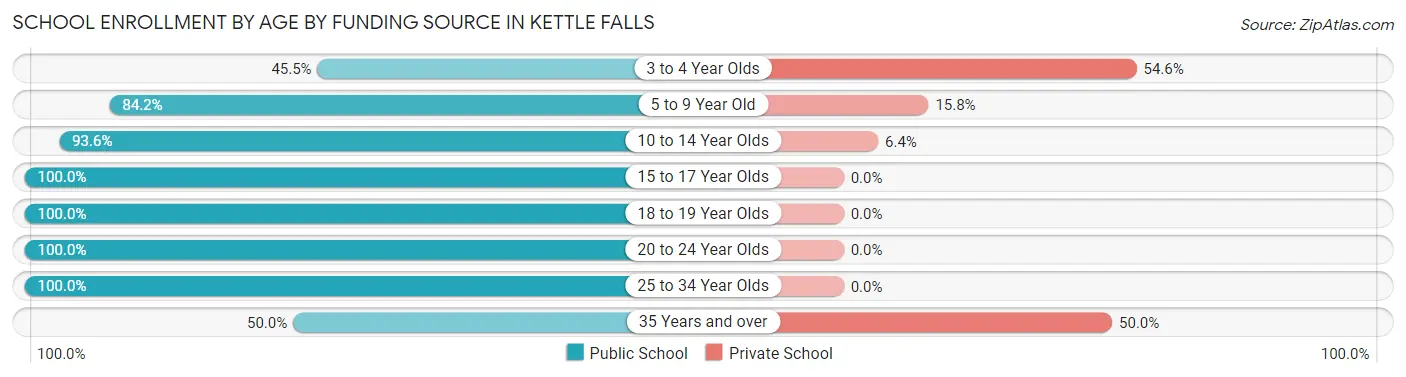
| Age Bracket | Public School | Private School |
| 3 to 4 Year Olds | 5 (45.5%) | 6 (54.5%) |
| 5 to 9 Year Old | 48 (84.2%) | 9 (15.8%) |
| 10 to 14 Year Olds | 73 (93.6%) | 5 (6.4%) |
| 15 to 17 Year Olds | 39 (100.0%) | 0 (0.0%) |
| 18 to 19 Year Olds | 33 (100.0%) | 0 (0.0%) |
| 20 to 24 Year Olds | 9 (100.0%) | 0 (0.0%) |
| 25 to 34 Year Olds | 23 (100.0%) | 0 (0.0%) |
| 35 Years and over | 6 (50.0%) | 6 (50.0%) |
| Total | 236 (90.1%) | 26 (9.9%) |
Educational Attainment by Field of Study in Kettle Falls
Education (74 | 25.3%), bio, nature & agricultural (56 | 19.2%), business (48 | 16.4%), psychology (22 | 7.5%), and visual & performing arts (22 | 7.5%) are the most common fields of study among 292 individuals in Kettle Falls who have obtained a bachelor's degree or higher.
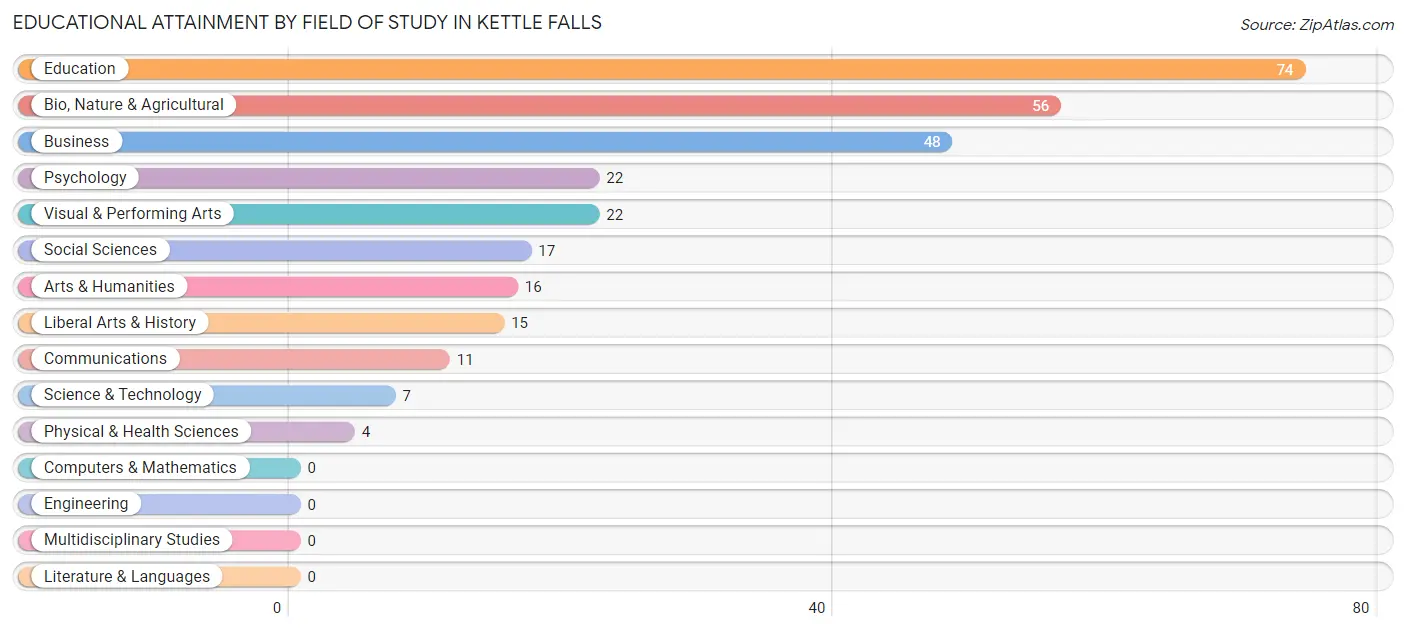
| Field of Study | # Graduates | % Graduates |
| Computers & Mathematics | 0 | 0.0% |
| Bio, Nature & Agricultural | 56 | 19.2% |
| Physical & Health Sciences | 4 | 1.4% |
| Psychology | 22 | 7.5% |
| Social Sciences | 17 | 5.8% |
| Engineering | 0 | 0.0% |
| Multidisciplinary Studies | 0 | 0.0% |
| Science & Technology | 7 | 2.4% |
| Business | 48 | 16.4% |
| Education | 74 | 25.3% |
| Literature & Languages | 0 | 0.0% |
| Liberal Arts & History | 15 | 5.1% |
| Visual & Performing Arts | 22 | 7.5% |
| Communications | 11 | 3.8% |
| Arts & Humanities | 16 | 5.5% |
| Total | 292 | 100.0% |
Transportation & Commute in Kettle Falls
Vehicle Availability by Sex in Kettle Falls
The most prevalent vehicle ownership categories in Kettle Falls are males with 2 vehicles (175, accounting for 49.9%) and females with 2 vehicles (74, making up 61.8%).
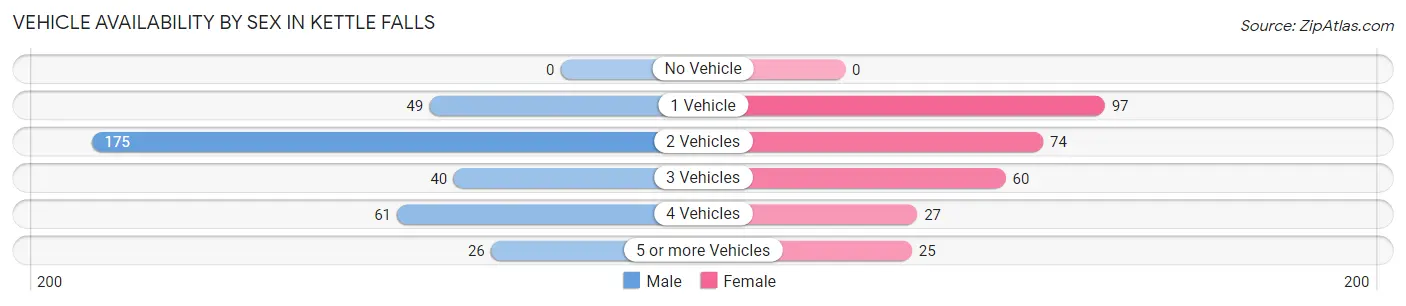
| Vehicles Available | Male | Female |
| No Vehicle | 0 (0.0%) | 0 (0.0%) |
| 1 Vehicle | 49 (14.0%) | 97 (34.3%) |
| 2 Vehicles | 175 (49.9%) | 74 (26.2%) |
| 3 Vehicles | 40 (11.4%) | 60 (21.2%) |
| 4 Vehicles | 61 (17.4%) | 27 (9.5%) |
| 5 or more Vehicles | 26 (7.4%) | 25 (8.8%) |
| Total | 351 (100.0%) | 283 (100.0%) |
Commute Time in Kettle Falls
The most frequently occuring commute durations in Kettle Falls are 20 to 24 minutes (169 commuters, 27.8%), 10 to 14 minutes (127 commuters, 20.8%), and 15 to 19 minutes (104 commuters, 17.1%).
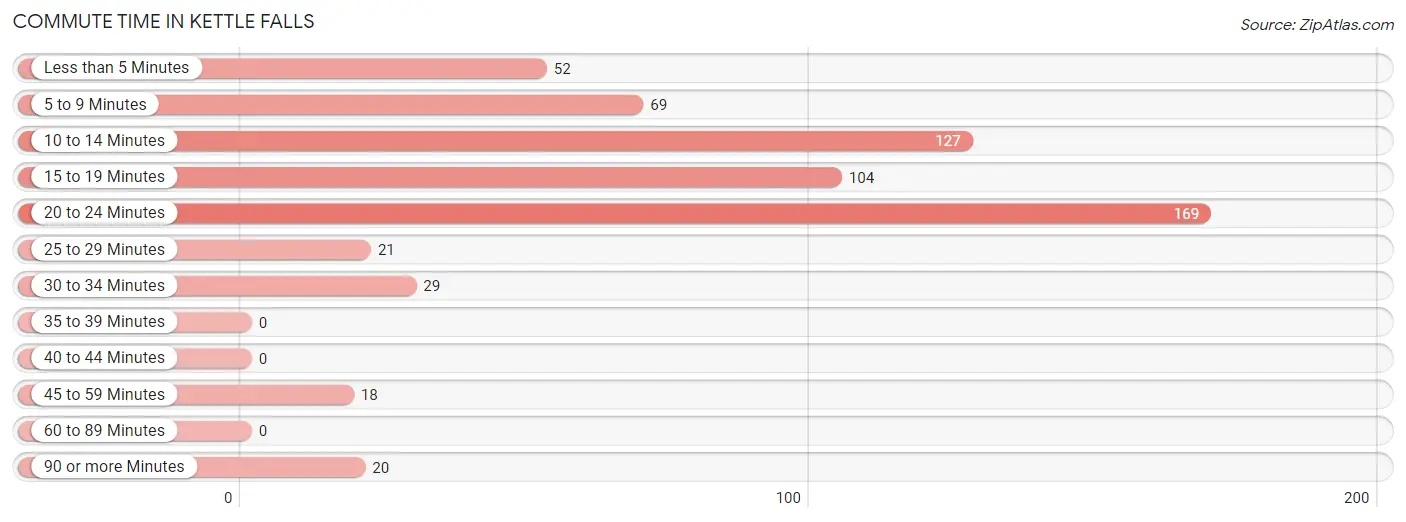
| Commute Time | # Commuters | % Commuters |
| Less than 5 Minutes | 52 | 8.5% |
| 5 to 9 Minutes | 69 | 11.3% |
| 10 to 14 Minutes | 127 | 20.8% |
| 15 to 19 Minutes | 104 | 17.1% |
| 20 to 24 Minutes | 169 | 27.8% |
| 25 to 29 Minutes | 21 | 3.5% |
| 30 to 34 Minutes | 29 | 4.8% |
| 35 to 39 Minutes | 0 | 0.0% |
| 40 to 44 Minutes | 0 | 0.0% |
| 45 to 59 Minutes | 18 | 3.0% |
| 60 to 89 Minutes | 0 | 0.0% |
| 90 or more Minutes | 20 | 3.3% |
Commute Time by Sex in Kettle Falls
The most common commute times in Kettle Falls are 20 to 24 minutes (104 commuters, 30.1%) for males and 10 to 14 minutes (75 commuters, 28.5%) for females.
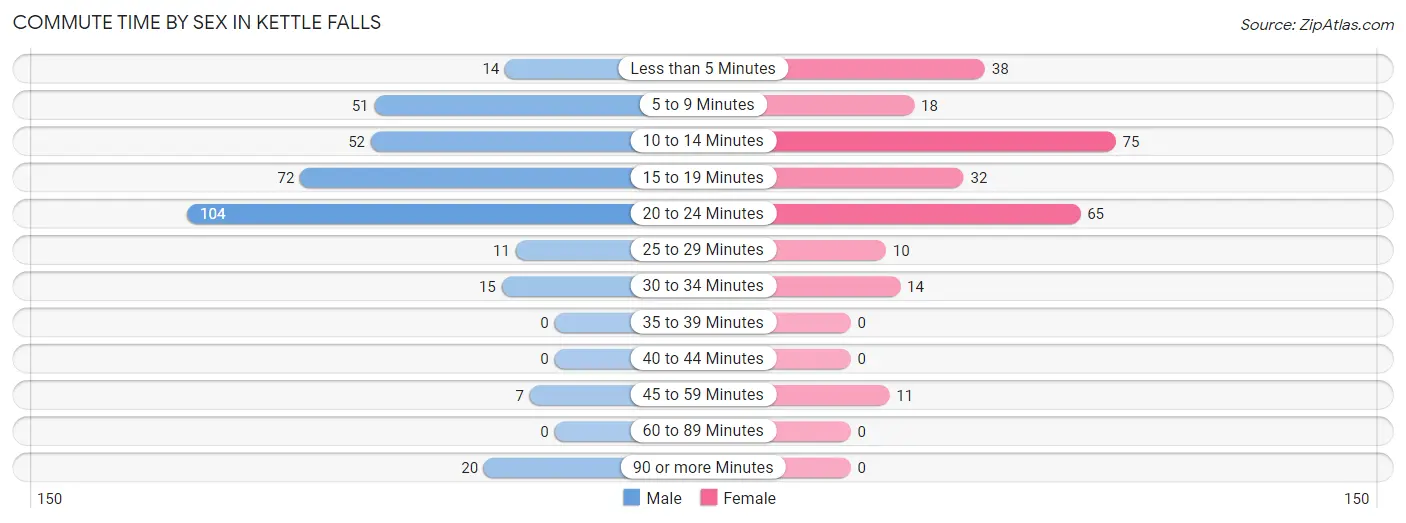
| Commute Time | Male | Female |
| Less than 5 Minutes | 14 (4.1%) | 38 (14.4%) |
| 5 to 9 Minutes | 51 (14.7%) | 18 (6.8%) |
| 10 to 14 Minutes | 52 (15.0%) | 75 (28.5%) |
| 15 to 19 Minutes | 72 (20.8%) | 32 (12.2%) |
| 20 to 24 Minutes | 104 (30.1%) | 65 (24.7%) |
| 25 to 29 Minutes | 11 (3.2%) | 10 (3.8%) |
| 30 to 34 Minutes | 15 (4.3%) | 14 (5.3%) |
| 35 to 39 Minutes | 0 (0.0%) | 0 (0.0%) |
| 40 to 44 Minutes | 0 (0.0%) | 0 (0.0%) |
| 45 to 59 Minutes | 7 (2.0%) | 11 (4.2%) |
| 60 to 89 Minutes | 0 (0.0%) | 0 (0.0%) |
| 90 or more Minutes | 20 (5.8%) | 0 (0.0%) |
Time of Departure to Work by Sex in Kettle Falls
The most frequent times of departure to work in Kettle Falls are 5:30 AM to 5:59 AM (76, 22.0%) for males and 7:00 AM to 7:29 AM (62, 23.6%) for females.
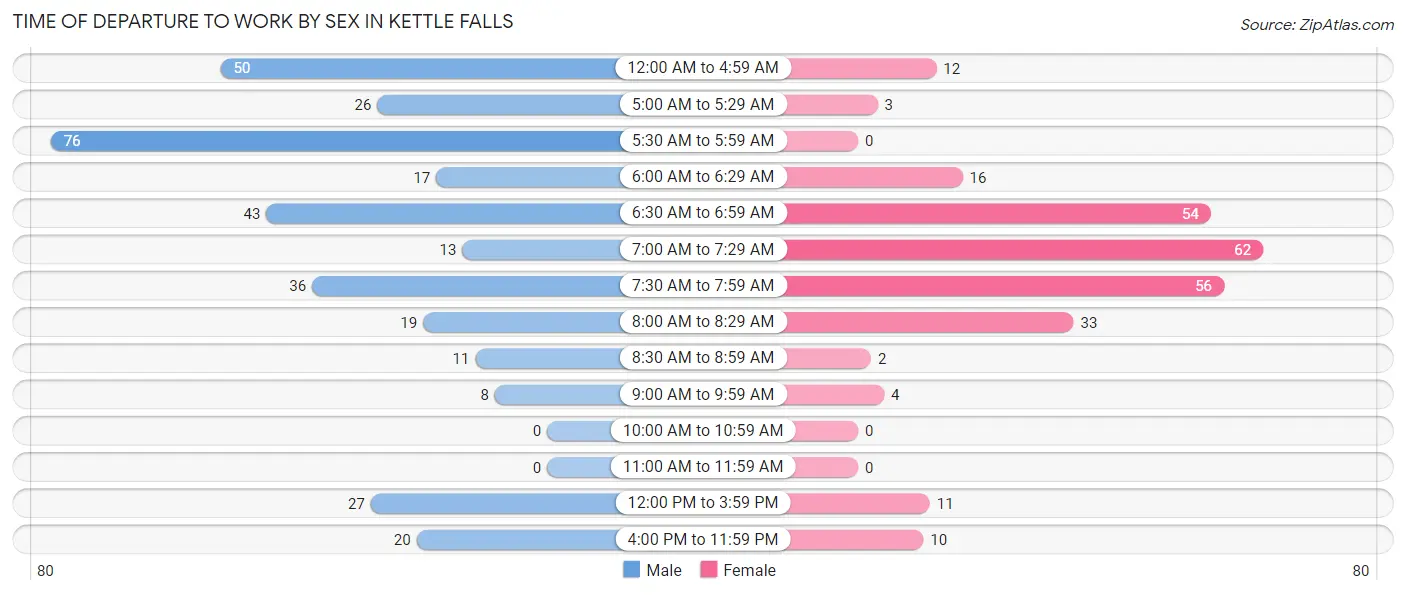
| Time of Departure | Male | Female |
| 12:00 AM to 4:59 AM | 50 (14.4%) | 12 (4.6%) |
| 5:00 AM to 5:29 AM | 26 (7.5%) | 3 (1.1%) |
| 5:30 AM to 5:59 AM | 76 (22.0%) | 0 (0.0%) |
| 6:00 AM to 6:29 AM | 17 (4.9%) | 16 (6.1%) |
| 6:30 AM to 6:59 AM | 43 (12.4%) | 54 (20.5%) |
| 7:00 AM to 7:29 AM | 13 (3.8%) | 62 (23.6%) |
| 7:30 AM to 7:59 AM | 36 (10.4%) | 56 (21.3%) |
| 8:00 AM to 8:29 AM | 19 (5.5%) | 33 (12.6%) |
| 8:30 AM to 8:59 AM | 11 (3.2%) | 2 (0.8%) |
| 9:00 AM to 9:59 AM | 8 (2.3%) | 4 (1.5%) |
| 10:00 AM to 10:59 AM | 0 (0.0%) | 0 (0.0%) |
| 11:00 AM to 11:59 AM | 0 (0.0%) | 0 (0.0%) |
| 12:00 PM to 3:59 PM | 27 (7.8%) | 11 (4.2%) |
| 4:00 PM to 11:59 PM | 20 (5.8%) | 10 (3.8%) |
| Total | 346 (100.0%) | 263 (100.0%) |
Housing Occupancy in Kettle Falls
Occupancy by Ownership in Kettle Falls
Of the total 732 dwellings in Kettle Falls, owner-occupied units account for 429 (58.6%), while renter-occupied units make up 303 (41.4%).
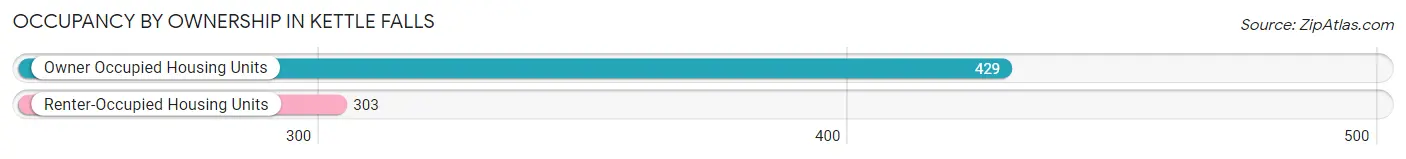
| Occupancy | # Housing Units | % Housing Units |
| Owner Occupied Housing Units | 429 | 58.6% |
| Renter-Occupied Housing Units | 303 | 41.4% |
| Total Occupied Housing Units | 732 | 100.0% |
Occupancy by Household Size in Kettle Falls
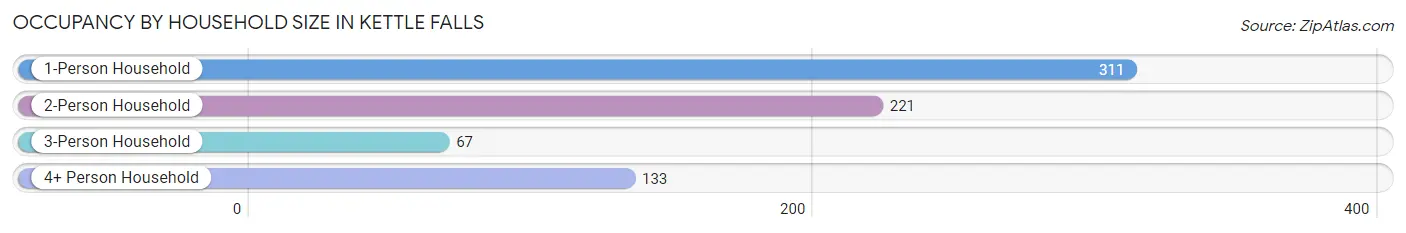
| Household Size | # Housing Units | % Housing Units |
| 1-Person Household | 311 | 42.5% |
| 2-Person Household | 221 | 30.2% |
| 3-Person Household | 67 | 9.1% |
| 4+ Person Household | 133 | 18.2% |
| Total Housing Units | 732 | 100.0% |
Occupancy by Ownership by Household Size in Kettle Falls
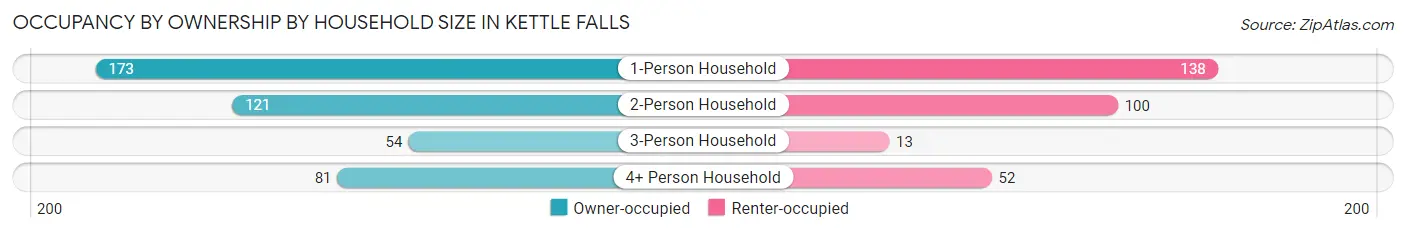
| Household Size | Owner-occupied | Renter-occupied |
| 1-Person Household | 173 (55.6%) | 138 (44.4%) |
| 2-Person Household | 121 (54.7%) | 100 (45.3%) |
| 3-Person Household | 54 (80.6%) | 13 (19.4%) |
| 4+ Person Household | 81 (60.9%) | 52 (39.1%) |
| Total Housing Units | 429 (58.6%) | 303 (41.4%) |
Occupancy by Educational Attainment in Kettle Falls
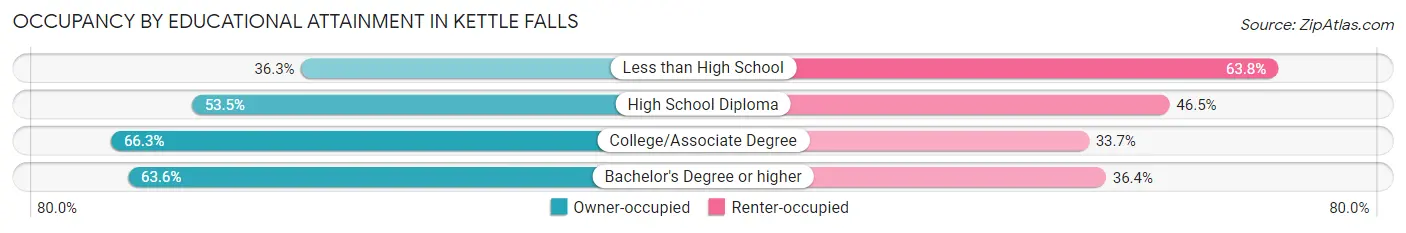
| Household Size | Owner-occupied | Renter-occupied |
| Less than High School | 29 (36.2%) | 51 (63.7%) |
| High School Diploma | 115 (53.5%) | 100 (46.5%) |
| College/Associate Degree | 175 (66.3%) | 89 (33.7%) |
| Bachelor's Degree or higher | 110 (63.6%) | 63 (36.4%) |
Occupancy by Age of Householder in Kettle Falls
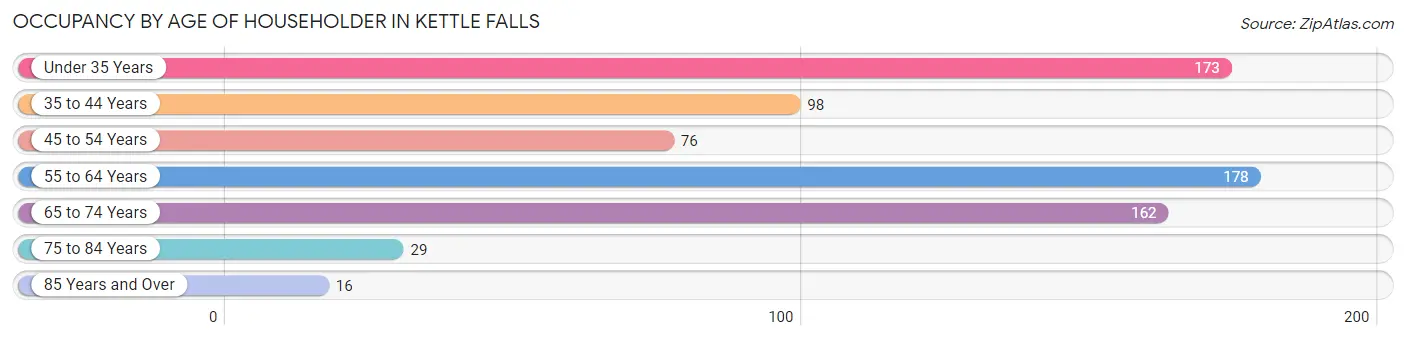
| Age Bracket | # Households | % Households |
| Under 35 Years | 173 | 23.6% |
| 35 to 44 Years | 98 | 13.4% |
| 45 to 54 Years | 76 | 10.4% |
| 55 to 64 Years | 178 | 24.3% |
| 65 to 74 Years | 162 | 22.1% |
| 75 to 84 Years | 29 | 4.0% |
| 85 Years and Over | 16 | 2.2% |
| Total | 732 | 100.0% |
Housing Finances in Kettle Falls
Median Income by Occupancy in Kettle Falls
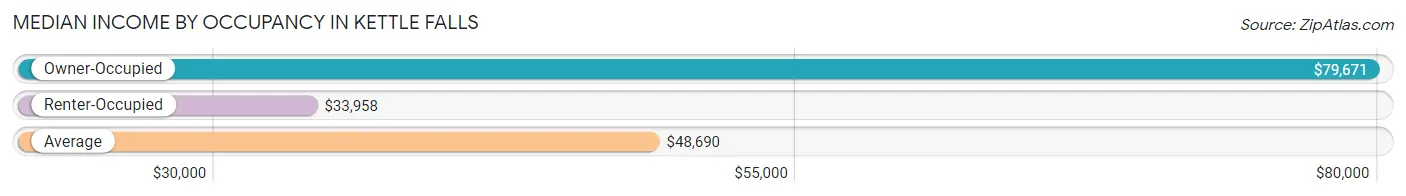
| Occupancy Type | # Households | Median Income |
| Owner-Occupied | 429 (58.6%) | $79,671 |
| Renter-Occupied | 303 (41.4%) | $33,958 |
| Average | 732 (100.0%) | $48,690 |
Occupancy by Householder Income Bracket in Kettle Falls
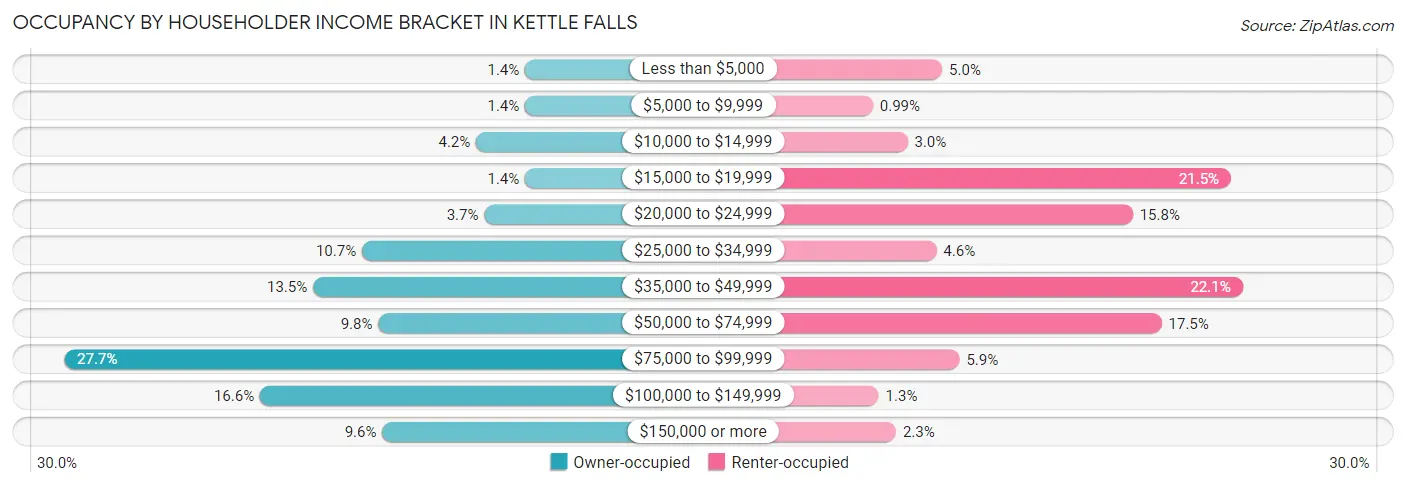
| Income Bracket | Owner-occupied | Renter-occupied |
| Less than $5,000 | 6 (1.4%) | 15 (5.0%) |
| $5,000 to $9,999 | 6 (1.4%) | 3 (1.0%) |
| $10,000 to $14,999 | 18 (4.2%) | 9 (3.0%) |
| $15,000 to $19,999 | 6 (1.4%) | 65 (21.4%) |
| $20,000 to $24,999 | 16 (3.7%) | 48 (15.8%) |
| $25,000 to $34,999 | 46 (10.7%) | 14 (4.6%) |
| $35,000 to $49,999 | 58 (13.5%) | 67 (22.1%) |
| $50,000 to $74,999 | 42 (9.8%) | 53 (17.5%) |
| $75,000 to $99,999 | 119 (27.7%) | 18 (5.9%) |
| $100,000 to $149,999 | 71 (16.6%) | 4 (1.3%) |
| $150,000 or more | 41 (9.6%) | 7 (2.3%) |
| Total | 429 (100.0%) | 303 (100.0%) |
Monthly Housing Cost Tiers in Kettle Falls
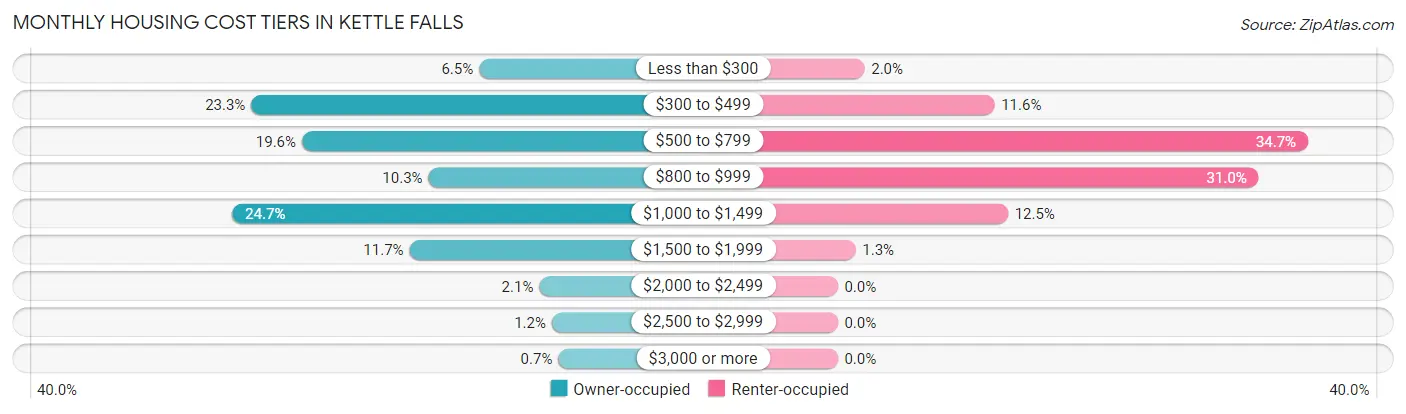
| Monthly Cost | Owner-occupied | Renter-occupied |
| Less than $300 | 28 (6.5%) | 6 (2.0%) |
| $300 to $499 | 100 (23.3%) | 35 (11.6%) |
| $500 to $799 | 84 (19.6%) | 105 (34.6%) |
| $800 to $999 | 44 (10.3%) | 94 (31.0%) |
| $1,000 to $1,499 | 106 (24.7%) | 38 (12.5%) |
| $1,500 to $1,999 | 50 (11.7%) | 4 (1.3%) |
| $2,000 to $2,499 | 9 (2.1%) | 0 (0.0%) |
| $2,500 to $2,999 | 5 (1.2%) | 0 (0.0%) |
| $3,000 or more | 3 (0.7%) | 0 (0.0%) |
| Total | 429 (100.0%) | 303 (100.0%) |
Physical Housing Characteristics in Kettle Falls
Housing Structures in Kettle Falls
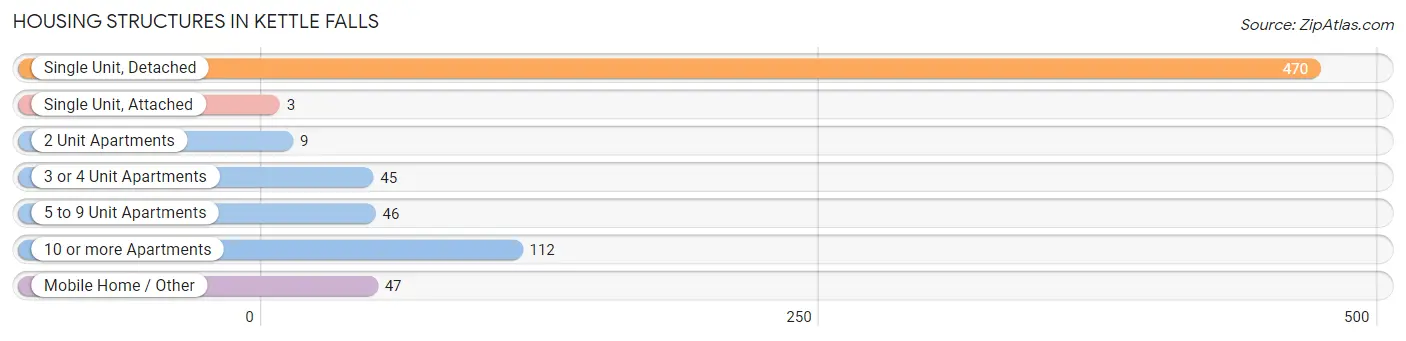
| Structure Type | # Housing Units | % Housing Units |
| Single Unit, Detached | 470 | 64.2% |
| Single Unit, Attached | 3 | 0.4% |
| 2 Unit Apartments | 9 | 1.2% |
| 3 or 4 Unit Apartments | 45 | 6.1% |
| 5 to 9 Unit Apartments | 46 | 6.3% |
| 10 or more Apartments | 112 | 15.3% |
| Mobile Home / Other | 47 | 6.4% |
| Total | 732 | 100.0% |
Housing Structures by Occupancy in Kettle Falls
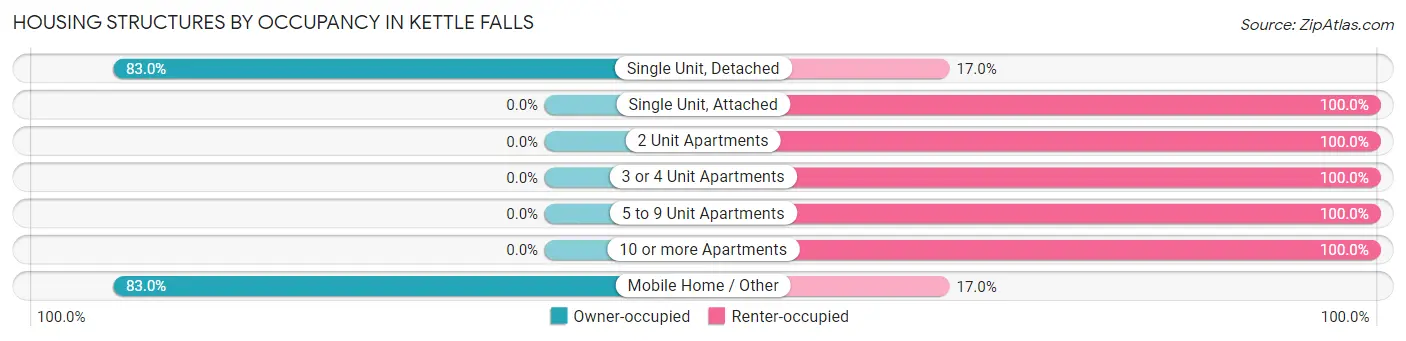
| Structure Type | Owner-occupied | Renter-occupied |
| Single Unit, Detached | 390 (83.0%) | 80 (17.0%) |
| Single Unit, Attached | 0 (0.0%) | 3 (100.0%) |
| 2 Unit Apartments | 0 (0.0%) | 9 (100.0%) |
| 3 or 4 Unit Apartments | 0 (0.0%) | 45 (100.0%) |
| 5 to 9 Unit Apartments | 0 (0.0%) | 46 (100.0%) |
| 10 or more Apartments | 0 (0.0%) | 112 (100.0%) |
| Mobile Home / Other | 39 (83.0%) | 8 (17.0%) |
| Total | 429 (58.6%) | 303 (41.4%) |
Housing Structures by Number of Rooms in Kettle Falls
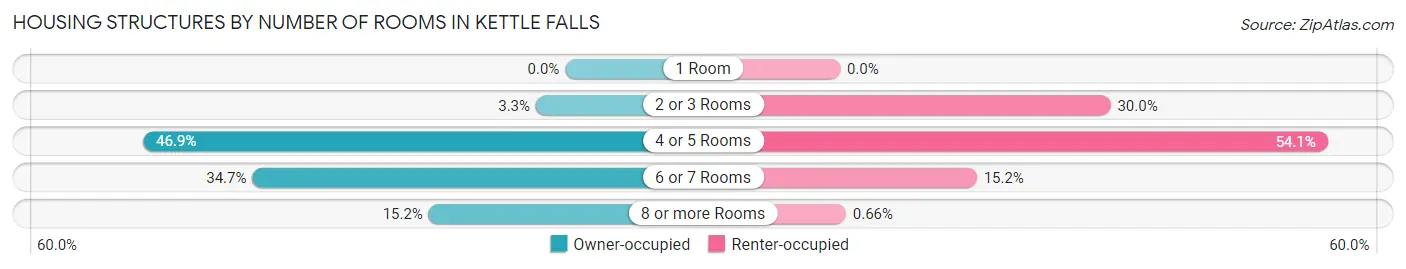
| Number of Rooms | Owner-occupied | Renter-occupied |
| 1 Room | 0 (0.0%) | 0 (0.0%) |
| 2 or 3 Rooms | 14 (3.3%) | 91 (30.0%) |
| 4 or 5 Rooms | 201 (46.9%) | 164 (54.1%) |
| 6 or 7 Rooms | 149 (34.7%) | 46 (15.2%) |
| 8 or more Rooms | 65 (15.1%) | 2 (0.7%) |
| Total | 429 (100.0%) | 303 (100.0%) |
Housing Structure by Heating Type in Kettle Falls
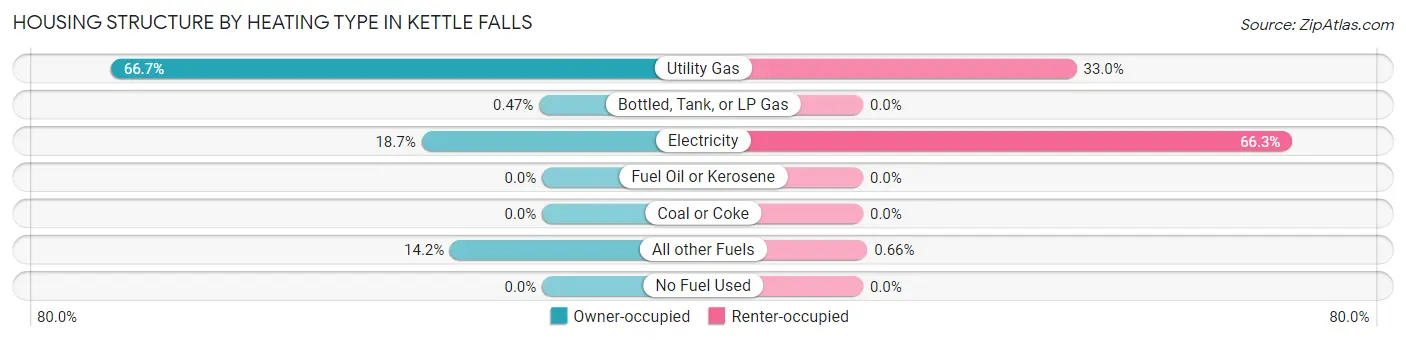
| Heating Type | Owner-occupied | Renter-occupied |
| Utility Gas | 286 (66.7%) | 100 (33.0%) |
| Bottled, Tank, or LP Gas | 2 (0.5%) | 0 (0.0%) |
| Electricity | 80 (18.6%) | 201 (66.3%) |
| Fuel Oil or Kerosene | 0 (0.0%) | 0 (0.0%) |
| Coal or Coke | 0 (0.0%) | 0 (0.0%) |
| All other Fuels | 61 (14.2%) | 2 (0.7%) |
| No Fuel Used | 0 (0.0%) | 0 (0.0%) |
| Total | 429 (100.0%) | 303 (100.0%) |
Household Vehicle Usage in Kettle Falls
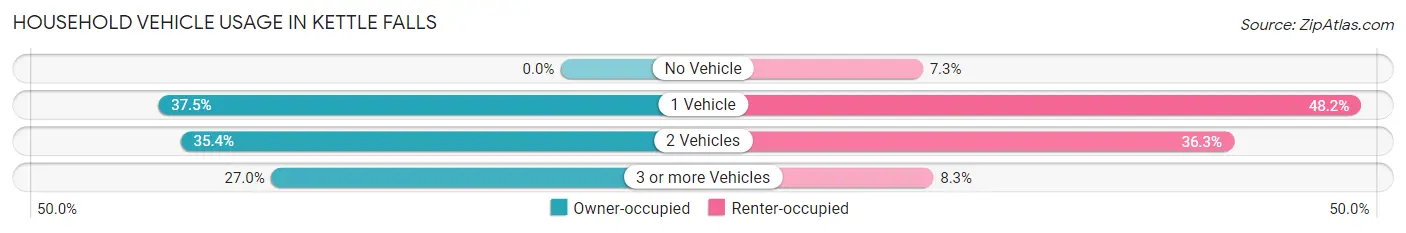
| Vehicles per Household | Owner-occupied | Renter-occupied |
| No Vehicle | 0 (0.0%) | 22 (7.3%) |
| 1 Vehicle | 161 (37.5%) | 146 (48.2%) |
| 2 Vehicles | 152 (35.4%) | 110 (36.3%) |
| 3 or more Vehicles | 116 (27.0%) | 25 (8.3%) |
| Total | 429 (100.0%) | 303 (100.0%) |
Real Estate & Mortgages in Kettle Falls
Real Estate and Mortgage Overview in Kettle Falls
| Characteristic | Without Mortgage | With Mortgage |
| Housing Units | 148 | 281 |
| Median Property Value | $185,700 | $184,900 |
| Median Household Income | $56,750 | $37 |
| Monthly Housing Costs | $394 | $0 |
| Real Estate Taxes | $1,495 | $6 |
Property Value by Mortgage Status in Kettle Falls
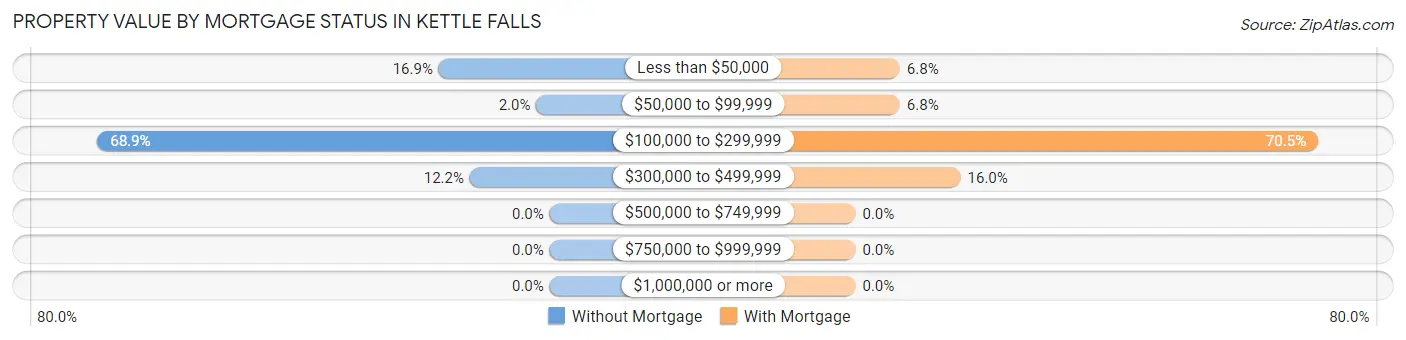
| Property Value | Without Mortgage | With Mortgage |
| Less than $50,000 | 25 (16.9%) | 19 (6.8%) |
| $50,000 to $99,999 | 3 (2.0%) | 19 (6.8%) |
| $100,000 to $299,999 | 102 (68.9%) | 198 (70.5%) |
| $300,000 to $499,999 | 18 (12.2%) | 45 (16.0%) |
| $500,000 to $749,999 | 0 (0.0%) | 0 (0.0%) |
| $750,000 to $999,999 | 0 (0.0%) | 0 (0.0%) |
| $1,000,000 or more | 0 (0.0%) | 0 (0.0%) |
| Total | 148 (100.0%) | 281 (100.0%) |
Household Income by Mortgage Status in Kettle Falls
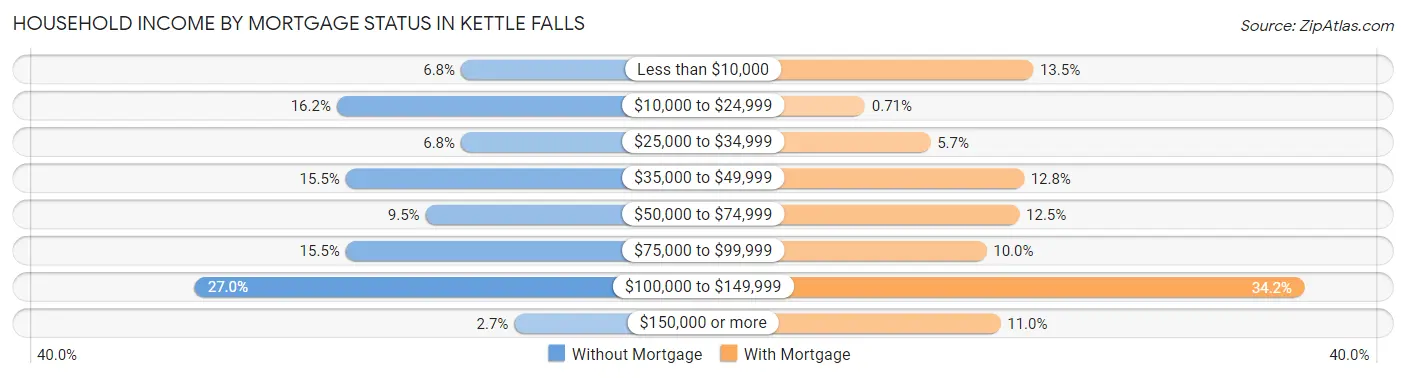
| Household Income | Without Mortgage | With Mortgage |
| Less than $10,000 | 10 (6.8%) | 38 (13.5%) |
| $10,000 to $24,999 | 24 (16.2%) | 2 (0.7%) |
| $25,000 to $34,999 | 10 (6.8%) | 16 (5.7%) |
| $35,000 to $49,999 | 23 (15.5%) | 36 (12.8%) |
| $50,000 to $74,999 | 14 (9.5%) | 35 (12.5%) |
| $75,000 to $99,999 | 23 (15.5%) | 28 (10.0%) |
| $100,000 to $149,999 | 40 (27.0%) | 96 (34.2%) |
| $150,000 or more | 4 (2.7%) | 31 (11.0%) |
| Total | 148 (100.0%) | 281 (100.0%) |
Property Value to Household Income Ratio in Kettle Falls
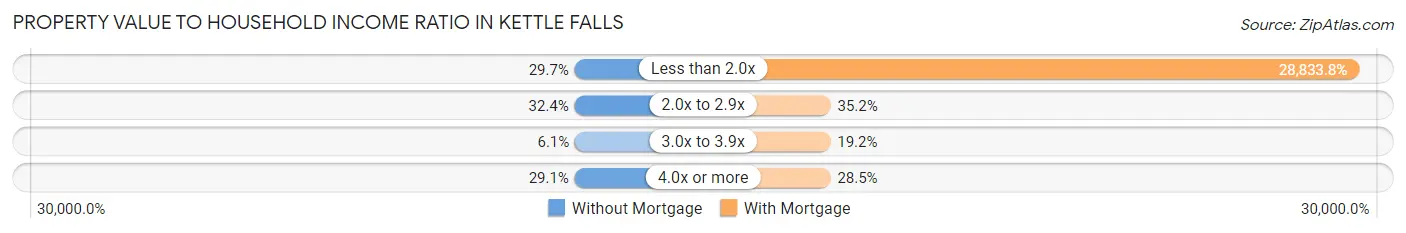
| Value-to-Income Ratio | Without Mortgage | With Mortgage |
| Less than 2.0x | 44 (29.7%) | 81,023 (28,833.8%) |
| 2.0x to 2.9x | 48 (32.4%) | 99 (35.2%) |
| 3.0x to 3.9x | 9 (6.1%) | 54 (19.2%) |
| 4.0x or more | 43 (29.0%) | 80 (28.5%) |
| Total | 148 (100.0%) | 281 (100.0%) |
Real Estate Taxes by Mortgage Status in Kettle Falls
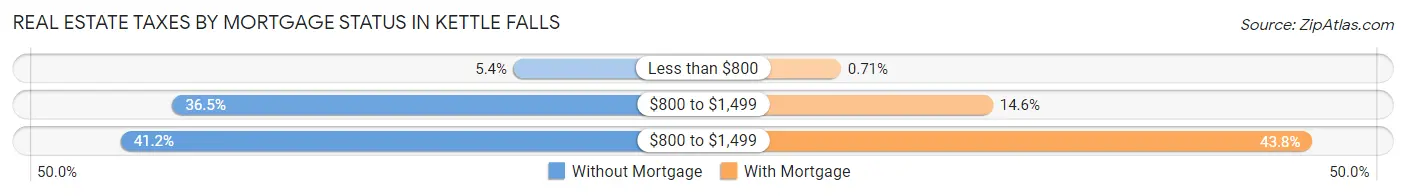
| Property Taxes | Without Mortgage | With Mortgage |
| Less than $800 | 8 (5.4%) | 2 (0.7%) |
| $800 to $1,499 | 54 (36.5%) | 41 (14.6%) |
| $800 to $1,499 | 61 (41.2%) | 123 (43.8%) |
| Total | 148 (100.0%) | 281 (100.0%) |
Health & Disability in Kettle Falls
Health Insurance Coverage by Age in Kettle Falls
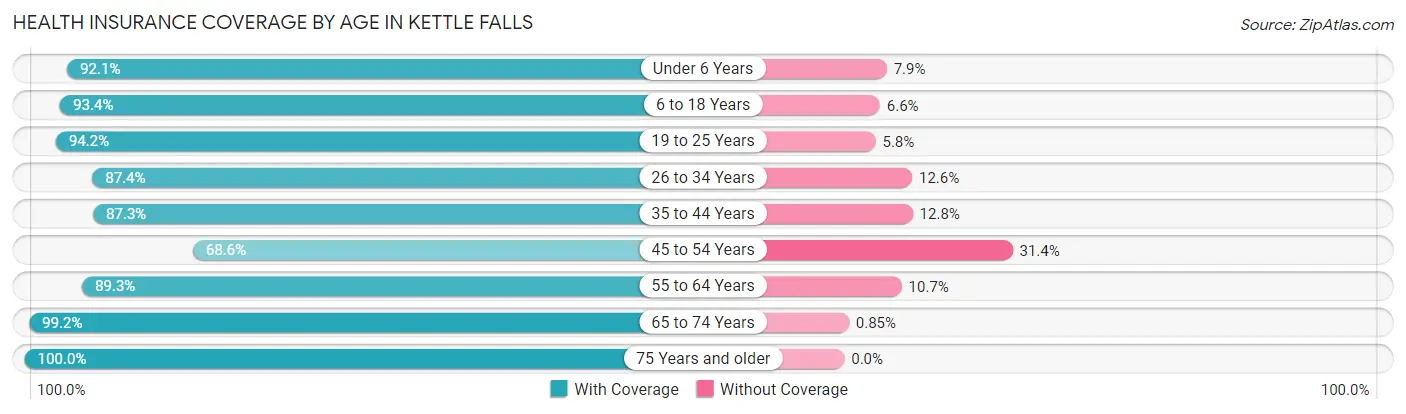
| Age Bracket | With Coverage | Without Coverage |
| Under 6 Years | 163 (92.1%) | 14 (7.9%) |
| 6 to 18 Years | 183 (93.4%) | 13 (6.6%) |
| 19 to 25 Years | 113 (94.2%) | 7 (5.8%) |
| 26 to 34 Years | 166 (87.4%) | 24 (12.6%) |
| 35 to 44 Years | 130 (87.3%) | 19 (12.8%) |
| 45 to 54 Years | 105 (68.6%) | 48 (31.4%) |
| 55 to 64 Years | 242 (89.3%) | 29 (10.7%) |
| 65 to 74 Years | 234 (99.2%) | 2 (0.9%) |
| 75 Years and older | 94 (100.0%) | 0 (0.0%) |
| Total | 1,430 (90.2%) | 156 (9.8%) |
Health Insurance Coverage by Citizenship Status in Kettle Falls
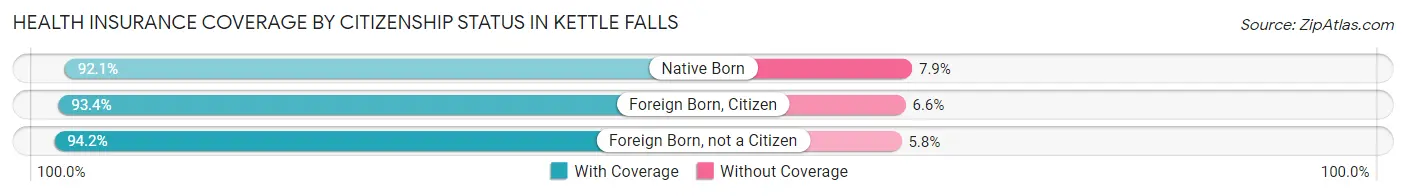
| Citizenship Status | With Coverage | Without Coverage |
| Native Born | 163 (92.1%) | 14 (7.9%) |
| Foreign Born, Citizen | 183 (93.4%) | 13 (6.6%) |
| Foreign Born, not a Citizen | 113 (94.2%) | 7 (5.8%) |
Health Insurance Coverage by Household Income in Kettle Falls
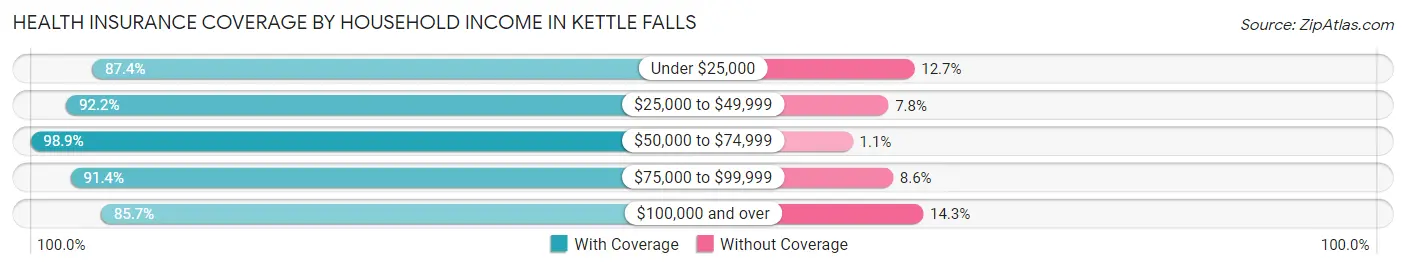
| Household Income | With Coverage | Without Coverage |
| Under $25,000 | 283 (87.4%) | 41 (12.7%) |
| $25,000 to $49,999 | 309 (92.2%) | 26 (7.8%) |
| $50,000 to $74,999 | 183 (98.9%) | 2 (1.1%) |
| $75,000 to $99,999 | 307 (91.4%) | 29 (8.6%) |
| $100,000 and over | 348 (85.7%) | 58 (14.3%) |
Public vs Private Health Insurance Coverage by Age in Kettle Falls
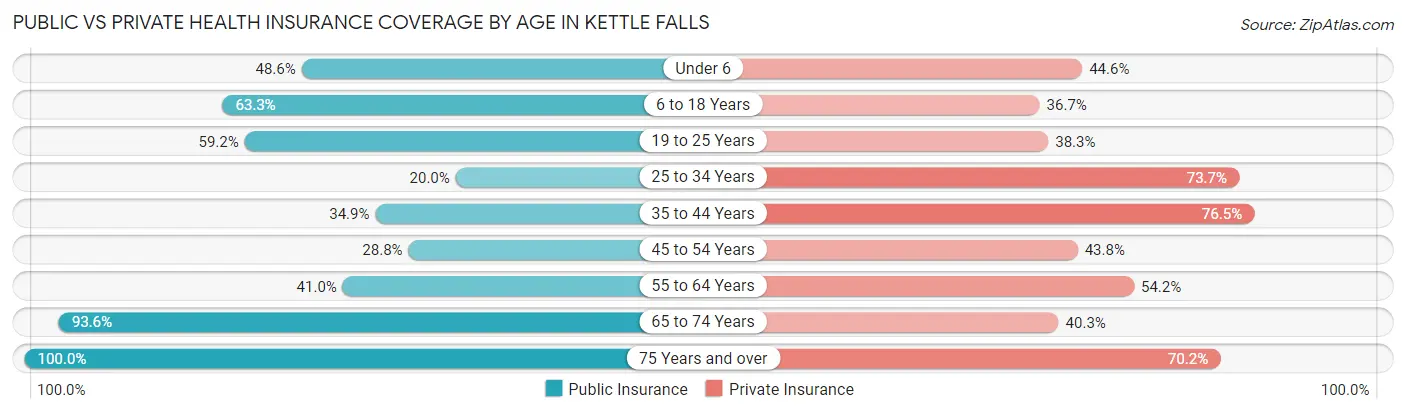
| Age Bracket | Public Insurance | Private Insurance |
| Under 6 | 86 (48.6%) | 79 (44.6%) |
| 6 to 18 Years | 124 (63.3%) | 72 (36.7%) |
| 19 to 25 Years | 71 (59.2%) | 46 (38.3%) |
| 25 to 34 Years | 38 (20.0%) | 140 (73.7%) |
| 35 to 44 Years | 52 (34.9%) | 114 (76.5%) |
| 45 to 54 Years | 44 (28.8%) | 67 (43.8%) |
| 55 to 64 Years | 111 (41.0%) | 147 (54.2%) |
| 65 to 74 Years | 221 (93.6%) | 95 (40.3%) |
| 75 Years and over | 94 (100.0%) | 66 (70.2%) |
| Total | 841 (53.0%) | 826 (52.1%) |
Disability Status by Sex by Age in Kettle Falls
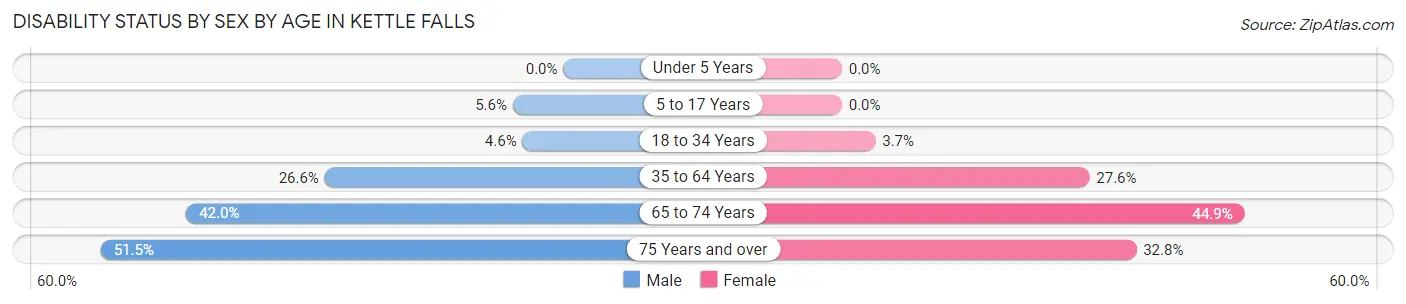
| Age Bracket | Male | Female |
| Under 5 Years | 0 (0.0%) | 0 (0.0%) |
| 5 to 17 Years | 8 (5.6%) | 0 (0.0%) |
| 18 to 34 Years | 8 (4.5%) | 6 (3.7%) |
| 35 to 64 Years | 80 (26.6%) | 75 (27.6%) |
| 65 to 74 Years | 42 (42.0%) | 61 (44.9%) |
| 75 Years and over | 17 (51.5%) | 20 (32.8%) |
Disability Class by Sex by Age in Kettle Falls
Disability Class: Hearing Difficulty
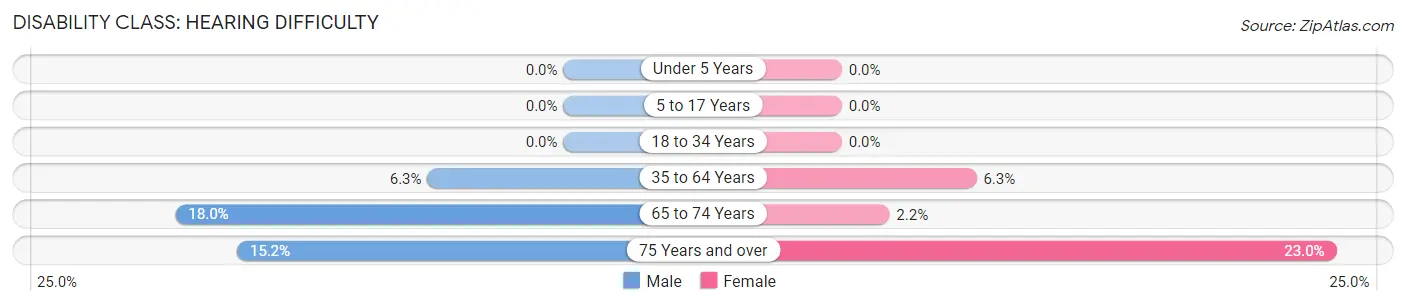
| Age Bracket | Male | Female |
| Under 5 Years | 0 (0.0%) | 0 (0.0%) |
| 5 to 17 Years | 0 (0.0%) | 0 (0.0%) |
| 18 to 34 Years | 0 (0.0%) | 0 (0.0%) |
| 35 to 64 Years | 19 (6.3%) | 17 (6.2%) |
| 65 to 74 Years | 18 (18.0%) | 3 (2.2%) |
| 75 Years and over | 5 (15.1%) | 14 (23.0%) |
Disability Class: Vision Difficulty
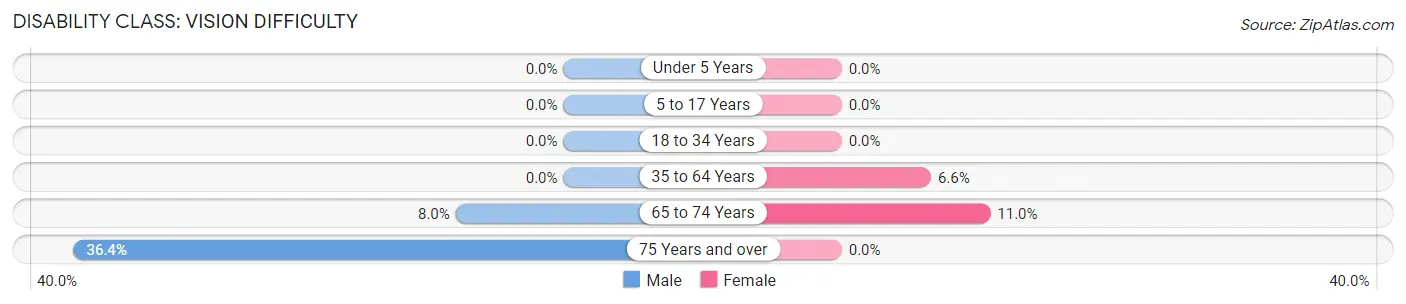
| Age Bracket | Male | Female |
| Under 5 Years | 0 (0.0%) | 0 (0.0%) |
| 5 to 17 Years | 0 (0.0%) | 0 (0.0%) |
| 18 to 34 Years | 0 (0.0%) | 0 (0.0%) |
| 35 to 64 Years | 0 (0.0%) | 18 (6.6%) |
| 65 to 74 Years | 8 (8.0%) | 15 (11.0%) |
| 75 Years and over | 12 (36.4%) | 0 (0.0%) |
Disability Class: Cognitive Difficulty
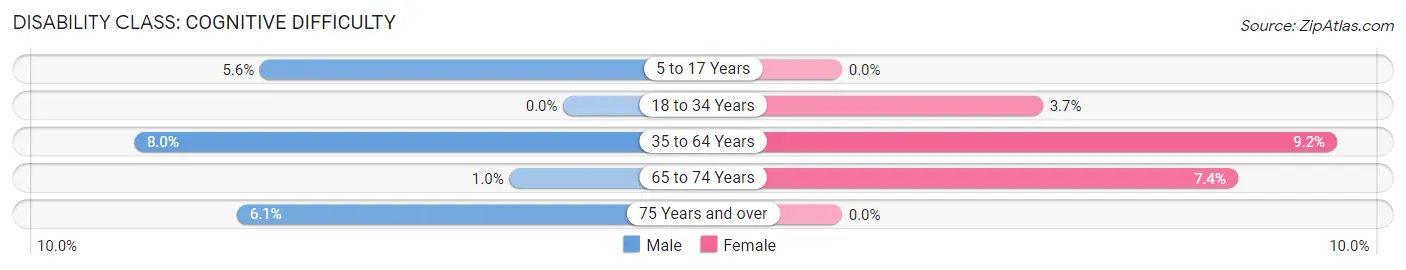
| Age Bracket | Male | Female |
| 5 to 17 Years | 8 (5.6%) | 0 (0.0%) |
| 18 to 34 Years | 0 (0.0%) | 6 (3.7%) |
| 35 to 64 Years | 24 (8.0%) | 25 (9.2%) |
| 65 to 74 Years | 1 (1.0%) | 10 (7.3%) |
| 75 Years and over | 2 (6.1%) | 0 (0.0%) |
Disability Class: Ambulatory Difficulty
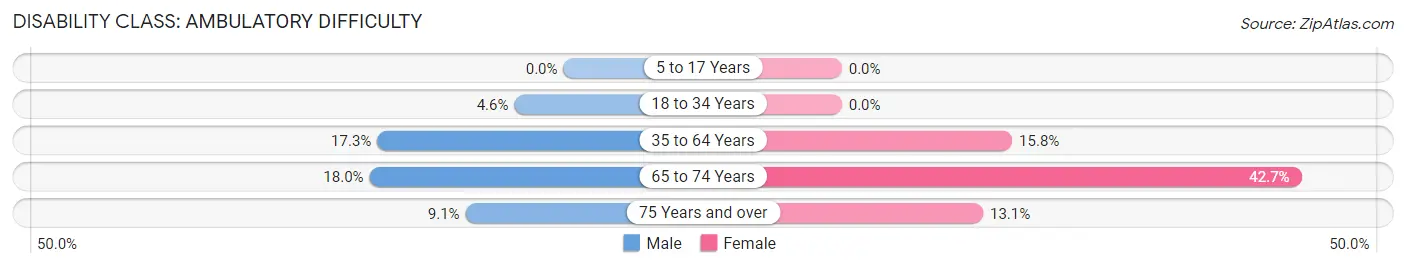
| Age Bracket | Male | Female |
| 5 to 17 Years | 0 (0.0%) | 0 (0.0%) |
| 18 to 34 Years | 8 (4.5%) | 0 (0.0%) |
| 35 to 64 Years | 52 (17.3%) | 43 (15.8%) |
| 65 to 74 Years | 18 (18.0%) | 58 (42.6%) |
| 75 Years and over | 3 (9.1%) | 8 (13.1%) |
Disability Class: Self-Care Difficulty
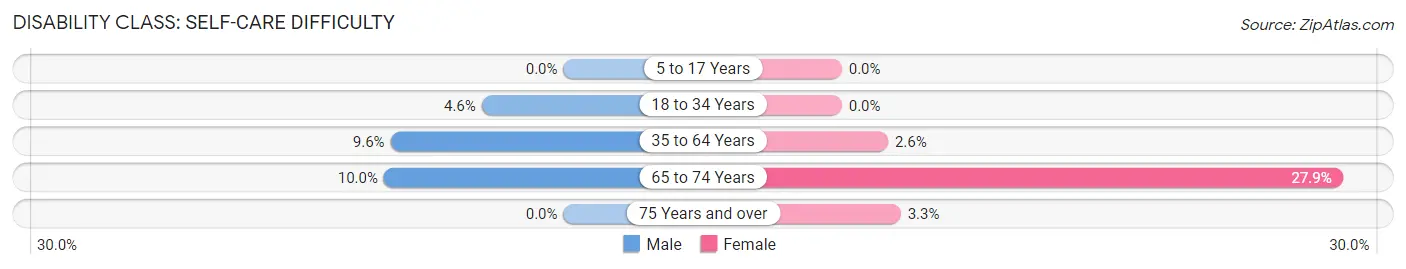
| Age Bracket | Male | Female |
| 5 to 17 Years | 0 (0.0%) | 0 (0.0%) |
| 18 to 34 Years | 8 (4.5%) | 0 (0.0%) |
| 35 to 64 Years | 29 (9.6%) | 7 (2.6%) |
| 65 to 74 Years | 10 (10.0%) | 38 (27.9%) |
| 75 Years and over | 0 (0.0%) | 2 (3.3%) |
Technology Access in Kettle Falls
Computing Device Access in Kettle Falls
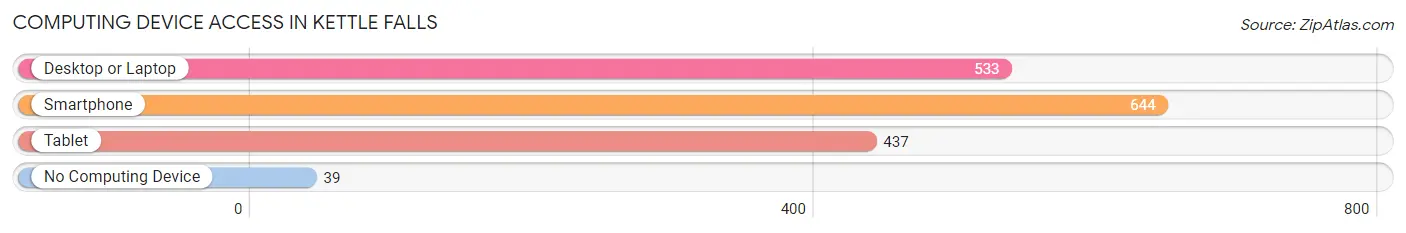
| Device Type | # Households | % Households |
| Desktop or Laptop | 533 | 72.8% |
| Smartphone | 644 | 88.0% |
| Tablet | 437 | 59.7% |
| No Computing Device | 39 | 5.3% |
| Total | 732 | 100.0% |
Internet Access in Kettle Falls
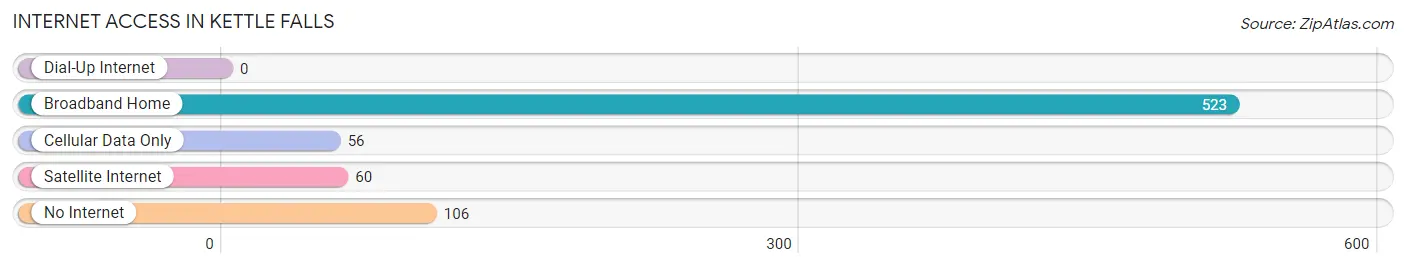
| Internet Type | # Households | % Households |
| Dial-Up Internet | 0 | 0.0% |
| Broadband Home | 523 | 71.5% |
| Cellular Data Only | 56 | 7.6% |
| Satellite Internet | 60 | 8.2% |
| No Internet | 106 | 14.5% |
| Total | 732 | 100.0% |
Kettle Falls Summary
Kettle Falls is a small city located in Stevens County, Washington, United States. It is situated on the Columbia River, approximately 50 miles north of Spokane. The city was named after the nearby Kettle Falls, a series of rapids on the Columbia River. The population of Kettle Falls was 1,595 at the 2010 census.
History
The area around Kettle Falls has been inhabited by Native Americans for thousands of years. The Kettle Falls area was first explored by Europeans in 1811, when David Thompson of the North West Company arrived in the area. The first permanent settlement in the area was established in 1811 by the Hudson's Bay Company. The settlement was known as Kettle Falls House, and was located near the rapids of the Columbia River.
The area around Kettle Falls was heavily impacted by the construction of the Grand Coulee Dam in the 1930s. The dam flooded much of the surrounding area, including the original Kettle Falls House. The city of Kettle Falls was established in 1941, and the population grew rapidly as people moved to the area to take advantage of the new jobs created by the dam.
Geography
Kettle Falls is located in Stevens County, Washington, at an elevation of 1,068 feet (326 m). The city is situated on the Columbia River, approximately 50 miles north of Spokane. The city is surrounded by the Colville National Forest, and is located near the Kettle Falls National Wildlife Refuge.
The climate in Kettle Falls is semi-arid, with hot summers and cold winters. The average annual precipitation is 16.5 inches (419 mm).
Economy
Kettle Falls is a small city with a population of 1,595 as of the 2010 census. The city's economy is largely based on tourism and agriculture. The city is home to several tourist attractions, including the Kettle Falls National Wildlife Refuge, the Kettle Falls Historic District, and the Kettle Falls Marina.
Agriculture is also an important part of the local economy. The area around Kettle Falls is known for its production of apples, cherries, and other fruits and vegetables. The city is also home to several wineries and breweries.
Demographics
As of the 2010 census, the population of Kettle Falls was 1,595. The racial makeup of the city was 94.3% White, 0.7% African American, 0.7% Native American, 0.3% Asian, 0.1% Pacific Islander, 1.2% from other races, and 2.1% from two or more races. Hispanic or Latino of any race were 3.3% of the population.
The median income for a household in Kettle Falls was $35,938, and the median income for a family was $41,250. The per capita income for the city was $17,845. About 14.3% of families and 17.2% of the population were below the poverty line, including 22.2% of those under age 18 and 8.3% of those age 65 or over.
Common Questions
What is Per Capita Income in Kettle Falls?
Per Capita income in Kettle Falls is $29,720.
What is the Median Family Income in Kettle Falls?
Median Family Income in Kettle Falls is $79,934.
What is the Median Household income in Kettle Falls?
Median Household Income in Kettle Falls is $48,690.
What is Income or Wage Gap in Kettle Falls?
Income or Wage Gap in Kettle Falls is 38.1%.
Women in Kettle Falls earn 61.9 cents for every dollar earned by a man.
What is Inequality or Gini Index in Kettle Falls?
Inequality or Gini Index in Kettle Falls is 0.41.
What is the Total Population of Kettle Falls?
Total Population of Kettle Falls is 1,598.
What is the Total Male Population of Kettle Falls?
Total Male Population of Kettle Falls is 835.
What is the Total Female Population of Kettle Falls?
Total Female Population of Kettle Falls is 763.
What is the Ratio of Males per 100 Females in Kettle Falls?
There are 109.44 Males per 100 Females in Kettle Falls.
What is the Ratio of Females per 100 Males in Kettle Falls?
There are 91.38 Females per 100 Males in Kettle Falls.
What is the Median Population Age in Kettle Falls?
Median Population Age in Kettle Falls is 44.2 Years.
What is the Average Family Size in Kettle Falls
Average Family Size in Kettle Falls is 3.0 People.
What is the Average Household Size in Kettle Falls
Average Household Size in Kettle Falls is 2.2 People.
How Large is the Labor Force in Kettle Falls?
There are 679 People in the Labor Forcein in Kettle Falls.
What is the Percentage of People in the Labor Force in Kettle Falls?
53.0% of People are in the Labor Force in Kettle Falls.
What is the Unemployment Rate in Kettle Falls?
Unemployment Rate in Kettle Falls is 6.2%.