Cities with the Lowest Unemployment Rate Amomg Youth Under the Age of 25 in Wisconsin
RELATED REPORTS & OPTIONS
Lowest Unemployment | Youth < 25
Wisconsin
Compare Cities
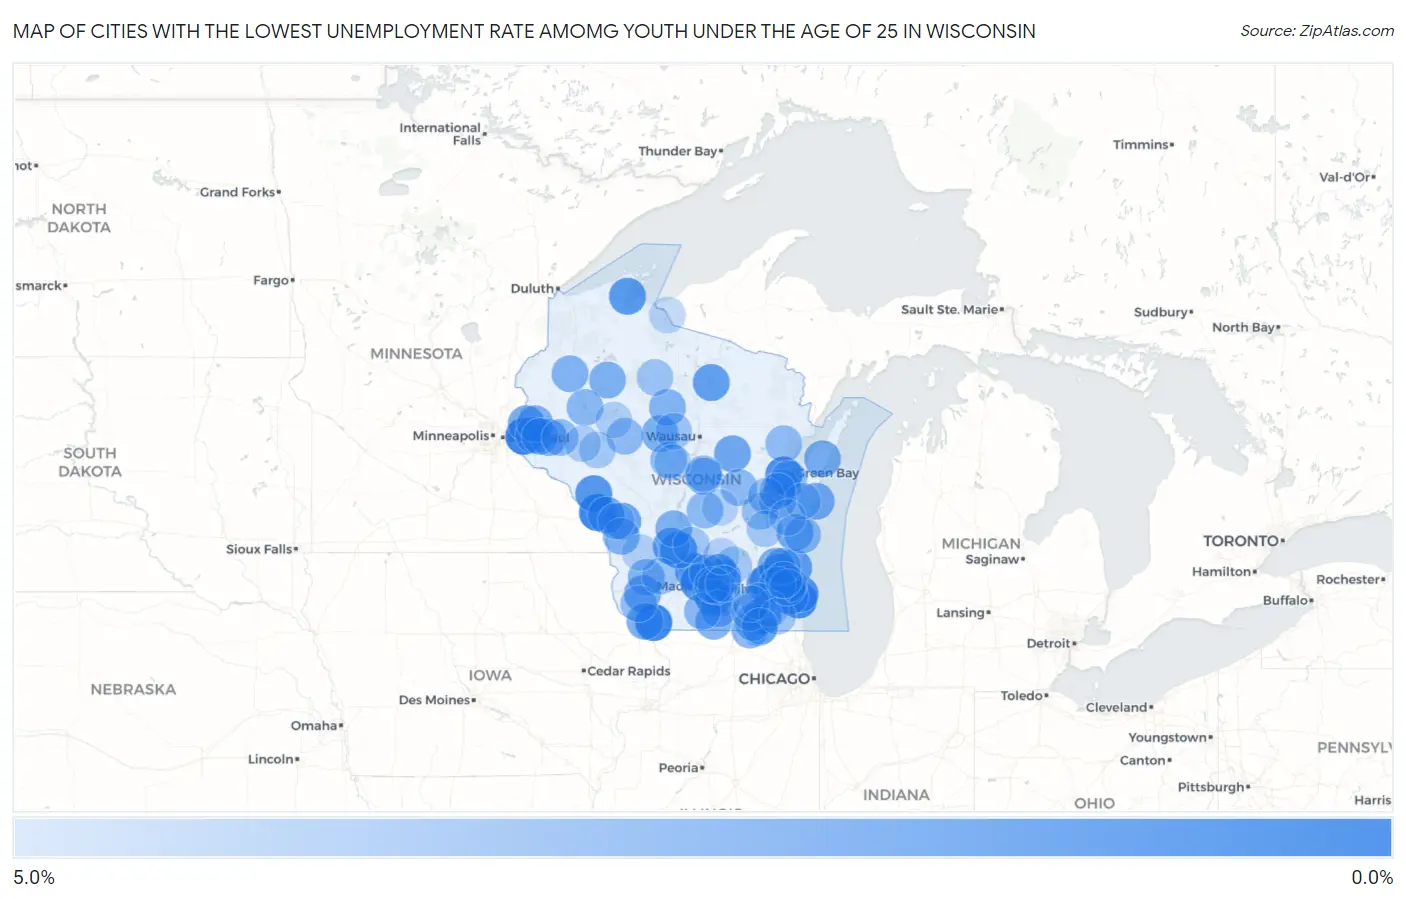
Map of Cities with the Lowest Unemployment Rate Amomg Youth Under the Age of 25 in Wisconsin
5.0%
0.0%
Cities with the Lowest Unemployment Rate Amomg Youth Under the Age of 25 in Wisconsin
| City | Youth Unemployment | vs State | vs National | |
| 1. | Hudson | 0.30% | 6.8%(-6.50)#1 | 10.9%(-10.6)#13 |
| 2. | Cuba City | 0.40% | 6.8%(-6.40)#2 | 10.9%(-10.5)#35 |
| 3. | Trempealeau | 0.40% | 6.8%(-6.40)#3 | 10.9%(-10.5)#37 |
| 4. | Oak Creek | 0.70% | 6.8%(-6.10)#4 | 10.9%(-10.2)#63 |
| 5. | Hobart | 0.80% | 6.8%(-6.00)#5 | 10.9%(-10.1)#85 |
| 6. | Sauk City | 0.90% | 6.8%(-5.90)#6 | 10.9%(-10.00)#105 |
| 7. | Cross Plains | 1.1% | 6.8%(-5.70)#7 | 10.9%(-9.80)#158 |
| 8. | Reedsburg | 1.2% | 6.8%(-5.60)#8 | 10.9%(-9.70)#171 |
| 9. | St Francis | 1.2% | 6.8%(-5.60)#9 | 10.9%(-9.70)#172 |
| 10. | Arcadia | 1.2% | 6.8%(-5.60)#10 | 10.9%(-9.70)#178 |
| 11. | Oconomowoc | 1.4% | 6.8%(-5.40)#11 | 10.9%(-9.50)#213 |
| 12. | Washburn | 1.4% | 6.8%(-5.40)#12 | 10.9%(-9.50)#231 |
| 13. | Sun Prairie | 1.5% | 6.8%(-5.30)#13 | 10.9%(-9.40)#236 |
| 14. | Elkhorn | 1.5% | 6.8%(-5.30)#14 | 10.9%(-9.40)#244 |
| 15. | Windsor | 1.5% | 6.8%(-5.30)#15 | 10.9%(-9.40)#247 |
| 16. | Rhinelander | 1.6% | 6.8%(-5.20)#16 | 10.9%(-9.30)#283 |
| 17. | La Valle | 1.6% | 6.8%(-5.20)#17 | 10.9%(-9.30)#302 |
| 18. | Fitchburg | 1.7% | 6.8%(-5.10)#18 | 10.9%(-9.20)#303 |
| 19. | Cedarburg | 1.7% | 6.8%(-5.10)#19 | 10.9%(-9.20)#313 |
| 20. | Richfield | 1.8% | 6.8%(-5.00)#20 | 10.9%(-9.10)#361 |
| 21. | Bangor | 1.9% | 6.8%(-4.90)#21 | 10.9%(-9.00)#425 |
| 22. | Tigerton | 2.0% | 6.8%(-4.80)#22 | 10.9%(-8.90)#477 |
| 23. | Holmen | 2.1% | 6.8%(-4.70)#23 | 10.9%(-8.80)#491 |
| 24. | Plymouth | 2.1% | 6.8%(-4.70)#24 | 10.9%(-8.80)#495 |
| 25. | Hales Corners | 2.1% | 6.8%(-4.70)#25 | 10.9%(-8.80)#498 |
| 26. | Somerset | 2.1% | 6.8%(-4.70)#26 | 10.9%(-8.80)#510 |
| 27. | Fennimore | 2.1% | 6.8%(-4.70)#27 | 10.9%(-8.80)#514 |
| 28. | Two Rivers | 2.2% | 6.8%(-4.60)#28 | 10.9%(-8.70)#535 |
| 29. | Okauchee Lake | 2.2% | 6.8%(-4.60)#29 | 10.9%(-8.70)#553 |
| 30. | Dickeyville | 2.2% | 6.8%(-4.60)#30 | 10.9%(-8.70)#569 |
| 31. | Slinger | 2.3% | 6.8%(-4.50)#31 | 10.9%(-8.60)#605 |
| 32. | Roberts | 2.3% | 6.8%(-4.50)#32 | 10.9%(-8.60)#616 |
| 33. | Butler | 2.3% | 6.8%(-4.50)#33 | 10.9%(-8.60)#617 |
| 34. | Woodville | 2.3% | 6.8%(-4.50)#34 | 10.9%(-8.60)#619 |
| 35. | Forestville | 2.3% | 6.8%(-4.50)#35 | 10.9%(-8.60)#631 |
| 36. | Plover | 2.4% | 6.8%(-4.40)#36 | 10.9%(-8.50)#641 |
| 37. | Sherwood | 2.4% | 6.8%(-4.40)#37 | 10.9%(-8.50)#664 |
| 38. | Wrightstown | 2.5% | 6.8%(-4.30)#38 | 10.9%(-8.40)#727 |
| 39. | Walworth | 2.5% | 6.8%(-4.30)#39 | 10.9%(-8.40)#730 |
| 40. | Dorchester | 2.5% | 6.8%(-4.30)#40 | 10.9%(-8.40)#748 |
| 41. | Stoughton | 2.6% | 6.8%(-4.20)#41 | 10.9%(-8.30)#768 |
| 42. | Oregon | 2.6% | 6.8%(-4.20)#42 | 10.9%(-8.30)#769 |
| 43. | New Richmond | 2.6% | 6.8%(-4.20)#43 | 10.9%(-8.30)#770 |
| 44. | Mauston | 2.6% | 6.8%(-4.20)#44 | 10.9%(-8.30)#786 |
| 45. | Brodhead | 2.6% | 6.8%(-4.20)#45 | 10.9%(-8.30)#793 |
| 46. | Coon Valley | 2.6% | 6.8%(-4.20)#46 | 10.9%(-8.30)#815 |
| 47. | Exeland | 2.6% | 6.8%(-4.20)#47 | 10.9%(-8.30)#822 |
| 48. | Evansville | 2.7% | 6.8%(-4.10)#48 | 10.9%(-8.20)#842 |
| 49. | Shell Lake | 2.7% | 6.8%(-4.10)#49 | 10.9%(-8.20)#866 |
| 50. | Sharon | 2.7% | 6.8%(-4.10)#50 | 10.9%(-8.20)#868 |
| 51. | Rib Lake | 2.7% | 6.8%(-4.10)#51 | 10.9%(-8.20)#880 |
| 52. | Blue River | 2.7% | 6.8%(-4.10)#52 | 10.9%(-8.20)#890 |
| 53. | Monticello | 2.8% | 6.8%(-4.00)#53 | 10.9%(-8.10)#943 |
| 54. | Marshfield | 2.9% | 6.8%(-3.90)#54 | 10.9%(-8.00)#956 |
| 55. | Sheboygan Falls | 2.9% | 6.8%(-3.90)#55 | 10.9%(-8.00)#967 |
| 56. | Jackson | 2.9% | 6.8%(-3.90)#56 | 10.9%(-8.00)#969 |
| 57. | Chetek | 2.9% | 6.8%(-3.90)#57 | 10.9%(-8.00)#987 |
| 58. | Weyauwega | 3.0% | 6.8%(-3.80)#58 | 10.9%(-7.90)#1,048 |
| 59. | Darien | 3.0% | 6.8%(-3.80)#59 | 10.9%(-7.90)#1,053 |
| 60. | Coloma | 3.0% | 6.8%(-3.80)#60 | 10.9%(-7.90)#1,066 |
| 61. | Stanley | 3.1% | 6.8%(-3.70)#61 | 10.9%(-7.80)#1,105 |
| 62. | Oconto Falls | 3.1% | 6.8%(-3.70)#62 | 10.9%(-7.80)#1,111 |
| 63. | Hammond | 3.1% | 6.8%(-3.70)#63 | 10.9%(-7.80)#1,120 |
| 64. | Knapp | 3.1% | 6.8%(-3.70)#64 | 10.9%(-7.80)#1,140 |
| 65. | De Pere | 3.2% | 6.8%(-3.60)#65 | 10.9%(-7.70)#1,155 |
| 66. | Lancaster | 3.2% | 6.8%(-3.60)#66 | 10.9%(-7.70)#1,183 |
| 67. | Whitelaw | 3.2% | 6.8%(-3.60)#67 | 10.9%(-7.70)#1,211 |
| 68. | Oshkosh | 3.3% | 6.8%(-3.50)#68 | 10.9%(-7.60)#1,224 |
| 69. | Whiting | 3.3% | 6.8%(-3.50)#69 | 10.9%(-7.60)#1,265 |
| 70. | Lake Lorraine | 3.3% | 6.8%(-3.50)#70 | 10.9%(-7.60)#1,283 |
| 71. | Fox Crossing | 3.4% | 6.8%(-3.40)#71 | 10.9%(-7.50)#1,288 |
| 72. | Pewaukee | 3.4% | 6.8%(-3.40)#72 | 10.9%(-7.50)#1,302 |
| 73. | East Troy | 3.5% | 6.8%(-3.30)#73 | 10.9%(-7.40)#1,376 |
| 74. | Phillips | 3.5% | 6.8%(-3.30)#74 | 10.9%(-7.40)#1,391 |
| 75. | Athens | 3.5% | 6.8%(-3.30)#75 | 10.9%(-7.40)#1,399 |
| 76. | Avoca | 3.5% | 6.8%(-3.30)#76 | 10.9%(-7.40)#1,407 |
| 77. | Palmyra | 3.6% | 6.8%(-3.20)#77 | 10.9%(-7.30)#1,455 |
| 78. | Burlington | 3.7% | 6.8%(-3.10)#78 | 10.9%(-7.20)#1,483 |
| 79. | Lake Delton | 3.7% | 6.8%(-3.10)#79 | 10.9%(-7.20)#1,505 |
| 80. | Altoona | 3.8% | 6.8%(-3.00)#80 | 10.9%(-7.10)#1,563 |
| 81. | Columbus | 3.8% | 6.8%(-3.00)#81 | 10.9%(-7.10)#1,571 |
| 82. | North Fond Du Lac | 3.8% | 6.8%(-3.00)#82 | 10.9%(-7.10)#1,573 |
| 83. | Kaukauna | 3.9% | 6.8%(-2.90)#83 | 10.9%(-7.00)#1,621 |
| 84. | Dane | 3.9% | 6.8%(-2.90)#84 | 10.9%(-7.00)#1,658 |
| 85. | Whitewater | 4.0% | 6.8%(-2.80)#85 | 10.9%(-6.90)#1,680 |
| 86. | Monona | 4.0% | 6.8%(-2.80)#86 | 10.9%(-6.90)#1,691 |
| 87. | Cornell | 4.0% | 6.8%(-2.80)#87 | 10.9%(-6.90)#1,726 |
| 88. | Elk Mound | 4.0% | 6.8%(-2.80)#88 | 10.9%(-6.90)#1,731 |
| 89. | Hewitt | 4.0% | 6.8%(-2.80)#89 | 10.9%(-6.90)#1,734 |
| 90. | Madison | 4.1% | 6.8%(-2.70)#90 | 10.9%(-6.80)#1,750 |
| 91. | Elm Grove | 4.1% | 6.8%(-2.70)#91 | 10.9%(-6.80)#1,776 |
| 92. | Viola | 4.1% | 6.8%(-2.70)#92 | 10.9%(-6.80)#1,804 |
| 93. | West Salem | 4.2% | 6.8%(-2.60)#93 | 10.9%(-6.70)#1,845 |
| 94. | New Holstein | 4.2% | 6.8%(-2.60)#94 | 10.9%(-6.70)#1,854 |
| 95. | Wautoma | 4.2% | 6.8%(-2.60)#95 | 10.9%(-6.70)#1,860 |
| 96. | Fontana On Geneva Lake | 4.2% | 6.8%(-2.60)#96 | 10.9%(-6.70)#1,869 |
| 97. | Rio | 4.2% | 6.8%(-2.60)#97 | 10.9%(-6.70)#1,874 |
| 98. | Cottage Grove | 4.3% | 6.8%(-2.50)#98 | 10.9%(-6.60)#1,904 |
| 99. | Hurley | 4.3% | 6.8%(-2.50)#99 | 10.9%(-6.60)#1,932 |
| 100. | Lannon | 4.3% | 6.8%(-2.50)#100 | 10.9%(-6.60)#1,933 |
Common Questions
What are the Top 10 Cities with the Lowest Unemployment Rate Amomg Youth Under the Age of 25 in Wisconsin?
Top 10 Cities with the Lowest Unemployment Rate Amomg Youth Under the Age of 25 in Wisconsin are:
#1
0.30%
#2
0.40%
#3
0.40%
#4
0.70%
#5
0.80%
#6
0.90%
#7
1.1%
#8
1.2%
#9
1.2%
#10
1.2%
What city has the Lowest Unemployment Rate Amomg Youth Under the Age of 25 in Wisconsin?
Hudson has the Lowest Unemployment Rate Amomg Youth Under the Age of 25 in Wisconsin with 0.30%.
What is the Unemployment Rate Amomg Youth Under the Age of 25 in the State of Wisconsin?
Unemployment Rate Amomg Youth Under the Age of 25 in Wisconsin is 6.8%.
What is the Unemployment Rate Amomg Youth Under the Age of 25 in the United States?
Unemployment Rate Amomg Youth Under the Age of 25 in the United States is 10.9%.