Cities with the Lowest Unemployment Rate Amomg Youth Under the Age of 25 in Hawaii
RELATED REPORTS & OPTIONS
Lowest Unemployment | Youth < 25
Hawaii
Compare Cities
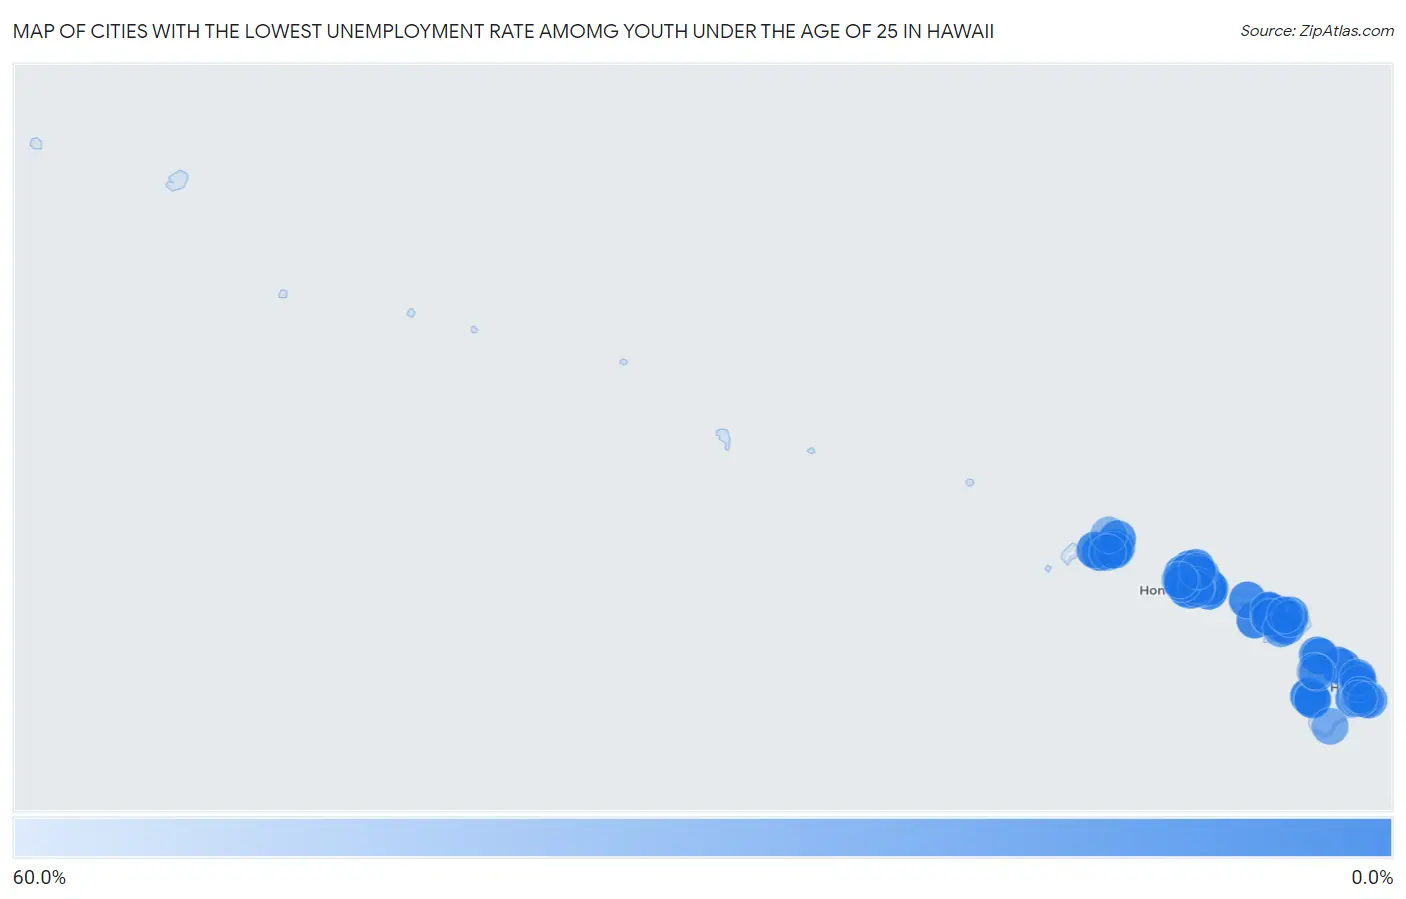
Map of Cities with the Lowest Unemployment Rate Amomg Youth Under the Age of 25 in Hawaii
60.0%
0.0%
Cities with the Lowest Unemployment Rate Amomg Youth Under the Age of 25 in Hawaii
| City | Youth Unemployment | vs State | vs National | |
| 1. | Waihee Waiehu | 0.80% | 10.8%(-10.00)#1 | 10.9%(-10.1)#84 |
| 2. | Ahuimanu | 1.9% | 10.8%(-8.90)#2 | 10.9%(-9.00)#406 |
| 3. | Waikapu | 2.0% | 10.8%(-8.80)#3 | 10.9%(-8.90)#459 |
| 4. | Maunawili | 2.7% | 10.8%(-8.10)#4 | 10.9%(-8.20)#861 |
| 5. | Kaiminani | 2.9% | 10.8%(-7.90)#5 | 10.9%(-8.00)#959 |
| 6. | West Loch Estate | 3.1% | 10.8%(-7.70)#6 | 10.9%(-7.80)#1,092 |
| 7. | Kahaluu Keauhou | 3.3% | 10.8%(-7.50)#7 | 10.9%(-7.60)#1,247 |
| 8. | Waipio Acres | 3.5% | 10.8%(-7.30)#8 | 10.9%(-7.40)#1,367 |
| 9. | Pupukea | 3.5% | 10.8%(-7.30)#9 | 10.9%(-7.40)#1,370 |
| 10. | Waimanalo Beach | 3.5% | 10.8%(-7.30)#10 | 10.9%(-7.40)#1,377 |
| 11. | Lanai City | 4.7% | 10.8%(-6.10)#11 | 10.9%(-6.20)#2,222 |
| 12. | Kahaluu | 4.8% | 10.8%(-6.00)#12 | 10.9%(-6.10)#2,286 |
| 13. | Mililani Mauka | 5.2% | 10.8%(-5.60)#13 | 10.9%(-5.70)#2,538 |
| 14. | Lihue | 5.2% | 10.8%(-5.60)#14 | 10.9%(-5.70)#2,552 |
| 15. | Waiahole-Waikane | 5.5% | 10.8%(-5.30)#15 | 10.9%(-5.40)#2,832 |
| 16. | Whitmore Village | 5.6% | 10.8%(-5.20)#16 | 10.9%(-5.30)#2,886 |
| 17. | Kailua Cdp Hawaii County | 5.8% | 10.8%(-5.00)#17 | 10.9%(-5.10)#3,012 |
| 18. | Wailuku | 5.8% | 10.8%(-5.00)#18 | 10.9%(-5.10)#3,016 |
| 19. | Mahinahina | 5.8% | 10.8%(-5.00)#19 | 10.9%(-5.10)#3,063 |
| 20. | Mililani Town | 6.2% | 10.8%(-4.60)#20 | 10.9%(-4.70)#3,337 |
| 21. | Pearl City | 6.3% | 10.8%(-4.50)#21 | 10.9%(-4.60)#3,425 |
| 22. | Kihei | 6.8% | 10.8%(-4.00)#22 | 10.9%(-4.10)#3,813 |
| 23. | Ainaloa | 6.9% | 10.8%(-3.90)#23 | 10.9%(-4.00)#3,931 |
| 24. | Ewa Gentry | 7.0% | 10.8%(-3.80)#24 | 10.9%(-3.90)#3,963 |
| 25. | Paauilo | 7.1% | 10.8%(-3.70)#25 | 10.9%(-3.80)#4,082 |
| 26. | Kualapuu | 7.7% | 10.8%(-3.10)#26 | 10.9%(-3.20)#4,574 |
| 27. | Kaneohe | 7.8% | 10.8%(-3.00)#27 | 10.9%(-3.10)#4,590 |
| 28. | Kailua Cdp Honolulu County | 8.4% | 10.8%(-2.40)#28 | 10.9%(-2.50)#5,042 |
| 29. | Kaumakani | 8.5% | 10.8%(-2.30)#29 | 10.9%(-2.40)#5,177 |
| 30. | Kahului | 8.8% | 10.8%(-2.00)#30 | 10.9%(-2.10)#5,388 |
| 31. | East Honolulu | 9.1% | 10.8%(-1.70)#31 | 10.9%(-1.80)#5,659 |
| 32. | Ewa Beach | 9.1% | 10.8%(-1.70)#32 | 10.9%(-1.80)#5,672 |
| 33. | Hanamaulu | 9.1% | 10.8%(-1.70)#33 | 10.9%(-1.80)#5,691 |
| 34. | Kalaeloa | 9.1% | 10.8%(-1.70)#34 | 10.9%(-1.80)#5,697 |
| 35. | Waipio | 9.5% | 10.8%(-1.30)#35 | 10.9%(-1.40)#5,981 |
| 36. | Kekaha | 10.1% | 10.8%(-0.700)#36 | 10.9%(-0.800)#6,475 |
| 37. | Mokuleia | 10.4% | 10.8%(-0.400)#37 | 10.9%(-0.500)#6,723 |
| 38. | Pepeekeo | 10.4% | 10.8%(-0.400)#38 | 10.9%(-0.500)#6,728 |
| 39. | Urban Honolulu | 10.7% | 10.8%(-0.100)#39 | 10.9%(-0.200)#6,897 |
| 40. | Mountain View | 11.0% | 10.8%(+0.200)#40 | 10.9%(+0.100)#7,116 |
| 41. | Kaneohe Base | 11.1% | 10.8%(+0.300)#41 | 10.9%(+0.200)#7,149 |
| 42. | Waipahu | 11.2% | 10.8%(+0.400)#42 | 10.9%(+0.300)#7,259 |
| 43. | Wahiawa | 11.2% | 10.8%(+0.400)#43 | 10.9%(+0.300)#7,265 |
| 44. | Lahaina | 11.6% | 10.8%(+0.800)#44 | 10.9%(+0.700)#7,525 |
| 45. | Kapaau | 11.6% | 10.8%(+0.800)#45 | 10.9%(+0.700)#7,550 |
| 46. | Schofield Barracks | 11.8% | 10.8%(+1.000)#46 | 10.9%(+0.900)#7,652 |
| 47. | Anahola | 12.3% | 10.8%(+1.50)#47 | 10.9%(+1.40)#7,956 |
| 48. | Wheeler Afb | 12.4% | 10.8%(+1.60)#48 | 10.9%(+1.50)#8,007 |
| 49. | Royal Kunia | 12.5% | 10.8%(+1.70)#49 | 10.9%(+1.60)#8,054 |
| 50. | Haiku Pauwela | 12.6% | 10.8%(+1.80)#50 | 10.9%(+1.70)#8,143 |
| 51. | Nanakuli | 12.7% | 10.8%(+1.90)#51 | 10.9%(+1.80)#8,195 |
| 52. | Hawaiian Acres | 13.3% | 10.8%(+2.50)#52 | 10.9%(+2.40)#8,537 |
| 53. | Ocean Pointe | 13.8% | 10.8%(+3.00)#53 | 10.9%(+2.90)#8,852 |
| 54. | Honokaa | 14.6% | 10.8%(+3.80)#54 | 10.9%(+3.70)#9,318 |
| 55. | Keokea | 14.7% | 10.8%(+3.90)#55 | 10.9%(+3.80)#9,355 |
| 56. | Wainaku | 14.9% | 10.8%(+4.10)#56 | 10.9%(+4.00)#9,479 |
| 57. | Kapolei | 15.0% | 10.8%(+4.20)#57 | 10.9%(+4.10)#9,496 |
| 58. | Makakilo | 15.0% | 10.8%(+4.20)#58 | 10.9%(+4.10)#9,498 |
| 59. | Nanawale Estates | 15.1% | 10.8%(+4.30)#59 | 10.9%(+4.20)#9,574 |
| 60. | Waialua | 16.1% | 10.8%(+5.30)#60 | 10.9%(+5.20)#10,018 |
| 61. | Kealakekua | 16.4% | 10.8%(+5.60)#61 | 10.9%(+5.50)#10,130 |
| 62. | Laie | 16.5% | 10.8%(+5.70)#62 | 10.9%(+5.60)#10,161 |
| 63. | Makaha Valley | 16.6% | 10.8%(+5.80)#63 | 10.9%(+5.70)#10,267 |
| 64. | Captain Cook | 16.7% | 10.8%(+5.90)#64 | 10.9%(+5.80)#10,298 |
| 65. | Puhi | 17.1% | 10.8%(+6.30)#65 | 10.9%(+6.20)#10,422 |
| 66. | Kahuku | 17.2% | 10.8%(+6.40)#66 | 10.9%(+6.30)#10,463 |
| 67. | Halawa | 17.5% | 10.8%(+6.70)#67 | 10.9%(+6.60)#10,569 |
| 68. | Hilo | 17.8% | 10.8%(+7.00)#68 | 10.9%(+6.90)#10,719 |
| 69. | Aiea | 18.9% | 10.8%(+8.10)#69 | 10.9%(+8.00)#11,109 |
| 70. | Kaloko | 18.9% | 10.8%(+8.10)#70 | 10.9%(+8.00)#11,123 |
| 71. | Halaula | 19.0% | 10.8%(+8.20)#71 | 10.9%(+8.10)#11,150 |
| 72. | Napili Honokowai | 19.1% | 10.8%(+8.30)#72 | 10.9%(+8.20)#11,176 |
| 73. | Haleiwa | 19.4% | 10.8%(+8.60)#73 | 10.9%(+8.50)#11,286 |
| 74. | Waianae | 19.9% | 10.8%(+9.10)#74 | 10.9%(+9.00)#11,395 |
| 75. | Orchidlands Estates | 19.9% | 10.8%(+9.10)#75 | 10.9%(+9.00)#11,415 |
| 76. | Kaaawa | 19.9% | 10.8%(+9.10)#76 | 10.9%(+9.00)#11,421 |
| 77. | Launiupoko | 19.9% | 10.8%(+9.10)#77 | 10.9%(+9.00)#11,429 |
| 78. | Waikoloa Village | 20.9% | 10.8%(+10.1)#78 | 10.9%(+10.00)#11,711 |
| 79. | Waimanalo | 21.0% | 10.8%(+10.2)#79 | 10.9%(+10.1)#11,734 |
| 80. | Punaluu | 22.5% | 10.8%(+11.7)#80 | 10.9%(+11.6)#12,149 |
| 81. | Ko Olina | 22.6% | 10.8%(+11.8)#81 | 10.9%(+11.7)#12,164 |
| 82. | Waimalu | 22.8% | 10.8%(+12.0)#82 | 10.9%(+11.9)#12,195 |
| 83. | Helemano | 24.8% | 10.8%(+14.0)#83 | 10.9%(+13.9)#12,635 |
| 84. | Paukaa | 25.0% | 10.8%(+14.2)#84 | 10.9%(+14.1)#12,709 |
| 85. | Wailea | 25.3% | 10.8%(+14.5)#85 | 10.9%(+14.4)#12,767 |
| 86. | Hickam Housing | 25.8% | 10.8%(+15.0)#86 | 10.9%(+14.9)#12,843 |
| 87. | Honomu | 27.2% | 10.8%(+16.4)#87 | 10.9%(+16.3)#13,116 |
| 88. | Naalehu | 28.8% | 10.8%(+18.0)#88 | 10.9%(+17.9)#13,358 |
| 89. | Olinda | 30.0% | 10.8%(+19.2)#89 | 10.9%(+19.1)#13,510 |
| 90. | Waimea Cdp Hawaii County | 30.4% | 10.8%(+19.6)#90 | 10.9%(+19.5)#13,550 |
| 91. | Maili | 31.0% | 10.8%(+20.2)#91 | 10.9%(+20.1)#13,616 |
| 92. | Hauula | 32.4% | 10.8%(+21.6)#92 | 10.9%(+21.5)#13,780 |
| 93. | Makaha | 35.1% | 10.8%(+24.3)#93 | 10.9%(+24.2)#14,085 |
| 94. | Princeville | 38.3% | 10.8%(+27.5)#94 | 10.9%(+27.4)#14,362 |
| 95. | Paia | 38.5% | 10.8%(+27.7)#95 | 10.9%(+27.6)#14,380 |
| 96. | Puako | 39.9% | 10.8%(+29.1)#96 | 10.9%(+29.0)#14,466 |
| 97. | Lawai | 40.2% | 10.8%(+29.4)#97 | 10.9%(+29.3)#14,510 |
| 98. | Kurtistown | 51.1% | 10.8%(+40.3)#98 | 10.9%(+40.2)#15,133 |
| 99. | Pahoa | 55.5% | 10.8%(+44.7)#99 | 10.9%(+44.6)#15,281 |
| 100. | Fern Acres | 55.6% | 10.8%(+44.8)#100 | 10.9%(+44.7)#15,298 |
1
2Common Questions
What are the Top 10 Cities with the Lowest Unemployment Rate Amomg Youth Under the Age of 25 in Hawaii?
Top 10 Cities with the Lowest Unemployment Rate Amomg Youth Under the Age of 25 in Hawaii are:
#1
0.80%
#2
1.9%
#3
2.0%
#4
2.7%
#5
3.1%
#6
3.3%
#7
3.5%
#8
3.5%
#9
3.5%
#10
4.7%
What city has the Lowest Unemployment Rate Amomg Youth Under the Age of 25 in Hawaii?
Waihee Waiehu has the Lowest Unemployment Rate Amomg Youth Under the Age of 25 in Hawaii with 0.80%.
What is the Unemployment Rate Amomg Youth Under the Age of 25 in the State of Hawaii?
Unemployment Rate Amomg Youth Under the Age of 25 in Hawaii is 10.8%.
What is the Unemployment Rate Amomg Youth Under the Age of 25 in the United States?
Unemployment Rate Amomg Youth Under the Age of 25 in the United States is 10.9%.