Cities with the Lowest Unemployment Rate Amomg Youth Under the Age of 25 in Indiana
RELATED REPORTS & OPTIONS
Lowest Unemployment | Youth < 25
Indiana
Compare Cities
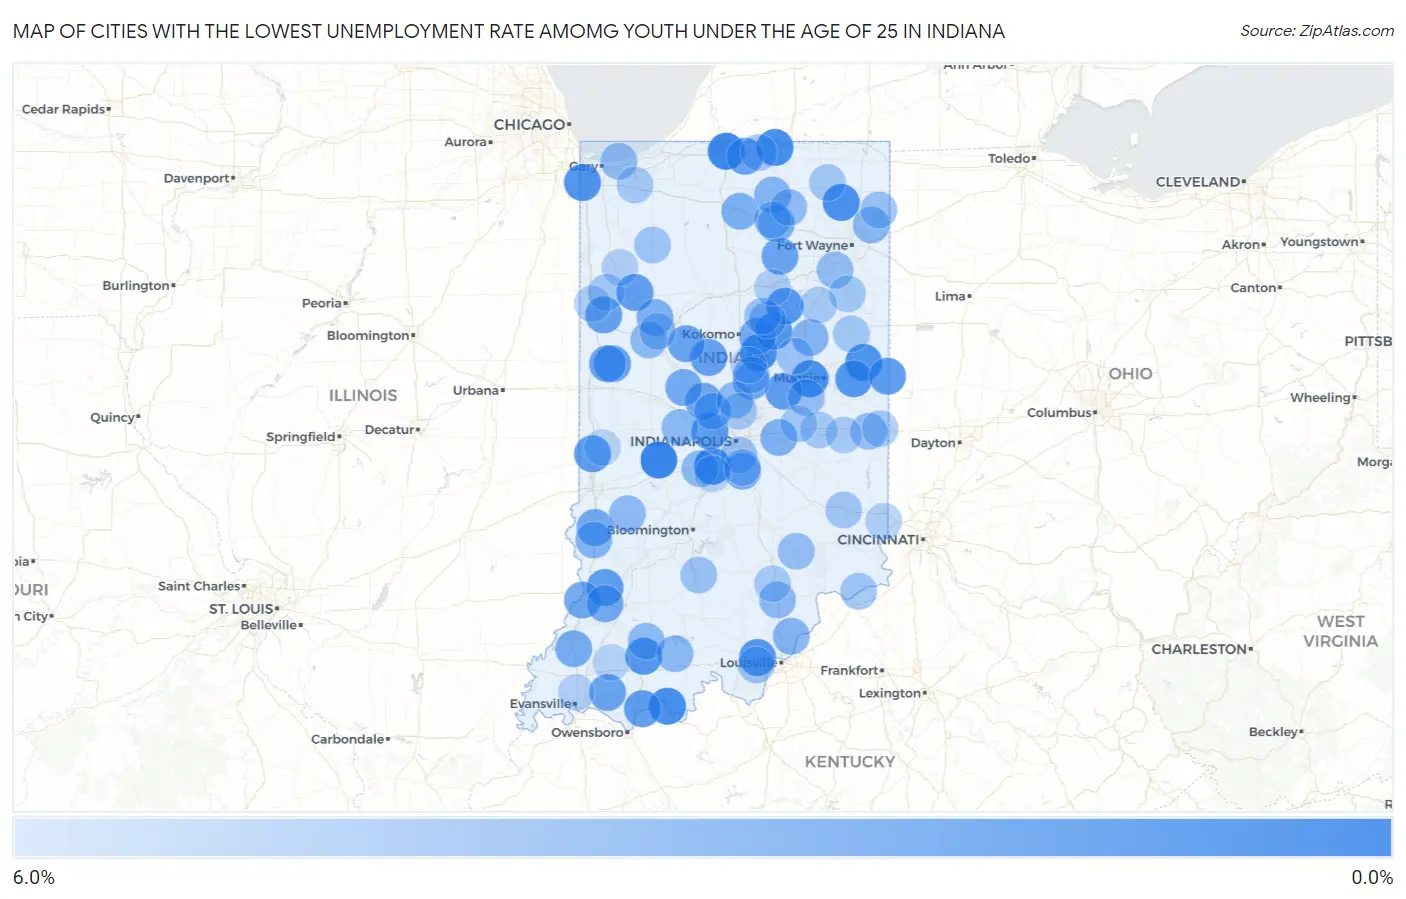
Map of Cities with the Lowest Unemployment Rate Amomg Youth Under the Age of 25 in Indiana
6.0%
0.0%
Cities with the Lowest Unemployment Rate Amomg Youth Under the Age of 25 in Indiana
| City | Youth Unemployment | vs State | vs National | |
| 1. | Greencastle | 0.50% | 9.1%(-8.60)#1 | 10.9%(-10.4)#42 |
| 2. | Notre Dame | 0.60% | 9.1%(-8.50)#2 | 10.9%(-10.3)#54 |
| 3. | Mooresville | 0.90% | 9.1%(-8.20)#3 | 10.9%(-10.00)#100 |
| 4. | Bristol | 1.0% | 9.1%(-8.10)#4 | 10.9%(-9.90)#136 |
| 5. | Windfall City | 1.0% | 9.1%(-8.10)#5 | 10.9%(-9.90)#140 |
| 6. | Tell City | 1.1% | 9.1%(-8.00)#6 | 10.9%(-9.80)#153 |
| 7. | Yorktown | 1.2% | 9.1%(-7.90)#7 | 10.9%(-9.70)#170 |
| 8. | Avilla | 1.2% | 9.1%(-7.90)#8 | 10.9%(-9.70)#180 |
| 9. | Ridgeville | 1.4% | 9.1%(-7.70)#9 | 10.9%(-9.50)#235 |
| 10. | Dyer | 1.5% | 9.1%(-7.60)#10 | 10.9%(-9.40)#238 |
| 11. | Swayzee | 1.6% | 9.1%(-7.50)#11 | 10.9%(-9.30)#295 |
| 12. | Farmland | 1.7% | 9.1%(-7.40)#12 | 10.9%(-9.20)#344 |
| 13. | Huntingburg | 1.8% | 9.1%(-7.30)#13 | 10.9%(-9.10)#370 |
| 14. | Georgetown | 1.8% | 9.1%(-7.30)#14 | 10.9%(-9.10)#376 |
| 15. | La Fontaine | 1.8% | 9.1%(-7.30)#15 | 10.9%(-9.10)#396 |
| 16. | Union City | 2.0% | 9.1%(-7.10)#16 | 10.9%(-8.90)#462 |
| 17. | Fairview Park | 2.0% | 9.1%(-7.10)#17 | 10.9%(-8.90)#473 |
| 18. | Brownsburg | 2.1% | 9.1%(-7.00)#18 | 10.9%(-8.80)#484 |
| 19. | Bicknell | 2.1% | 9.1%(-7.00)#19 | 10.9%(-8.80)#512 |
| 20. | Grandview | 2.1% | 9.1%(-7.00)#20 | 10.9%(-8.80)#527 |
| 21. | Edgewood | 2.2% | 9.1%(-6.90)#21 | 10.9%(-8.70)#564 |
| 22. | Wolcott | 2.2% | 9.1%(-6.90)#22 | 10.9%(-8.70)#568 |
| 23. | Osceola | 2.4% | 9.1%(-6.70)#23 | 10.9%(-8.50)#672 |
| 24. | Putnamville | 2.4% | 9.1%(-6.70)#24 | 10.9%(-8.50)#674 |
| 25. | Michigantown | 2.4% | 9.1%(-6.70)#25 | 10.9%(-8.50)#694 |
| 26. | Attica | 2.5% | 9.1%(-6.60)#26 | 10.9%(-8.40)#728 |
| 27. | Fowler | 2.5% | 9.1%(-6.60)#27 | 10.9%(-8.40)#735 |
| 28. | Boonville | 2.6% | 9.1%(-6.50)#28 | 10.9%(-8.30)#777 |
| 29. | North Manchester | 2.6% | 9.1%(-6.50)#29 | 10.9%(-8.30)#784 |
| 30. | Rossville | 2.6% | 9.1%(-6.50)#30 | 10.9%(-8.30)#809 |
| 31. | Lebanon | 2.7% | 9.1%(-6.40)#31 | 10.9%(-8.20)#827 |
| 32. | Williamsport | 2.7% | 9.1%(-6.40)#32 | 10.9%(-8.20)#863 |
| 33. | Vincennes | 2.8% | 9.1%(-6.30)#33 | 10.9%(-8.10)#899 |
| 34. | Arcadia | 2.9% | 9.1%(-6.20)#34 | 10.9%(-8.00)#995 |
| 35. | Shelburn | 2.9% | 9.1%(-6.20)#35 | 10.9%(-8.00)#997 |
| 36. | Wheatland | 2.9% | 9.1%(-6.20)#36 | 10.9%(-8.00)#1,009 |
| 37. | Thorntown | 3.1% | 9.1%(-6.00)#37 | 10.9%(-7.80)#1,132 |
| 38. | Princeton | 3.2% | 9.1%(-5.90)#38 | 10.9%(-7.70)#1,169 |
| 39. | Greentown | 3.2% | 9.1%(-5.90)#39 | 10.9%(-7.70)#1,197 |
| 40. | Whitestown | 3.4% | 9.1%(-5.70)#40 | 10.9%(-7.50)#1,297 |
| 41. | New Whiteland | 3.4% | 9.1%(-5.70)#41 | 10.9%(-7.50)#1,314 |
| 42. | Bourbon | 3.4% | 9.1%(-5.70)#42 | 10.9%(-7.50)#1,333 |
| 43. | Winona Lake | 3.5% | 9.1%(-5.60)#43 | 10.9%(-7.40)#1,371 |
| 44. | Brookston | 3.5% | 9.1%(-5.60)#44 | 10.9%(-7.40)#1,390 |
| 45. | Greenfield | 3.6% | 9.1%(-5.50)#45 | 10.9%(-7.30)#1,418 |
| 46. | Charlestown | 3.7% | 9.1%(-5.40)#46 | 10.9%(-7.20)#1,487 |
| 47. | Sullivan | 3.7% | 9.1%(-5.40)#47 | 10.9%(-7.20)#1,499 |
| 48. | Upland | 3.7% | 9.1%(-5.40)#48 | 10.9%(-7.20)#1,501 |
| 49. | Milford | 3.8% | 9.1%(-5.30)#49 | 10.9%(-7.10)#1,592 |
| 50. | Grabill | 4.0% | 9.1%(-5.10)#50 | 10.9%(-6.90)#1,727 |
| 51. | Westfield | 4.1% | 9.1%(-5.00)#51 | 10.9%(-6.80)#1,752 |
| 52. | Jasper | 4.1% | 9.1%(-5.00)#52 | 10.9%(-6.80)#1,760 |
| 53. | Warsaw | 4.1% | 9.1%(-5.00)#53 | 10.9%(-6.80)#1,761 |
| 54. | Monrovia | 4.1% | 9.1%(-5.00)#54 | 10.9%(-6.80)#1,796 |
| 55. | North Salem | 4.1% | 9.1%(-5.00)#55 | 10.9%(-6.80)#1,807 |
| 56. | Birdseye | 4.1% | 9.1%(-5.00)#56 | 10.9%(-6.80)#1,812 |
| 57. | West Lafayette | 4.2% | 9.1%(-4.90)#57 | 10.9%(-6.70)#1,818 |
| 58. | Scottsburg | 4.2% | 9.1%(-4.90)#58 | 10.9%(-6.70)#1,841 |
| 59. | Clay City | 4.2% | 9.1%(-4.90)#59 | 10.9%(-6.70)#1,873 |
| 60. | North Webster | 4.3% | 9.1%(-4.80)#60 | 10.9%(-6.60)#1,936 |
| 61. | Centerville | 4.4% | 9.1%(-4.70)#61 | 10.9%(-6.50)#1,993 |
| 62. | North Vernon | 4.5% | 9.1%(-4.60)#62 | 10.9%(-6.40)#2,051 |
| 63. | Middletown | 4.5% | 9.1%(-4.60)#63 | 10.9%(-6.40)#2,071 |
| 64. | Ogden Dunes | 4.5% | 9.1%(-4.60)#64 | 10.9%(-6.40)#2,079 |
| 65. | Converse | 4.5% | 9.1%(-4.60)#65 | 10.9%(-6.40)#2,084 |
| 66. | Atlanta | 4.5% | 9.1%(-4.60)#66 | 10.9%(-6.40)#2,087 |
| 67. | Zanesville | 4.5% | 9.1%(-4.60)#67 | 10.9%(-6.40)#2,094 |
| 68. | Battle Ground | 4.6% | 9.1%(-4.50)#68 | 10.9%(-6.30)#2,155 |
| 69. | St Joe | 4.6% | 9.1%(-4.50)#69 | 10.9%(-6.30)#2,171 |
| 70. | Amboy | 4.6% | 9.1%(-4.50)#70 | 10.9%(-6.30)#2,172 |
| 71. | Bedford | 4.7% | 9.1%(-4.40)#71 | 10.9%(-6.20)#2,194 |
| 72. | Lanesville | 4.7% | 9.1%(-4.40)#72 | 10.9%(-6.20)#2,239 |
| 73. | Homecroft | 4.7% | 9.1%(-4.40)#73 | 10.9%(-6.20)#2,243 |
| 74. | Greenwood | 4.8% | 9.1%(-4.30)#74 | 10.9%(-6.10)#2,263 |
| 75. | Vevay | 4.8% | 9.1%(-4.30)#75 | 10.9%(-6.10)#2,307 |
| 76. | Summitville | 4.8% | 9.1%(-4.30)#76 | 10.9%(-6.10)#2,318 |
| 77. | Medaryville | 4.8% | 9.1%(-4.30)#77 | 10.9%(-6.10)#2,324 |
| 78. | Elkhart | 4.9% | 9.1%(-4.20)#78 | 10.9%(-6.00)#2,333 |
| 79. | Batesville | 4.9% | 9.1%(-4.20)#79 | 10.9%(-6.00)#2,359 |
| 80. | Goodland | 5.0% | 9.1%(-4.10)#80 | 10.9%(-5.90)#2,455 |
| 81. | Bluffton | 5.1% | 9.1%(-4.00)#81 | 10.9%(-5.80)#2,488 |
| 82. | Rome City | 5.1% | 9.1%(-4.00)#82 | 10.9%(-5.80)#2,512 |
| 83. | Pennville | 5.1% | 9.1%(-4.00)#83 | 10.9%(-5.80)#2,518 |
| 84. | Valparaiso | 5.2% | 9.1%(-3.90)#84 | 10.9%(-5.70)#2,535 |
| 85. | Spiceland | 5.2% | 9.1%(-3.90)#85 | 10.9%(-5.70)#2,596 |
| 86. | Wilkinson | 5.2% | 9.1%(-3.90)#86 | 10.9%(-5.70)#2,612 |
| 87. | Spring Grove | 5.2% | 9.1%(-3.90)#87 | 10.9%(-5.70)#2,613 |
| 88. | Carmel | 5.3% | 9.1%(-3.80)#88 | 10.9%(-5.60)#2,619 |
| 89. | Crothersville | 5.3% | 9.1%(-3.80)#89 | 10.9%(-5.60)#2,677 |
| 90. | Warren | 5.3% | 9.1%(-3.80)#90 | 10.9%(-5.60)#2,683 |
| 91. | Dublin | 5.4% | 9.1%(-3.70)#91 | 10.9%(-5.50)#2,759 |
| 92. | Wabash | 5.5% | 9.1%(-3.60)#92 | 10.9%(-5.40)#2,791 |
| 93. | Bright | 5.5% | 9.1%(-3.60)#93 | 10.9%(-5.40)#2,804 |
| 94. | Rensselaer | 5.5% | 9.1%(-3.60)#94 | 10.9%(-5.40)#2,807 |
| 95. | Earl Park | 5.5% | 9.1%(-3.60)#95 | 10.9%(-5.40)#2,844 |
| 96. | Highland | 5.7% | 9.1%(-3.40)#96 | 10.9%(-5.20)#2,953 |
| 97. | Tipton | 5.7% | 9.1%(-3.40)#97 | 10.9%(-5.20)#2,954 |
| 98. | Brooklyn | 5.8% | 9.1%(-3.30)#98 | 10.9%(-5.10)#3,051 |
| 99. | Spurgeon | 5.8% | 9.1%(-3.30)#99 | 10.9%(-5.10)#3,083 |
| 100. | Mecca | 5.9% | 9.1%(-3.20)#100 | 10.9%(-5.00)#3,156 |
Common Questions
What are the Top 10 Cities with the Lowest Unemployment Rate Amomg Youth Under the Age of 25 in Indiana?
Top 10 Cities with the Lowest Unemployment Rate Amomg Youth Under the Age of 25 in Indiana are:
#1
0.50%
#2
0.60%
#3
0.90%
#4
1.0%
#5
1.0%
#6
1.1%
#7
1.2%
#8
1.2%
#9
1.4%
#10
1.5%
What city has the Lowest Unemployment Rate Amomg Youth Under the Age of 25 in Indiana?
Greencastle has the Lowest Unemployment Rate Amomg Youth Under the Age of 25 in Indiana with 0.50%.
What is the Unemployment Rate Amomg Youth Under the Age of 25 in the State of Indiana?
Unemployment Rate Amomg Youth Under the Age of 25 in Indiana is 9.1%.
What is the Unemployment Rate Amomg Youth Under the Age of 25 in the United States?
Unemployment Rate Amomg Youth Under the Age of 25 in the United States is 10.9%.