Cities with the Lowest Unemployment Rate Amomg Youth Under the Age of 25 in Kentucky
RELATED REPORTS & OPTIONS
Lowest Unemployment | Youth < 25
Kentucky
Compare Cities
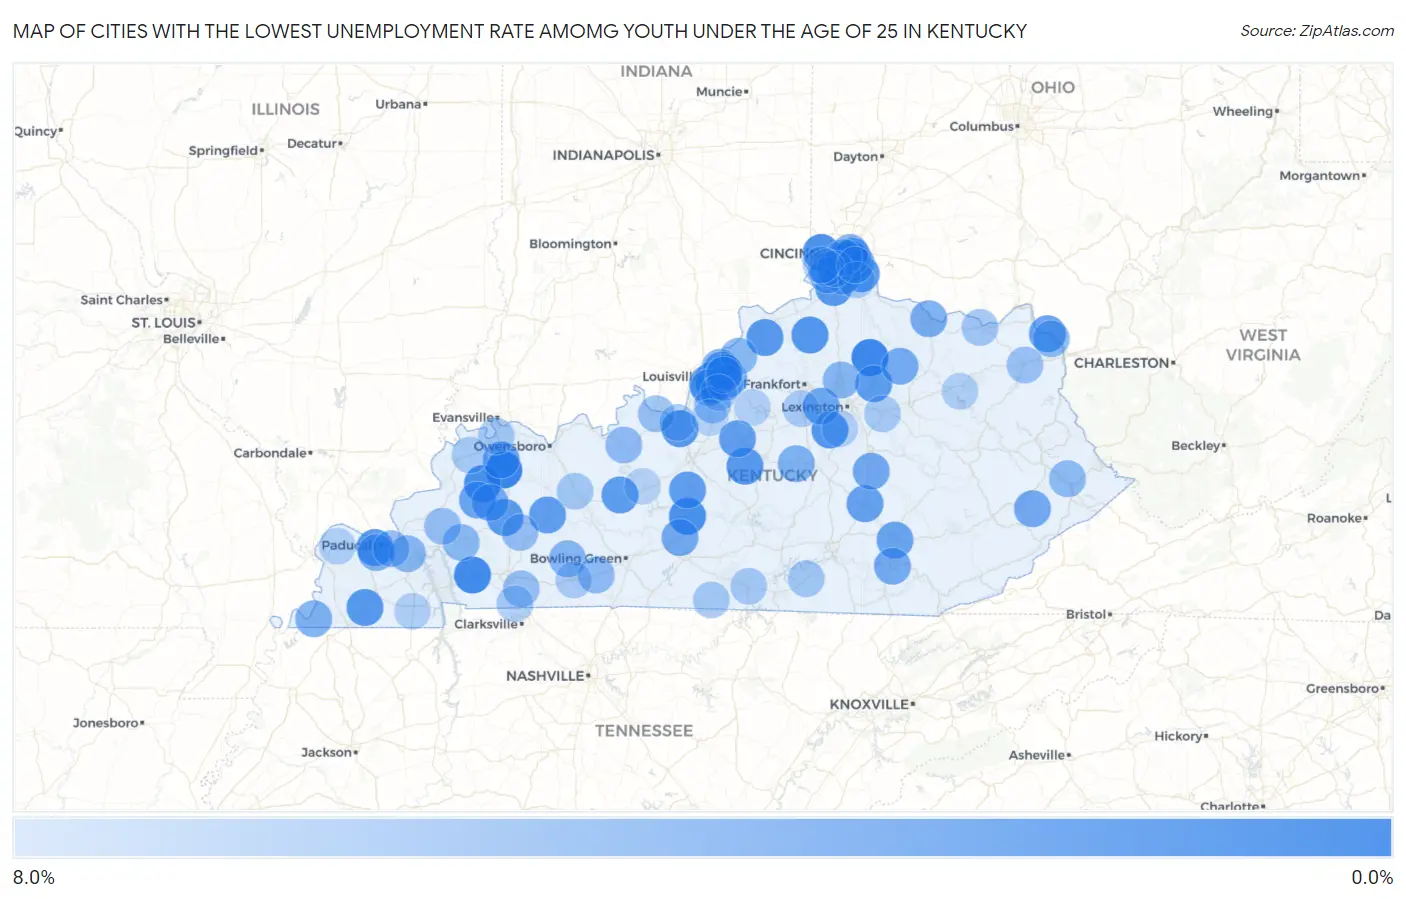
Map of Cities with the Lowest Unemployment Rate Amomg Youth Under the Age of 25 in Kentucky
8.0%
0.0%
Cities with the Lowest Unemployment Rate Amomg Youth Under the Age of 25 in Kentucky
| City | Youth Unemployment | vs State | vs National | |
| 1. | Sebree | 0.90% | 10.2%(-9.30)#1 | 10.9%(-10.00)#112 |
| 2. | Cynthiana | 1.1% | 10.2%(-9.10)#2 | 10.9%(-9.80)#154 |
| 3. | Cadiz | 1.5% | 10.2%(-8.70)#3 | 10.9%(-9.40)#262 |
| 4. | Francisville | 1.8% | 10.2%(-8.40)#4 | 10.9%(-9.10)#365 |
| 5. | Dixon | 1.8% | 10.2%(-8.40)#5 | 10.9%(-9.10)#393 |
| 6. | Munfordville | 2.0% | 10.2%(-8.20)#6 | 10.9%(-8.90)#469 |
| 7. | Crestview | 2.0% | 10.2%(-8.20)#7 | 10.9%(-8.90)#479 |
| 8. | Wilmore | 2.4% | 10.2%(-7.80)#8 | 10.9%(-8.50)#656 |
| 9. | Owenton | 2.4% | 10.2%(-7.80)#9 | 10.9%(-8.50)#680 |
| 10. | Walton | 2.6% | 10.2%(-7.60)#10 | 10.9%(-8.30)#782 |
| 11. | Loretto | 2.6% | 10.2%(-7.60)#11 | 10.9%(-8.30)#818 |
| 12. | Paducah | 2.7% | 10.2%(-7.50)#12 | 10.9%(-8.20)#823 |
| 13. | Campbellsburg | 2.7% | 10.2%(-7.50)#13 | 10.9%(-8.20)#877 |
| 14. | Wingo | 2.7% | 10.2%(-7.50)#14 | 10.9%(-8.20)#884 |
| 15. | Alexandria | 2.8% | 10.2%(-7.40)#15 | 10.9%(-8.10)#907 |
| 16. | Fort Knox | 2.8% | 10.2%(-7.40)#16 | 10.9%(-8.10)#912 |
| 17. | Earlington | 2.8% | 10.2%(-7.40)#17 | 10.9%(-8.10)#941 |
| 18. | Paris | 2.9% | 10.2%(-7.30)#18 | 10.9%(-8.00)#963 |
| 19. | Highland Heights | 2.9% | 10.2%(-7.30)#19 | 10.9%(-8.00)#972 |
| 20. | Caneyville | 3.0% | 10.2%(-7.20)#20 | 10.9%(-7.90)#1,064 |
| 21. | Bardstown | 3.1% | 10.2%(-7.10)#21 | 10.9%(-7.80)#1,079 |
| 22. | Central City | 3.1% | 10.2%(-7.10)#22 | 10.9%(-7.80)#1,094 |
| 23. | Audubon Park | 3.1% | 10.2%(-7.10)#23 | 10.9%(-7.80)#1,128 |
| 24. | Upton | 3.1% | 10.2%(-7.10)#24 | 10.9%(-7.80)#1,135 |
| 25. | Worthington | 3.3% | 10.2%(-6.90)#25 | 10.9%(-7.60)#1,262 |
| 26. | Fort Wright | 3.4% | 10.2%(-6.80)#26 | 10.9%(-7.50)#1,312 |
| 27. | Mount Vernon | 3.5% | 10.2%(-6.70)#27 | 10.9%(-7.40)#1,383 |
| 28. | St Matthews | 3.6% | 10.2%(-6.60)#28 | 10.9%(-7.30)#1,423 |
| 29. | London | 3.7% | 10.2%(-6.50)#29 | 10.9%(-7.20)#1,490 |
| 30. | Providence | 3.7% | 10.2%(-6.50)#30 | 10.9%(-7.20)#1,507 |
| 31. | Robards | 3.7% | 10.2%(-6.50)#31 | 10.9%(-7.20)#1,533 |
| 32. | Versailles | 3.8% | 10.2%(-6.40)#32 | 10.9%(-7.10)#1,559 |
| 33. | Douglass Hills | 3.8% | 10.2%(-6.40)#33 | 10.9%(-7.10)#1,572 |
| 34. | Fort Thomas | 3.9% | 10.2%(-6.30)#34 | 10.9%(-7.00)#1,620 |
| 35. | Berea | 4.0% | 10.2%(-6.20)#35 | 10.9%(-6.90)#1,681 |
| 36. | Southgate | 4.0% | 10.2%(-6.20)#36 | 10.9%(-6.90)#1,706 |
| 37. | Cave City | 4.0% | 10.2%(-6.20)#37 | 10.9%(-6.90)#1,713 |
| 38. | Nebo | 4.0% | 10.2%(-6.20)#38 | 10.9%(-6.90)#1,748 |
| 39. | Langdon Place | 4.1% | 10.2%(-6.10)#39 | 10.9%(-6.80)#1,802 |
| 40. | Pippa Passes | 4.1% | 10.2%(-6.10)#40 | 10.9%(-6.80)#1,806 |
| 41. | Corbin | 4.3% | 10.2%(-5.90)#41 | 10.9%(-6.60)#1,902 |
| 42. | Carlisle | 4.3% | 10.2%(-5.90)#42 | 10.9%(-6.60)#1,921 |
| 43. | Maysville | 4.4% | 10.2%(-5.80)#43 | 10.9%(-6.50)#1,972 |
| 44. | Florence | 4.5% | 10.2%(-5.70)#44 | 10.9%(-6.40)#2,030 |
| 45. | Hickman | 4.7% | 10.2%(-5.50)#45 | 10.9%(-6.20)#2,228 |
| 46. | Green Spring | 4.7% | 10.2%(-5.50)#46 | 10.9%(-6.20)#2,248 |
| 47. | Seneca Gardens | 4.7% | 10.2%(-5.50)#47 | 10.9%(-6.20)#2,249 |
| 48. | West Buechel | 4.8% | 10.2%(-5.40)#48 | 10.9%(-6.10)#2,306 |
| 49. | Perryville | 4.8% | 10.2%(-5.40)#49 | 10.9%(-6.10)#2,322 |
| 50. | Hendron | 4.9% | 10.2%(-5.30)#50 | 10.9%(-6.00)#2,360 |
| 51. | Independence | 5.0% | 10.2%(-5.20)#51 | 10.9%(-5.90)#2,407 |
| 52. | Bellevue | 5.1% | 10.2%(-5.10)#52 | 10.9%(-5.80)#2,495 |
| 53. | Barbourmeade | 5.1% | 10.2%(-5.10)#53 | 10.9%(-5.80)#2,515 |
| 54. | Georgetown | 5.2% | 10.2%(-5.00)#54 | 10.9%(-5.70)#2,533 |
| 55. | Lewisburg | 5.2% | 10.2%(-5.00)#55 | 10.9%(-5.70)#2,595 |
| 56. | Union | 5.3% | 10.2%(-4.90)#56 | 10.9%(-5.60)#2,649 |
| 57. | Calvert City | 5.3% | 10.2%(-4.90)#57 | 10.9%(-5.60)#2,672 |
| 58. | Lynnview | 5.4% | 10.2%(-4.80)#58 | 10.9%(-5.50)#2,763 |
| 59. | Princeton | 5.5% | 10.2%(-4.70)#59 | 10.9%(-5.40)#2,803 |
| 60. | Russell | 5.5% | 10.2%(-4.70)#60 | 10.9%(-5.40)#2,809 |
| 61. | Buckner | 5.5% | 10.2%(-4.70)#61 | 10.9%(-5.40)#2,810 |
| 62. | Coal Run Village | 5.6% | 10.2%(-4.60)#62 | 10.9%(-5.30)#2,907 |
| 63. | Hardinsburg | 5.7% | 10.2%(-4.50)#63 | 10.9%(-5.20)#2,968 |
| 64. | Ledbetter | 5.7% | 10.2%(-4.50)#64 | 10.9%(-5.20)#2,973 |
| 65. | Auburn | 5.7% | 10.2%(-4.50)#65 | 10.9%(-5.20)#2,976 |
| 66. | Hillview | 6.0% | 10.2%(-4.20)#66 | 10.9%(-4.90)#3,191 |
| 67. | White Plains | 6.0% | 10.2%(-4.20)#67 | 10.9%(-4.90)#3,240 |
| 68. | Fredonia | 6.0% | 10.2%(-4.20)#68 | 10.9%(-4.90)#3,254 |
| 69. | Park Hills | 6.1% | 10.2%(-4.10)#69 | 10.9%(-4.80)#3,306 |
| 70. | Elsmere | 6.2% | 10.2%(-4.00)#70 | 10.9%(-4.70)#3,359 |
| 71. | Brandenburg | 6.2% | 10.2%(-4.00)#71 | 10.9%(-4.70)#3,374 |
| 72. | Pembroke | 6.2% | 10.2%(-4.00)#72 | 10.9%(-4.70)#3,393 |
| 73. | Jeffersontown | 6.3% | 10.2%(-3.90)#73 | 10.9%(-4.60)#3,430 |
| 74. | Grayson | 6.4% | 10.2%(-3.80)#74 | 10.9%(-4.50)#3,540 |
| 75. | Meadow Vale | 6.5% | 10.2%(-3.70)#75 | 10.9%(-4.40)#3,641 |
| 76. | Lyndon | 6.6% | 10.2%(-3.60)#76 | 10.9%(-4.30)#3,667 |
| 77. | Vanceburg | 6.6% | 10.2%(-3.60)#77 | 10.9%(-4.30)#3,703 |
| 78. | Oakbrook | 6.7% | 10.2%(-3.50)#78 | 10.9%(-4.20)#3,761 |
| 79. | Henderson | 6.9% | 10.2%(-3.30)#79 | 10.9%(-4.00)#3,908 |
| 80. | Monticello | 6.9% | 10.2%(-3.30)#80 | 10.9%(-4.00)#3,926 |
| 81. | Hartford | 6.9% | 10.2%(-3.30)#81 | 10.9%(-4.00)#3,935 |
| 82. | Muldraugh | 6.9% | 10.2%(-3.30)#82 | 10.9%(-4.00)#3,947 |
| 83. | Oak Grove | 7.0% | 10.2%(-3.20)#83 | 10.9%(-3.90)#3,982 |
| 84. | Tompkinsville | 7.0% | 10.2%(-3.20)#84 | 10.9%(-3.90)#4,003 |
| 85. | Burkesville | 7.0% | 10.2%(-3.20)#85 | 10.9%(-3.90)#4,011 |
| 86. | Winchester | 7.1% | 10.2%(-3.10)#86 | 10.9%(-3.80)#4,032 |
| 87. | Waverly | 7.1% | 10.2%(-3.10)#87 | 10.9%(-3.80)#4,091 |
| 88. | Spring Mill | 7.1% | 10.2%(-3.10)#88 | 10.9%(-3.80)#4,092 |
| 89. | Lawrenceburg | 7.2% | 10.2%(-3.00)#89 | 10.9%(-3.70)#4,129 |
| 90. | Russellville | 7.2% | 10.2%(-3.00)#90 | 10.9%(-3.70)#4,139 |
| 91. | Claryville | 7.3% | 10.2%(-2.90)#91 | 10.9%(-3.60)#4,226 |
| 92. | Burlington | 7.4% | 10.2%(-2.80)#92 | 10.9%(-3.50)#4,273 |
| 93. | La Center | 7.4% | 10.2%(-2.80)#93 | 10.9%(-3.50)#4,319 |
| 94. | Murray | 7.6% | 10.2%(-2.60)#94 | 10.9%(-3.30)#4,422 |
| 95. | Lakeview Heights | 7.6% | 10.2%(-2.60)#95 | 10.9%(-3.30)#4,493 |
| 96. | Nicholasville | 7.7% | 10.2%(-2.50)#96 | 10.9%(-3.20)#4,528 |
| 97. | Taylorsville | 7.7% | 10.2%(-2.50)#97 | 10.9%(-3.20)#4,578 |
| 98. | Cold Spring | 7.8% | 10.2%(-2.40)#98 | 10.9%(-3.10)#4,619 |
| 99. | Shepherdsville | 7.9% | 10.2%(-2.30)#99 | 10.9%(-3.00)#4,679 |
| 100. | Leitchfield | 7.9% | 10.2%(-2.30)#100 | 10.9%(-3.00)#4,692 |
Common Questions
What are the Top 10 Cities with the Lowest Unemployment Rate Amomg Youth Under the Age of 25 in Kentucky?
Top 10 Cities with the Lowest Unemployment Rate Amomg Youth Under the Age of 25 in Kentucky are:
#1
0.90%
#2
1.1%
#3
1.5%
#4
1.8%
#5
1.8%
#6
2.0%
#7
2.0%
#8
2.4%
#9
2.4%
#10
2.6%
What city has the Lowest Unemployment Rate Amomg Youth Under the Age of 25 in Kentucky?
Sebree has the Lowest Unemployment Rate Amomg Youth Under the Age of 25 in Kentucky with 0.90%.
What is the Unemployment Rate Amomg Youth Under the Age of 25 in the State of Kentucky?
Unemployment Rate Amomg Youth Under the Age of 25 in Kentucky is 10.2%.
What is the Unemployment Rate Amomg Youth Under the Age of 25 in the United States?
Unemployment Rate Amomg Youth Under the Age of 25 in the United States is 10.9%.